. 2021 Nov 8;49(19):11274-11293.
doi: 10.1093/nar/gkab802.

Atypical molecular features of RNA silencing against the phloem-restricted polerovirus TuYV

Affiliations

Atypical molecular features of RNA silencing against the phloem-restricted polerovirus TuYV

Marion Clavel et al. Nucleic Acids Res. .

Abstract

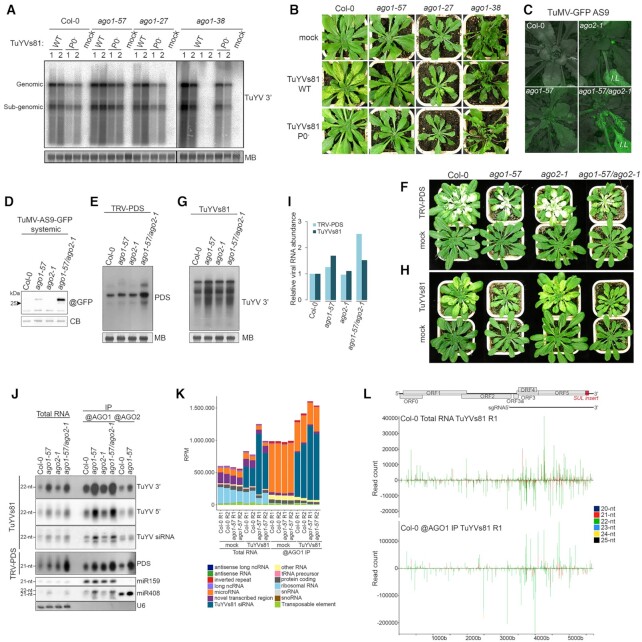
In plants and some animal lineages, RNA silencing is an efficient and adaptable defense mechanism against viruses. To counter it, viruses encode suppressor proteins that interfere with RNA silencing. Phloem-restricted viruses are spreading at an alarming rate and cause substantial reduction of crop yield, but how they interact with their hosts at the molecular level is still insufficiently understood. Here, we investigate the antiviral response against phloem-restricted turnip yellows virus (TuYV) in the model plant Arabidopsis thaliana. Using a combination of genetics, deep sequencing, and mechanical vasculature enrichment, we show that the main axis of silencing active against TuYV involves 22-nt vsiRNA production by DCL2, and their preferential loading into AGO1. Moreover, we identify vascular secondary siRNA produced from plant transcripts and initiated by DCL2-processed AGO1-loaded vsiRNA. Unexpectedly, and despite the viral encoded VSR P0 previously shown to mediate degradation of AGO proteins, vascular AGO1 undergoes specific post-translational stabilization during TuYV infection. Collectively, our work uncovers the complexity of antiviral RNA silencing against phloem-restricted TuYV and prompts a re-assessment of the role of its suppressor of silencing P0 during genuine infection.


Figures

Figure 1.
Figure 1.
AGO1 is the main Argonaute protein involved in defense against turnip yellows virus. (A) Accumulation of TuYVs81 RNA in systemic leaves of Col-0, ago1-57, ago1-27 and ago1-38 plants at 19 days post-infiltration (dpi) with either WT or P0-less (P0) virus. Mock stands for mock-inoculated plants. Each lane represents a pool of four to seven individuals from which RNA was extracted from either the youngest rosette leaves (1) or older rosette leaves with yellow veins (2). For ago1-38 that did not display any vein yellowing, leaves were sampled in a similar fashion from plants displaying reddened leaves (left) or not (right, no virus accumulation). Viral RNA abundance was measured by RNA gel blot; loading control is obtained by staining the membrane with methylene blue (MB). ‘@’ indicates hybridization with DNA probe against the 3′ part of the TuYV genome. Samples were run on the same gel on two levels. Samples that ran on the bottom row are thus separated by a line. (B) Representative image of the infected genotypes analyzed in (A). (C) Representative image of the TuMV-AS9-GFP infected plants at 9 dpi. Successful systemic movement is achieved only in ago1-57 and the double mutant while expression of viral-derived GFP in the inoculated leaves (IL) is clearly visible. (D) Rescue of the TuMV-AS9-GFP systemic movement in the single ago1-57 and the double ago1-57/ago2-1 genetic backgrounds. Systemic leaves of TuMV-AS9-GFP inoculated plants were harvested at 13 dpi (n = 5 plants), and GFP protein content was measured by immunoblot. ‘@’ indicates hybridization with GFP antibody, loading control is obtained by post-staining the membrane with coomassie blue (CB). (E) Accumulation of TRV-PDS RNA in systemic leaves in the indicated genotypes at 20 dpi (n = 5 plants) measured by RNA gel blot. ‘@’ indicates hybridization with DNA probe against the PDS insert and loading control is obtained by staining the membrane with methylene blue (MB). (F) Representative individuals infected with TRV-PDS displaying systemic leaf whitening due to the silencing of the PDS gene. (G) Accumulation of TuYVs81 RNA in systemic leaves in the indicated genotypes at 20 dpi (n = 5 plants) measured by RNA gel blot. ‘@’ indicates hybridization with DNA probe and loading control is obtained by staining the membrane with methylene blue (MB). (H) Representative individuals infected with TuYVs81 displaying systemic vein yellowing. (I) Quantification of viral RNA signal in (E) and (G) relative to Col-0 and normalized to MB signal. (J) vsiRNA abundance in total RNA, AGO1 and AGO2 immunoprecipitates in TuYVs81 and TRV-PDS infected leaves. ‘@’ indicates hybridization with DNA probe or use of a specific antibody for immunoprecipitation. (K) Global quantification of 21-nt to 24-nt small RNA reads aligned to the reference Arabidopsis genome and TuYVs81 genome per functional categories (araport11), expressed as (RPM) reads per million ([category count × 1 000 000]/total mapped reads). Libraries were obtained from total RNA and AGO1 IP in mock-inoculated (mock) or infected (TuYVs81) systemic leaves at 16 dpi (n = 7 or 8 individual plants per replicate). R1 = replicate 1, R2 = replicate 2. (L) Distribution of TuYVs81-derived sRNA reads (20-nt to 25-nt) along the TuYVs81 genome in Col-0 total RNA and AGO1 IP replicate 1 (R1), with MISIS. Bars indicate the position of the 5′ (+strand) and 3′ (–strand) extremity of each mapped sRNA. Y-axis represents read counts, and each size category is represented in the indicated color.
Figure 2.
Figure 2.
ago1-57 uniquely affects systemic movement of TuYVs81 due to delayed viral RNA accumulation after agrobacterium-mediated inoculation but fails to provide any protective effect in vector-mediated infection. (A) Kinetic of systemic TuYVs81 infection in Col-0, ago1-57, ago1-27 and ago1-38 represented as the cumulated percentage of infected plants in the inoculated population (n = 14 individuals per genotype). To avoid any confounding effect introduced by VIGS deficiency in the mutants, infected individuals were scored by the detection of the TuYVs81 readthrough protein (RT, ORF5) in leaf patch from young systemic leaves at 6, 7, 9, 12, 15 and 21 dpi using either western or dot blot. Plants that exhibit systemic VIGS in between these sampling times are also counted as infected at the time point at which the VIGS was first observed. (B) TuYVs81 viral RNA abundance in systemic leaves of the indicated mutants at 15 dpi measured by RNA blot. Each sample represents a mix of leaf patches for all infected individuals at that time point in the kinetic. ‘@’ indicates hybridization with DNA probe and loading control is obtained by staining the membrane with methylene blue (MB). (C) Kinetic of systemic TuMV-GFP infection in Col-0, ago1-57, ago1-27 and ago1-38 represented as the cumulated percentage of infected plants in the inoculated population (n = 6 individuals per genotype). Infected individuals were scored by the detection of GFP in systemic leaves at the indicated day. (D) Detection of TuMV-GFP in systemic leaves of the indicated mutants at 9 dpi measured by immunoblot. ‘@’ indicates hybridization with GFP antibody, loading control is obtained by post-staining the membrane with Coomassie blue (CB). (E) ago1-57 displays delayed viral RNA accumulation after inoculation. Measurement of TuYVs81 RNA in inoculated leaves at 0, 49, 95 and 120 h post infiltration (hpi) measured by RT-qPCR in the indicated genetic backgrounds represented as bar graph relative to Col-0 49hpi. Represented values are means of technical triplicates, error bars represent the SEM. For each time point, five infiltrated leaves from four individuals were harvested for each genotype. *P < 0.05, **P < 0.01, ***P < 0.001 with Student's t-test, one-tailed, paired. (F) Accumulation of TuYVs81 readthrough protein (RT) at 0, 49, 95 and 120 h post infiltration (hpi) measured by immunoblot. Samples are from the same tissues as in (E). ‘@’ indicates hybridization with RT antibody, loading control is obtained by post-staining the membrane with Coomassie blue (CB). (G) G371D mutation does not confer undegradability to AGO1 in presence of P0 from diverse polerovirus species. Left panel: Schematic representation of the P0 protein, with the region containing the F-box motif highlighted in red and the corresponding alignment of P0 from turnip yellows virus (TuYV), cucurbit aphid-borne yellows virus (CABYV), beet mild yellowing virus (BMYV) and potato leafroll virus (PLRV) shown below. The minimal F-box motif is boxed in red, and the sequence logo for the alignment is shown below. Right panel: AGO1 degradation test in N. benthamiana. Both versions of CFP-AGO1 (WT or G371D) were expressed either without (ø) or with the indicated P0 proteins in two separate leaves and an equivalent amount of leaf patches were collected at 4 dpi. All infiltrated patches contain P19. Fusion protein levels were assessed by immunoblot on two different membranes (GFP corresponds to Coomassie stain CB1 and cMyc to CB2) and ‘@’ indicates hybridization with the corresponding specific antibody. Expression of the untagged P0 constructs was verified by RNA blot using DNA probes specific for each sequence (@ P0) and equal loading was assessed by staining the corresponding membrane with methylene blue (MB1 and MB2). (H) Detection and quantification of aphid-transmitted WT TuYV virions in systemic leaves of Col-0 or ago1-57 individual plants by DAS-ELISA. Eighteen-day-old plants were individually challenged with two Myzus persicae fed on either 20% sucrose solution (+Suc) or 20% sucrose solution containing 67mg/ml TuYV virions (+TuYV) or alternatively were left untreated (N.I). Each bar represents the mean OD at 405 nm (technical triplicate measurements) for a single individual within the considered category, and error bars represent SD. Individuals for which the OD was ≤ to those of the NI and +Suc control plants are considered as non-infected and are colored in black. Difference between the Col-0 and ago1-57 populations is statistically different (Kruskal and Wallis test). (I) Fresh weight measurement of all the analyzed plants in (H) after removal of the non-infected plants, expressed in mg. ***P < 0.001 (two-way ANOVA followed by Tukey honest significant differences test to compare both genotypes and treatments).
Figure 3.
Figure 3.
TuYvs81 RNA is mainly processed by DCL2 into 22-nt vsiRNA, yet both DCL2 and DCL4 are necessary to efficiently silence the virus. (A) Analysis of vsiRNA size in infected TuYVs81 infected plants at 17 dpi using RNA gel blot. Most of the vsiRNA populations is of 22-nt and is lost in a dcl2-1 single or combination mutant. ‘@’ indicates hybridization with the indicated DNA probe. Endogenous siRNA are used to control for the proper identity of the dcl mutants and U6 signal is the loading control. (B) Representative image of the infected genotypes analyzed in (A). Left panel: whole plant view. Right panel: inset of young systemic leaves. White arrow indicate very feint vein yellowing. (C) TuYVs81 viral RNA abundance in systemic leaves of the indicated mutants at 17 dpi measured by RT-qPCR. Levels are displayed relative to infected Col-0. Each sample represents a pool of several individuals from the indicated genotype. Only individuals that scored positive for the presence of systemic TuYVs81 (via detection of the RT protein in leaf patches) were harvested. P value above each sample is for pairwise comparison of the sample to Col-0. *P < 0.05, **P < 0.01, ***P < 0.001 with Student's t-test, two-tailed, unequal variance. (D) Both DCL2 and DCL4 are redirected to cytosolic viral replication complexes (VRC) during TuYVs81 infection and colocalize with viral double stranded RNA. Representative single plane confocal images of transiently expressed 35S:tRFP, 35S:DCL2genomic-tRFP and 35S:DCL4genomic-tRFP with (TuYVs81) or without (mock) the virus in leaves of transgenic N. benthamiana stably expressing the double-stranded RNA-binding B2-GFP protein. Observations are from leaf discs of 3–5 days post-infiltration. Inset scale bar is 10 μm. See also Supplementary Figure S5 for additional images.
Figure 4.
Figure 4.
DCL2 processing is not a consequence of detectable viral manipulation in the infected vasculature. (A) Measurement of TuYVs81 RNA in systemic whole leaves of Col-0 and dcl2-1 plants (n = 8–10 individuals) or enriched vascular bundles of the equivalent plants (n = 20 leaves) at 17 dpi by RT-qPCR represented as bar graph relative to infected Col-0 leaves. Represented values are means of technical triplicates, error bars represent the SEM. **P < 0.01, with Student's t-test, one-tailed, paired. (B) Analysis of sRNA abundance in total RNA extracted from the whole leaf or the vasculature of mock (−) or TuYVs81 infected (+) Col-0 and ago1-57 plants by RNA gel blot. For leaf tissue, a mixture of infected leaves from several individual was used (n = 8) and enriched vascular bundles (n = 24 leaves) were obtained from the equivalent plants at 16 dpi. ‘@’ indicates hybridization with DNA probe and U6 signal is the loading control. (C) Detection of the DCL1 and viral RT proteins in total protein extracted from the whole leaf or the vasculature of mock (−) or TuYVs81 infected (+) Col-0 and ago1-57 plants by immunoblot. Samples were prepared from the same material as in (B). ‘@’ indicates hybridization antibodies, loading control is obtained by post-staining the membrane with Coomassie blue (DCL1 corresponds to Coomassie stain CB1 and RT to CB2). (D) Measurement of DCL2 and DCL4 mRNA abundance in the same samples as (A) by RT-qPCR, represented as bar graph relative to - Col-0 vasculatures. Note that loss-of-function allele dcl2-1 contains WT level of DCL2 messenger RNA. Represented values are means of technical triplicates, error bars represent the SEM. **P < 0.01, ns P > 0.05 with Student's t-test, two-tailed, paired. See Supplementary Figure S6C for an additional experiment. (E) Analysis of TRV-PDS (+) infected whole leaves and vasculature of Col-0 plants (n = 9 individuals, 8 leaves for vasculature) at 16 dpi by RNA gel blot. Top panel: sRNA blot shows equivalent profiles of vsiRNA made against the PDS insert that are mostly processed by DCL4 into 21-nt. An oligoprobe recognizing the conserved 3′ of RNA1 and 2 of TRV shows that this portion of the viral RNA is mostly processed by DCL2 into 22-nt, irrespective of the tissue. Bottom panel: TRV RNA is present in both tissue types and is not enriched in the vasculature. ‘@’ indicates hybridization with DNA probe, U6 signal and methylene blue staining are the loading control. Note that chloroplastic 16S and 23S rRNA are only visible in whole leaf. (F) Measurement of TuYVs81 RNA in systemic Col-0 whole leaves (n = 8–10 individuals) or enriched vascular bundles of the equivalent plants (n = 20 leaves) at 17 dpi by RT-qPCR represented as bar graph relative to infected leaves. Plants were inoculated either with the empty vector (mock), with the WT TuYVs81 or with a P0-less mutant. Represented values are means of technical triplicates, error bars represent the SEM. **P < 0.01, ***P < 0.001 with Student's t-test, one-tailed, paired. (G) Analysis of vsiRNA profile from whole leaf of Col-0 plants infected with either WT TuYVs81 or the P0-less TuYVs81 by RNA gel blot. Samples are the same as in (F), infected dcl2-1 is used a control for the absence of 22-nt. ‘@’ indicates hybridization with DNA probe and U6 signal is the loading control.
Figure 5.
Figure 5.
Vascular AGO1 is post-translationally stabilized in presence of TuYVs81 and loaded viral 22-nt siRNA promotes production of secondary siRNA. (A) Measurement of TuYVs81 RNA in systemic whole leaves of Col-0 and ago1-57 plants (n = 8) or enriched vascular bundles of the equivalent plants (n = 24 leaves) at 16 dpi by RT-qPCR represented as bar graph relative to infected Col-0 leaves. Represented values are means of technical triplicates, error bars represent the SEM. *P < 0.05, ***P < 0.001 with Student's t-test, one-tailed, paired between tissues, unequal variance between genotypes. (B) Representative immunoblot of AGO1 and AGO2 accumulation in systemic whole leaves (n = 12 individuals) and in enriched vascular bundles of the equivalent plants (n = 18 leaves) at 21 dpi in Col-0 and ago1-57, in the absence (−) or presence (+) of TuYVs81. ‘@’ indicates hybridization with the indicated antibodies, and loading control is obtained by post-staining the membrane with Coomassie blue (AGO1 on CB1 and AGO2 on CB2). (C) Quantification of the AGO1 signal normalized to total protein signal (Coomassie blue stain, whole lane) in Col-0 vasculatures without (mock) or in the presence of TuYVs81. Collected values represent 5 biological replicates in which vasculatures were enriched at either 15, 16, 17 or 21 dpi from different infection experiments. P-value = 0.001196 with Student's t-test, one-tailed, paired. (D) Representative single plane confocal images of transiently expressed 35S:tRFP-AGO1 with (TuYVs81) or without (mock) the virus in leaves of transgenic N. benthamiana stably expressing the double-stranded RNA-binding B2-GFP protein. Observations are from leaf discs at 3 dpi. Inset scale bar is 10 μm. See also Supplementary Figure S8A for additional images. (E) P0 colocalizes with viral double stranded RNA. Representative confocal images of transiently expressed 35S:P0-tRFPwith (TuYVs81) or without (mock) the virus in leaves of transgenic N. benthamiana stably expressing the double-stranded RNA-binding B2-GFP protein. Observations are from leaf discs at 3 dpi. Inset scale bar is 10 μm. See also Supplementary Figure S8B for additional images. (F) Levels of AGO1 and AGO2 mRNA are not significantly affected by the presence of TuYVs81 in the plant vasculature. mRNA abundance in the same samples as (A) by RT-qPCR, represented as bar graph relative to Col-0 vasculatures. Represented values are means of technical triplicates, error bars represent the SEM. *P < 0.05, ns P > 0.05 with Student's t-test, two-tailed, paired. See Supplementary Figure S7E for an additional experiment. (G) Analysis of AGO1 and AGO2 protein level in enriched vascular bundles of Col-0 or dcl2-1 plants (n = 20 leaves from 8 to 10 individuals per genotype and treatment) at 17 dpi after inoculation with E.V (−), TuYVs81 WT or TuYVs81 P0. ‘@’ indicates hybridization with the indicated antibodies, and loading control is obtained by post-staining the membrane with Coomassie blue (AGO1 on CB1 and AGO2 on CB2). (H) Persistent companion cell expression of P0 enhances spreading of SUL siRNA. Image of representative individual adult plants of WT, pCoYMV:P0-HA WT and LP1 in the SS background. (I) Vascular AGO1 is degraded in presence of WT P0-HA. Immunoblot of AGO1 and P0-HA accumulation in whole leaves (n = 4 individuals) and in enriched vascular bundles of the equivalent plants (n = 10–16 leaves) in the indicated genotypes. Plants are the same as in (H). ‘@’ indicates hybridization with the indicated antibodies, and loading control is obtained by post-staining the membrane with Coomassie blue (CB). (J) Analysis of sRNA abundance in total RNA extracted from the whole leaf or vasculature by RNA gel blot. RNA were obtained from the same samples as in (I). ‘@’ indicates hybridization with DNA probe and U6 signal is the loading control. (K) Degradation of AGO1 by vascular P0 leads to increased abundance of the AGO1 mRNA in the vasculature and decrease of the total amount of CHLI1 and CHLI2 mRNA. mRNA abundance in the same samples as (J) by RT-qPCR, represented as bar graph relative to SS leaf. Represented values are means of technical triplicates, error bars represent the SEM. ***P < 0.001, **P < 0.01, ns P > 0.05 with Student's t-test, two-tailed, equal variance. (L) Heatmap of annotation units showing the most variation in small RNA abundance across the eight AGO1 IP libraries. (M) Top panel: Schematic representation of the TuYVs81 genomeSUL insert is represented as a red square in 3′ of the viral sequence. Bottom panel: Browser view of normalized sRNA reads (CPM count per million of mapped reads) mapping on both strands of CHLI1 and CHLI2 genes (0mm). Red squares represent the regions in the transcript that are identical to the SUL insert of TuYVs81. sRNA reads present within the pink highlighted area are directly produced from the viral RNA and trigger the production of the secondary siRNA population found in 3′ of both transcripts. Production of secondary siRNA is impaired in ago1-57 plants.

References

    1. Pumplin N., Voinnet O.. RNA silencing suppression by plant pathogens: defence, counter-defence and counter-counter-defence. Nat. Rev. Microbiol. 2013; 11:745–760. - PubMed
    1. Yang Z., Li Y.. Dissection of RNAi-based antiviral immunity in plants. Curr. Opin. Virol. 2018; 32:88–99. - PubMed
    1. Blevins T., Rajeswaran R., Shivaprasad P. V., Beknazariants D., Si-Ammour A., Park H.S., Vazquez F., Robertson D., Meins F., Hohn T.et al. .. Four plant Dicers mediate viral small RNA biogenesis and DNA virus induced silencing. Nucleic Acids Res. 2006; 34:6233–6246. - PMC - PubMed
    1. Bouché N., Lauressergues D., Gasciolli V., Vaucheret H.. An antagonistic function for Arabidopsis DCL2 in development and a new function for DCL4 in generating viral siRNAs. EMBO J. 2006; 25:3347–3356. - PMC - PubMed
    1. Deleris A., Gallago-Bartolome J., Bao J., Kasschau K.D., Carrington J.C., Voinnet O.. Hierarchical action and inhibition of plant dicer-like proteins in antiviral defense. Science (80-.). 2006; 313:68–71. - PubMed

Publication types

MeSH terms