. 2021 Nov 22;31(22):5102-5110.e5.
doi: 10.1016/j.cub.2021.09.027. Epub 2021 Oct 5.

Spatial organization of transcribing loci during early genome activation in Drosophila

Affiliations

Spatial organization of transcribing loci during early genome activation in Drosophila

Shao-Kuei Huang et al. Curr Biol. .

Abstract

The early Drosophila embryo provides unique experimental advantages for addressing fundamental questions of gene regulation at multiple levels of organization, from individual gene loci to the entire genome. Using 1.5-h-old Drosophila embryos undergoing the first wave of genome activation,1 we detected ∼110 discrete "speckles" of RNA polymerase II (RNA Pol II) per nucleus, two of which were larger and localized to the histone locus bodies (HLBs).2,3 In the absence of the primary driver of Drosophila genome activation, the pioneer factor Zelda (Zld),1,4,5 70% fewer speckles were present; however, the HLBs tended to be larger than wild-type (WT) HLBs, indicating that RNA Pol II accumulates at the HLBs in the absence of robust early-gene transcription. We observed a uniform distribution of distances between active genes in the nuclei of both WT and zld mutant embryos, indicating that early co-regulated genes do not cluster into nuclear sub-domains. However, in instances whereby transcribing genes did come into close 3D proximity (within 400 nm), they were found to have distinct RNA Pol II speckles. In contrast to the emerging model whereby active genes are clustered to facilitate co-regulation and sharing of transcriptional resources, our data support an "individualist" model of gene control at early genome activation in Drosophila. This model is in contrast to a "collectivist" model, where active genes are spatially clustered and share transcriptional resources, motivating rigorous tests of both models in other experimental systems.

Keywords: RNA polymerase II; Zelda; genome activation; histone locus body; speckles.


Conflict of interest statement

Declaration of interests The authors declare no competing interests.

Figures
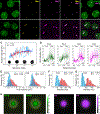
Figure 1.
Figure 1.. Pol-II accumulates at the HLBs in the absence of early gene transcription.
(A and B) Immunofluorescence of wt (A) and zld (B) nc12 embryos using antibodies against RPB1 for Pol-II (green), Multi sex Combs (Mxc, yellow), and His3 RNA (magenta). Scale bar = 1 μm. (C) Total levels of Pol-II fluorescence plotted across a pseudo-time axis. The average voxel intensity of Pol-II was plotted using the median sphericity value of each image. A loess regression line shows similar increases of total Pol-II for both genotypes. Example Hoechst-stained nuclei for the corresponding sphericity values are shown as insets, highlighting the dramatic change in nuclear morphology across the pseudo-time axis. (D) Pol-II and His3 fluorescence at the HLBs plotted in the same manner described in (C). Values were generated by taking the mean voxel value of a sphere with a radius of 500 nm centered on the positions of HLBs. We highlighted distinct “Early” and “Late” phases as images where the median sphericity value was greater or less than 0.75 respectively (see white versus grey shading in Figure 1D panels). Pol-II and His3 within each genotype agree well across the pseudo-time axis. (E) Histograms of volumes of HLBs based on Pol-II signal in both “Early” (left) and “Late” (right) embryos (wt shaded in blue, zld in coral). Volumes were calculated via a thresholding technique (see Methods) and by counting the number of voxels satisfied by those determined thresholds. Distributions of volumes show significant differences in both Early and Late stages. (F and G) All Pol-II (F) and His3 (G) fluorescence value distributions are from “Early” embryos. Large differences are seen between wt (blue) and zld (coral). (H) HLB metaprofiles (collated 2 μm × 2 μm images with HLBs at the center) showing Pol-II (green) and His3 fluorescence (magenta) intensities in wt (left) and zld (right). Heat maps indicate increasing fluorescence intensity, with white as max intensity and decreasing through green to yellow to black. Note the overall “shelled” organization of wt and zld HLBs are similar; the zld HLBs are on average simply larger. Sample numbers are indicated in the upper left (C) or right (E-G) corner of the panel; the same samples were used for the histograms (F-G) and metaprofiles (H).
Figure 2.
Figure 2.. Zld dictates Pol-II speckle number and intensity in early embryos.
(A) Fluorescence imaging of RNA Pol-II and smFISH of the transcripts produced by the sog-lacZ (3TAG) enhancer reporter transgene. Spots of RNA Pol-II show overlap with high intensity FISH staining, assumed to be the sites of nascent transcription. The number of nascent transcripts measured scales with brightness of the corresponding RNA Pol-II spot. (B) smFISH spot intensities ranked in order of intensity show a “stairstep” pattern, indicating discrete numbers of underlying molecules labeled by the probe set. Each step increases on average by 1650 AU, giving an estimate of the fluorescence produced by a single molecule. (C) Number of molecules plotted against the fluorescence of the corresponding RNA Pol-II spot. A strong linear correlation agrees with the assumption that the population of Pol-II within each spot is coupled to nascent transcripts, and therefore represent actively elongating polymerases. (D) Box plot showing the distribution of Pol-II spots in wt (blue) and zld (coral) in early (lighter) versus late (darker) interphase. Sample numbers indicated underneath the plots. wt nuclei contain more spots in both early (94.8±13.0) and late (136±26.1) interphase than zld early (33.5±13.8) and late (42±17.7). The difference in spot counts between early and late interphase is significant (Mann-Whitney Rank Sum Test) for both genotypes: wt (p<.001) and zld (p=0.03). (E-F) Histograms of Pol-II fluorescence intensity (AU) distributions for wt (blue) and zld (coral) embryos in early interphase (E), wt: 1158±370.8 and zld :1071±292.3) and late interphase (F), wt: 1225±379.5 and zld :1074±241.9). The difference in spot intensities between wt and zld are significant (Mann-Whitney Rank Sum Test) for both early (p<.001) and late interphase (p<.001). (G) 3TAG/0TAG heterozygous embryo stained with antibodies against Pol-II (green) and smFISH probes against yellow (yellow) and lacZ (magenta) to detect nascent transcript foci. Scale bar = 1 μm. (H) Metaprofiles (2 μm × 2 μm images) of Pol-II fluorescence intensity at 3TAG-y (left) and 0TAG-lacZ (right) foci in lateral neuroectoderm (top) and ventral mesoderm (bottom) nuclei where Dl levels are low and high, respectively. (I) Box plot distributions of genotypes in (H) showing significant differences in Pol-II intensities between 3TAG and 0TAG in both regions (p=0.001), and between 0TAG in the mesoderm versus neuroectoderm (p=0.001), but not 3TAG (p=0.11). Sample numbers are indicated underneath the plots. In all box plots, the box includes the 25th-75th percentile with the horizontal line marking the median. The lower and upper whiskers reach to 10th and 90th percentiles, respectively, and the outliers are shown as dots.
Figure 3.
Figure 3.. Pol-II speckles are distributed evenly and randomly throughout the nucleus in both wt and zld.
(A) Synthetic point patterns distributed uniformly (left), in a gradient along the radius (center), or clustered within a nuclear sphere (right). Note that a reverse gradient or extreme clustering (one cluster only) could also occur. (B) The ratio of shell density, ρ(shell), of Pol-II spots to global density of spots, ρ, as a function of distance from the center of mass of each nucleus for wt (blue) and zld (coral) embryos. Simulated hypothetical ratios are shown as dashed lines, uniform (red) and a center-to-periphery gradient (purple). (C) Schematic example of Pol-II speckles in a nucleus. One speckle (orange), its neighbors (blue), and lines between them (red) are highlighted. (D) Probability distribution functions of the distance between nearest neighbors (V(r)) in wt (solid blue line) compared to hypothetical uniform (red dashed line) and clustered (black dashed line) distributions in the same density shown in (A). (E) Probability distribution function of distances between nearest neighbors (V(r)) in wt (blue) and zld (coral) nuclei. The shift of the coral curve to the right reflecting greater distances between spots is due to the reduced total number of spots in zld embryos, while the shift down occurs since Y-axis measures frequency.
Figure 4.
Figure 4.. Zld co-regulated genes do not share Pol-II speckles or increased transcriptional output when in close proximity.
A) Integrated Genome Browser view of Pol-II ChIP-seq peaks in a 5Mb region of chromosome 2, with one-dimension (1D) distances labeled for several pairs of active genes. (B-E) 3D Imaris views of single nuclei with dual color FISH for the following pairs of genes (color code indicated): CG15382 and CG14014 (B), Bsg25D and CG14014 (C), slam and slam#2 (D), and hb and slam (E). Distances are measured by Imaris software. slam and slam #2 are two probes for slam mRNA, 78bp apart. (F-I) Zoom-in 3D images of Pol-II immunofluorescence (IF) (green) and dual color RNA FISH for the following pairs of genes (color code indicated and distances between FISH foci centers shown on the left): Bsg25D and CG14014 (F), elba1 and slam (G), elba2 and slam (H), and CG15382 and CG14014 (I). Note that Pol-II spots overlap with each RNA FISH signal, and are separable. Scale bar = 500 nm. (J) Images of Pol-II IF (green) and elba1 RNA FISH (magenta) on sister chromatids. Note the elba1 signals have not separated completely, though the associated Pol-II spots are separable (233nm apart). Scale bar = 500 nm. (K) Box plot showing the ratio of smFISH signal intensity (close proximity/distant) for each gene of each pair tested (as indicated); close proximity pairs are <400nm apart, distant pairs are 500nm and up apart (see distribution of distances in Figure S4B). There is no significant difference between each experimental group and its control group (Mann-Whitney Rank Sum Test, p-values inside box plot).

References

    1. Liang HL, Nien CY, Liu HY, Metzstein MM, Kirov N, and Rushlow C (2008). The zinc-finger protein Zelda is a key activator of the early zygotic genome in Drosophila. Nature 456, 400–403. 10.1038/nature07388. - DOI - PMC - PubMed
    1. White AE, Leslie ME, Calvi BR, Marzluff WF, and Duronio RJ (2007). Developmental and cell cycle regulation of the Drosophila histone locus body. Mol Biol Cell 18, 2491–2502. 10.1091/mbc.e06-11-1033. - DOI - PMC - PubMed
    1. Nizami ZF, Deryusheva S, and Gall JG (2010). Cajal bodies and histone locus bodies in Drosophila and Xenopus. Cold Spring Harb Symp Quant Biol 75, 313–320. 10.1101/sqb.2010.75.005. - DOI - PubMed
    1. Nien CY, Liang HL, Butcher S, Sun Y, Fu S, Gocha T, Kirov N, Manak JR, and Rushlow C (2011). Temporal coordination of gene networks by Zelda in the early Drosophila embryo. PLoS Genet 7, e1002339. 10.1371/journal.pgen.1002339. - DOI - PMC - PubMed
    1. Harrison MM, Botchan MR, and Cline TW (2010). Grainyhead and Zelda compete for binding to the promoters of the earliest-expressed Drosophila genes. Dev Biol 345, 248–255. 10.1016/j.ydbio.2010.06.026. - DOI - PMC - PubMed

Publication types

MeSH terms