. 2021 Dec 14;54(12):2893-2907.e5.
doi: 10.1016/j.immuni.2021.09.011. Epub 2021 Sep 21.

mRNA vaccination of naive and COVID-19-recovered individuals elicits potent memory B cells that recognize SARS-CoV-2 variants

Affiliations

mRNA vaccination of naive and COVID-19-recovered individuals elicits potent memory B cells that recognize SARS-CoV-2 variants

Aurélien Sokal et al. Immunity. .

Abstract

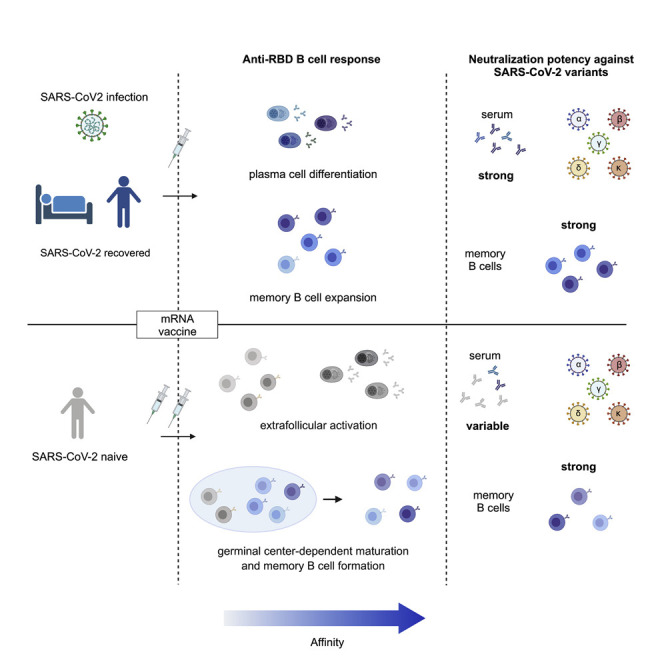
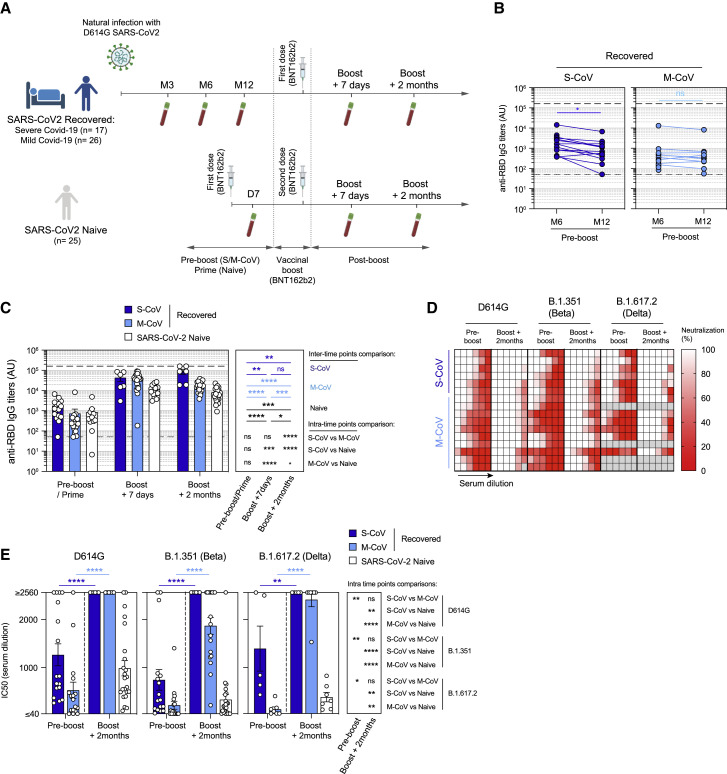
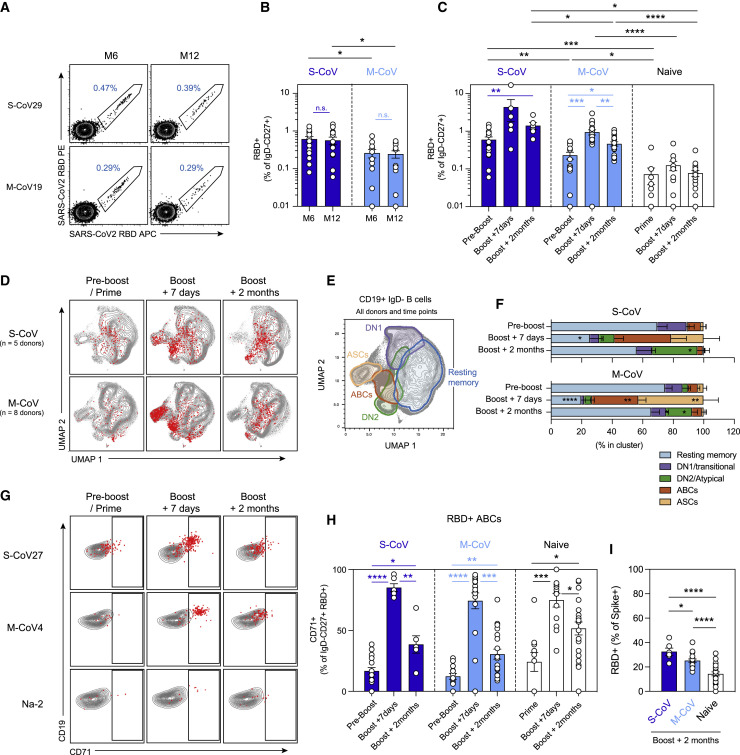
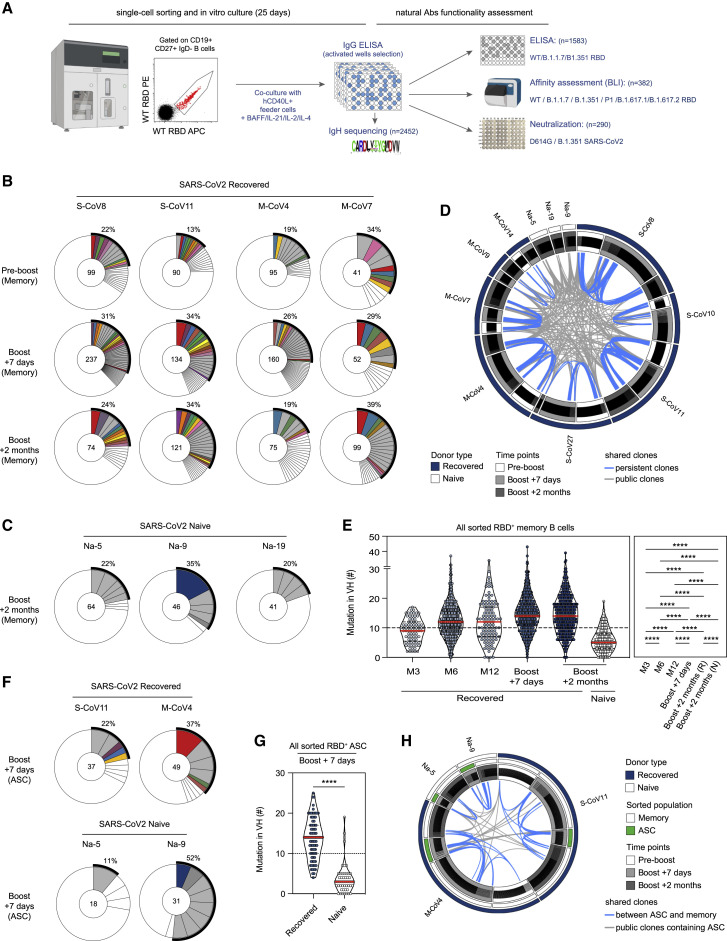
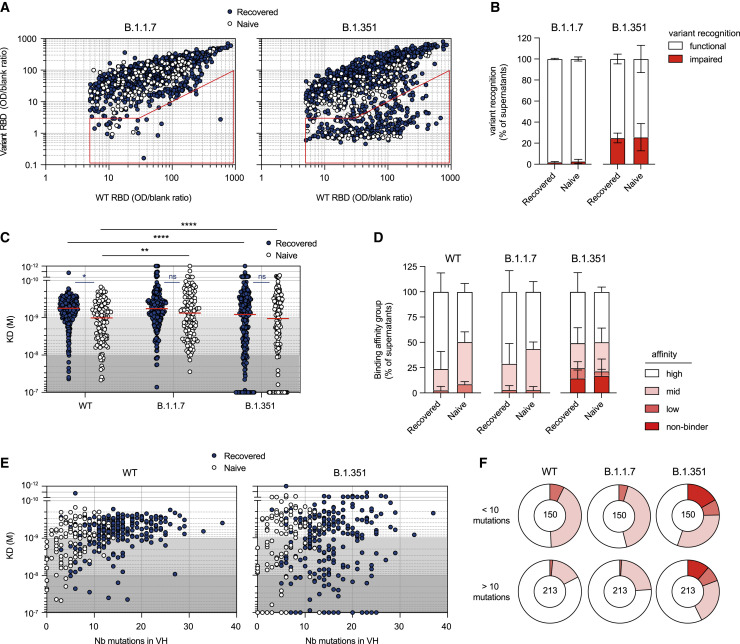
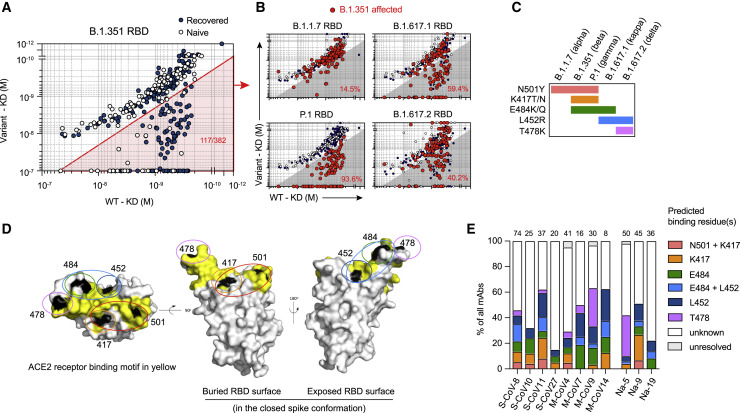
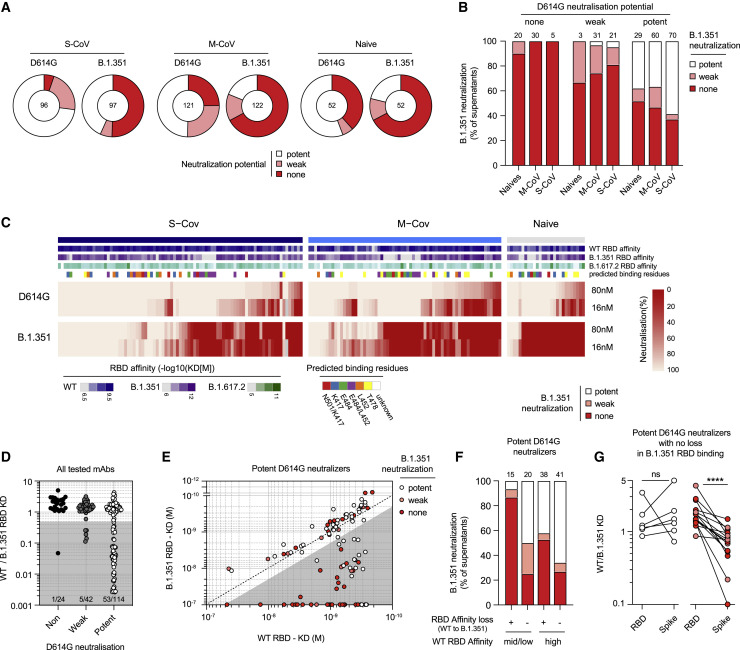
In addition to serum immunoglobulins, memory B cell (MBC) generation against severe acute respiratory syndrome coronavirus 2 (SARS-CoV-2) is another layer of immune protection, but the quality of MBC responses in naive and coronavirus disease 2019 (COVID-19)-recovered individuals after vaccination remains ill defined. We studied longitudinal cohorts of naive and disease-recovered individuals for up to 2 months after SARS-CoV-2 mRNA vaccination. We assessed the quality of the memory response by analysis of antibody repertoires, affinity, and neutralization against variants of concern (VOCs) using unbiased cultures of 2,452 MBCs. Upon boosting, the MBC pool of recovered individuals expanded selectively, matured further, and harbored potent neutralizers against VOCs. Although naive individuals had weaker neutralizing serum responses, half of their RBD-specific MBCs displayed high affinity toward multiple VOCs, including delta (B.1.617.2), and one-third retained neutralizing potency against beta (B.1.351). Our data suggest that an additional challenge in naive vaccinees could recall such affinity-matured MBCs and allow them to respond efficiently to VOCs.

Keywords: B-cell memory; BNT162b2 vaccine; COVID-19; RBD; affinity maturation; germinal center; neutralizing antibody; plasma cells; somatic hypermutation.


Conflict of interest statement

Declaration of interests Outside of the submitted work, M. Mahévas. received research funds from GSK and personal fees from LFB and Amgen. J.-C.W. received consulting fees from Institut Mérieux. P.B. received consulting fees from Regeneron Pharmaceuticals. J.-M.P. received personal fees from Abbvie, Gilead, Merck, and Siemens Healthcare. F.R. is a member of the board of MELETIOS Therapeutics and of the Scientific Advisory Board of eureKARE.

Figures

None
Graphical abstract
Figure 1
Figure 1
The mRNA vaccine boosts humoral response against SARS-CoV-2 and VOCs in naive and SARS-CoV-2-recovered individuals (A) Cohort design. (B) Anti-SARS-CoV-2 RBD serum IgG titers measured by ELISA in S-CoV (n = 16, left panel, dark blue) and M-CoV (n = 15, right panel, light blue) 6 and 12 months after symptom onset. (C) Evolution of anti-SARS-CoV-2 RBD serum IgG titers after BNT162b2 vaccination. IgG titers (arbitrary units [a.u.]) are shown at pre-boost (month 6 or month 12) for SARS-CoV-2-recovered (S-CoV, dark blue; M-CoV, light blue) or after the prime for naive individuals (white) as well as 7 days and 2 months after the vaccine boost. Bars indicate mean ± SEM. (B and C) The lower dashed line indicates the positivity threshold, and the upper dashed line indicates the upper limit of detection as provided by the manufacturer. (D) Heatmap representing the observed in vitro neutralization of D614G SARS-CoV-2 (left), B.1.351 (center), and B.1.617.2 VOCs (right) by sera from SARS-CoV-2-recovered individuals at the pre-boost and boost + 2 months time points (serial dilutions: 1/10, 1/40, 1/160, 1/640, 1/2,560, and 1/10,240). Each line represents one individual. (E) Half-maximal inhibitory concentration (IC50) for all sera tested from SARS-CoV-2-recovered and naive individuals at pre-boost and boost + 2 months time points against D614G SARS-CoV-2, B.1.351, and B.1.617.2 VOCs. Bars indicate mean ± SEM. We performed two-way ANOVA with multiple comparisons of all groups (B), repeated-measures mixed-effects model analysis with two sets of multiple comparisons (between donor groups inside each time point and between time points for each donor group) (C), and repeated-measures mixed-effects model analysis with multiple comparisons between time points for each recovered donor group and Kruskal-Wallis with multiple comparisons between donor groups inside each time point (E) (Benjamini, Krieger, and Yekutieli false discovery rate [FDR] correction was used for all multiple comparisons). ∗∗∗∗p < 0.0001, ∗∗∗p < 0.001, ∗∗p < 0.01, p < 0.05. See also Figure S1 and Tables S1 and S2.
Figure 2
Figure 2
mRNA vaccination activates multiple SARS-CoV-2 RBD-specific B cell subsets in SARS-CoV-2-recovered and naive individuals (A) Representative dot plot of SARS-CoV-2 RBD staining of CD19+IgDCD27+CD38int/− MBCs at 6 and 12 months in one S-CoV and one M-CoV representative individual. (B and C) Frequencies of SARS-CoV-2 RBD-specific cells in live CD19+IgDCD27+CD38int/− MBCs 6 and 12 months after symptom onset in SARS-CoV-2-recovered individuals (S-CoV: dark blue, n = 14/14; M-CoV: light blue, n = 11/12) (B) and at pre-boost, boost + 7 days, and boost + 2 months time points in S-CoV (dark blue, n = 17/6/6), M-CoV (light-blue, n = 14/21/20), and naive (white, n = 10/13/23) individuals. Bars indicate mean ± SEM. (D) UMAP projections of concatenated CD19+IgD B cells multiparametric fluorescence-activated cell sorting (FACS) analysis from 5 S-CoV and 8 M-CoV individuals, analyzed longitudinally. His-tagged labeled SARS-CoV-2 RBD-specific cells are overlaid as red dots. (E and F) Unsupervised clustering (FlowSOM) performed on the concatenated FACS dataset. Main defined clusters (>2% of total CD19+IgD B cells) are shown as overlaid contour plots on the global UMAP representation (E). Cluster distribution of SARS-CoV-2 RBD-specific cells in identified clusters, at the indicated time point, is further displayed as bar plots (F). Bars indicate mean ± SEM. (G) Representative dot plots for CD71 and CD19 expression in IgDCD19+CD38int/− B cells at the indicated time points from representative S-CoV, M-CoV, and naive individuals. SARS-CoV-2 RBD-specific MBCs are overlaid as red dots. (H) Frequencies of SARS-CoV-2 RBD-specific cells displaying an ABC (CD19+CD27+IgDCD71+) phenotype at the indicated time points. (I) Proportion of S-specific MBCs recognizing the RBD in each individual at the 2-month time point. Bars indicate mean ± SEM. We performed two-way ANOVA with multiple comparisons of all groups (B), repeated-measures mixed-effects model analysis with two sets of multiple comparisons (between donor groups inside each time point [black lines] and between time points for each donor group [colored lines]) (C and H), and ordinary one-way ANOVA (I) (Benjamini, Krieger, and Yekutieli FDR correction was used for all multiple comparisons). Only significant comparisons are highlighted in (C), (H), and (I). ∗∗∗p < 0.0001, ∗∗∗p < 0.001, ∗∗p < 0.01, p < 0.05. See also Figure S2 and Table S2.
Figure 3
Figure 3
mRNA vaccination elicits a diverse RBD-specific MBC repertoire in SARS-CoV-2-recovered and naive individuals (A) Experimental scheme for functional assessment of naturally expressed monoclonal antibodies from RBD-specific MBCs. (B and C) Pie charts representing the clonal distribution of RBD-specific MBCs sorted from 2 S-CoV and 2 M-CoV individuals at the pre-boost, boost + 7 days, and boost + 2 months time points (B) and 2 naive individuals at boost + 2 months (C). Clonal representation is depicted according to Wang et al. (2021b): colored slices indicate an expanded MBC clone (2 or more sequences at a given time point) found at several time points in the same individual (persistent clone) or in clonal relationship with ASCs at boost + 7 days, gray slices indicate an expanded MBC clone found at a single time point, and white slices indicate unique sequences found at several time points. The main white sector in each pie chart represents unique sequences observed at a single time point. The outer black semi-circular line indicates the proportion of sequences belonging to expanded clones at a given time point. The total number of sequences is indicated at the pie center. (D) Circos plot showing clonal relationships between all sequenced RBD-specific MBCs grouped by donors and time points. Blue lines connect persistent clones, and gray lines connect clones shared by at least two donors (public clones). (E) Violin plots showing the number of mutations in the VH segment of RBD-specific MBCs at successive time points in SARS-CoV-2-recovered (month 3, 81 sequences; month 6, 600; month 12, 109; boost + 7 days, 930; boost + 2 months, 430) and naive donors (boost + 2 months, 151). The red line indicates the median. (F) Pie chart representing the clonal distribution of RBD-specific ASCs sorted for 2 SARS-CoV-2-recovered and 2 naive individuals at boost + 7 days. Colored slices indicate a clone in clonal relationship with an expanded MBC clone from the same donor, gray slices indicate an expanded ASC clone not found in MBCs from the same donor, and white slices indicate unique ASC sequences in a clonal relationship with a non-expanded MBC clone. The outer black semi-circular line indicates the proportion of sequences belonging to expanded ASC clones. The total number of sequences is indicated at the pie center. (G) Violin plots showing the number of mutations in the VH segment of RBD-specific ASCs sorted from 2 SARS-CoV-2-recovered (n = 86 sequences) and 2 naive donors (n = 49 sequences) at boost + 7 days. The red line indicates the median. (H) Circos plot showing clonal relationships between RBD-specific MBCs (white mid-semicircular slice) and RBD-specific ASCs (green mid-semicircular slice) sorted at boost + 7 days from 2 SARS-CoV-2-recovered (one S-CoV, one M-CoV, dark blue outer circular slice) and 2 naive (white outer circular slice) individuals. Blue lines indicate shared clones between ASCs and MBCs, and gray lines indicate public clones containing ASCs. Ordinary one-way ANOVA with multiple comparisons (Benjamini, Krieger, and Yekutieli FDR correction) (G) and a two-tailed Mann-Whitney test (E) were performed (∗∗∗∗p < 0.0001). See also Figure S3 and Table S2.
Figure 4
Figure 4
The MBC pool of vaccinated individuals contains high-affinity clones against WT SARS-CoV-2 and B.1.1.7 and B.1.351 VOCs (A) WT RBD versus B.1.1.7 RBD (left) or B.1.351 RBD ELISA values (right) for all single-cell culture supernatants of RBD-specific MBCs isolated from SARS-CoV-2-recovered (dark blue, n = 952) and naive (white, n = 373) donors. Only supernatants with WT ELISA OD/blank ratio ≥ 5 are displayed. The red sector identifies naturally expressed antibodies defined as impaired in the recognition of a given variant (variant ELISA OD/blank ratio < 3 or ≥ 10-fold decrease in variant recognition). (B) Frequencies of single RBD-specific MBC culture supernatants with functional or impaired recognition of B.1.1.7 or B.1.351 RBD variants as assessed by ELISA. (C) Dissociation constants (KD, expressed as moles/L) measured by BLI for 382 naturally expressed monoclonal antibodies against WT, B.1.1.7, and B.1.351 RBD. Tested monoclonal antibodies were selected randomly from single-cell culture supernatants of RBD-specific MBCs isolated from SARS-CoV-2-recovered (n = 251) and naive donors (n = 131) and displaying WT RBD ELISA OD/blank ratio ≥ 3. Background colors define high-affinity (KD < 10−9 M), mid-affinity (10−9 ≤ KD < 10−8 M), and low-affinity (10−8 ≤ KD < 10−7) monoclonal antibodies. All monoclonal antibodies with no measurable affinity (KD ≥ 10−7) were considered non-binders. (D) Histogram showing the intra-donor binding affinity distribution of monoclonal antibodies tested against WT, B.1.1.7, and B.1.351 RBD variants, as defined in (C), for SARS-CoV-2-recovered or naive donors. Bars indicate mean ± SEM. (E) Measured KD (M) against WT (left) or B.1.351 RBD (right) versus number of VH mutations for all tested monoclonal antibodies with available VH sequence from SARS-CoV-2-recovered (dark blue, n = 249) and naive (white, n = 114)) donors (Spearman correlations for all sequences: VH mutation/WT KD, r = 0.3791, p < 0.0001; VH mutation/B.1.351 KD, r = 0.152, p = 0.0033). (F) Pie chart showing the binding affinity distribution of all tested monoclonal antibodies with low (<10 mutations, top panel) or high VH mutation numbers (>10, bottom panel) against WT, B.1.1.7, and B.1.351 RBD variants as defined in (C). Numbers at center of the pie chart indicate the total number of tested monoclonal antibodies in each group. A two-way ANOVA with two sets of multiple comparisons (between tested variants inside each group (black lines) and between groups for each tested variants (colored lines)) was performed (C; Benjamini, Krieger and Yekutieli FDR correction). ∗∗∗∗p < 0.0001, ∗∗p < 0.01, p < 0.05. See also Figure S4 and Table S2.
Figure 5
Figure 5
The variant RBD recognition profile reveals key residues recognized by MBCs mobilized by the mRNA vaccine boost (A) Dot plot representing the KD values for B.1.351 RBD versus WT RBD for all tested monoclonal antibodies from SARS-CoV-2-recovered (dark blue dots) and naive donors (white dots). The red shaded zone indicates B.1.351-affected monoclonal antibodies, defined as those with at least 2-fold increased KD for B.1.351 compared with the WT RBD. (B) Dot plots representing the KD values for B.1.1.7, P.1, B.1.617.1, and B.1.617.2 RBD versus WT RBD. B.1.351-affected monoclonal antibodies are highlighted as larger red dots (corresponding to clones present in the red sector in A). Percentages indicate the proportion of B.1.351-affected monoclonal antibodies also affected by the indicated RBD variant. (C) Distribution of known mutations in the RBD domain between B.1.1.7, B.1.351, P.1, B.1.617.1, and B.1.617.2 SARS-CoV-2 variants. (D) RBD (extracted from the PDB: 6XR8 S protein trimer structure) shown in three orthogonal views, with the ACE2 receptor binding motif highlighted in yellow and the residues found mutated in a least one of the tested variants (L452, K417, T478, E484, and N501) highlighted in black. Single or a group of predicted binding residues are further highlighted by colored ovals according to the color scheme used in (E). (E) Frequencies of predicted essential binding residues, as defined by RBD variants recognition profile in BLI, for all monoclonal antibodies isolated from each of the 11 tested donors. Numbers of tested monoclonal antibodies for each donor are indicated on top of each histogram. See also Figure S5 and Table S2.
Figure 6
Figure 6
A substantial proportion of MBCs in vaccinated individuals neutralizes D614G SARS-CoV-2 and B.1.351 VOCs (A) Pie charts showing the proportion of single-cell culture supernatants of RBD-specific MBCs isolated from SARS-CoV-2-recovered (S-CoV, n = 104; M-CoV, n = 123) and naive donors (n = 52) displaying potent, weak, or no neutralization potential (none) against the D614G SARS-CoV-2 and B.1.351 SARS-CoV-2 variants. Potent neutralizers are defined as more than 80% neutralization at 16 nM and weak neutralizer as neutralization less than 80% at 16 nM but more than 80% at 80 nM. Others were defined as non-neutralizing. (B) Histogram showing the proportion of B.1.351 SARS-CoV-2 potent, weak, and non-neutralizing single-RBD-specific MBC culture supernatants, grouped based on their neutralization potency against D614G SARS-CoV-2. (C) Heatmap showing in vitro neutralization of the D614G SARS-CoV-2 and B.1.351 variants at 80 nM and 16 nM for all culture supernatants whose monoclonal antibodies were also tested in BLI against all variants (S-CoV, n = 85; M-CoV, n = 67; naive, n = 27). KD (M) values against the WT, B.1.351, and B.1.617.2 RBD for each monoclonal antibody are represented on top, along with predicted binding residues. (D) Ratio of WT over B.1.351 RBD KD values for all monoclonal antibodies displayed in (C), grouped based on their neutralization potency against D614G SARS-CoV-2. (E) KD (M) values against B.1.351 versus WT RBD for all D614G SARS-CoV-2 potent neutralizer monoclonal antibodies. Dot color indicates the neutralization potency against the B.1.351 SARS-CoV-2 variant. Gray shade highlights binding-impaired clones against the B.1.351 RBD variant as defined in Figure 5A. (F) B.1.351 SARS-CoV-2 neutralization potency distribution of all tested potent D614G SARS-CoV-2 neutralizers, grouped based on their affinity for the WT RBD and affinity loss against B.1.351. (G) WT versus B.1.351 variant RBD or S KD ratio for selected monoclonal antibodies showing no clear B.1.351 RBD binding impairment and no loss (left) or clear loss (right) of neutralization potency against the B.1.351 SARS-CoV-2 variant. A paired Wilcoxon test was performed (∗∗∗∗p < 0.0001). See also Figure S6 and Table S2.

References

    1. Abu-Raddad L.J., Chemaitelly H., Butt A.A., National Study Group for COVID-19 Vaccination Effectiveness of the BNT162b2 Covid-19 Vaccine against the B.1.1.7 and B.1.351 Variants. N. Engl. J. Med. 2021;385:187–189. - PMC - PubMed
    1. Andrews S.F., Huang Y., Kaur K., Popova L.I., Ho I.Y., Pauli N.T., Henry Dunand C.J., Taylor W.M., Lim S., Huang M., et al. Immune history profoundly affects broadly protective B cell responses to influenza. Sci. Transl. Med. 2015;7:316ra192. - PMC - PubMed
    1. Baden L.R., El Sahly H.M., Essink B., Kotloff K., Frey S., Novak R., Diemert D., Spector S.A., Rouphael N., Creech C.B., et al. COVE Study Group Efficacy and Safety of the mRNA-1273 SARS-CoV-2 Vaccine. N. Engl. J. Med. 2021;384:403–416. - PMC - PubMed
    1. Barnes C.O., West A.P., Jr., Huey-Tubman K.E., Hoffmann M.A.G., Sharaf N.G., Hoffman P.R., Koranda N., Gristick H.B., Gaebler C., Muecksch F., et al. Structures of Human Antibodies Bound to SARS-CoV-2 Spike Reveal Common Epitopes and Recurrent Features of Antibodies. Cell. 2020;182:828–842.e16. - PMC - PubMed
    1. Cai Y., Zhang J., Xiao T., Peng H., Sterling S.M., Walsh R.M., Jr., Rawson S., Rits-Volloch S., Chen B. Distinct conformational states of SARS-CoV-2 spike protein. Science. 2020;369:1586–1592. - PMC - PubMed

Publication types

Supplementary concepts