. 2021 Dec 1;109(23):3810-3822.e9.
doi: 10.1016/j.neuron.2021.09.003. Epub 2021 Oct 5.

Flexible inhibitory control of visually evoked defensive behavior by the ventral lateral geniculate nucleus

Affiliations

Flexible inhibitory control of visually evoked defensive behavior by the ventral lateral geniculate nucleus

Alex Fratzl et al. Neuron. .

Abstract

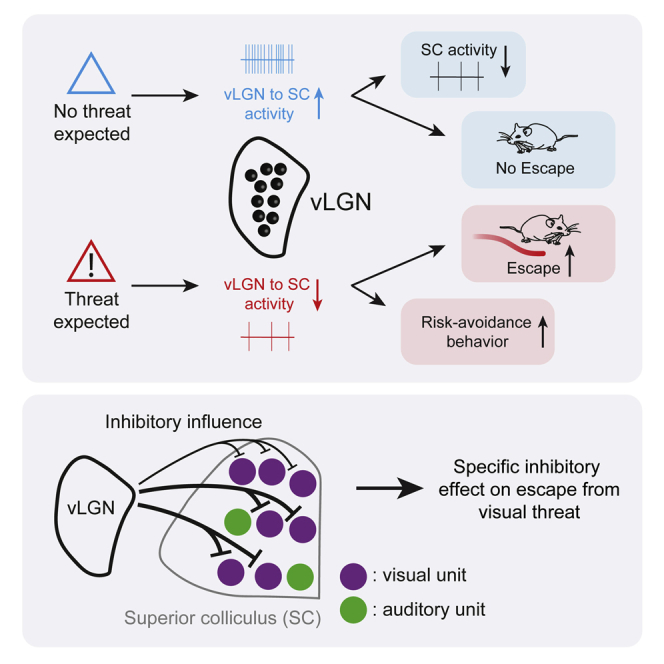
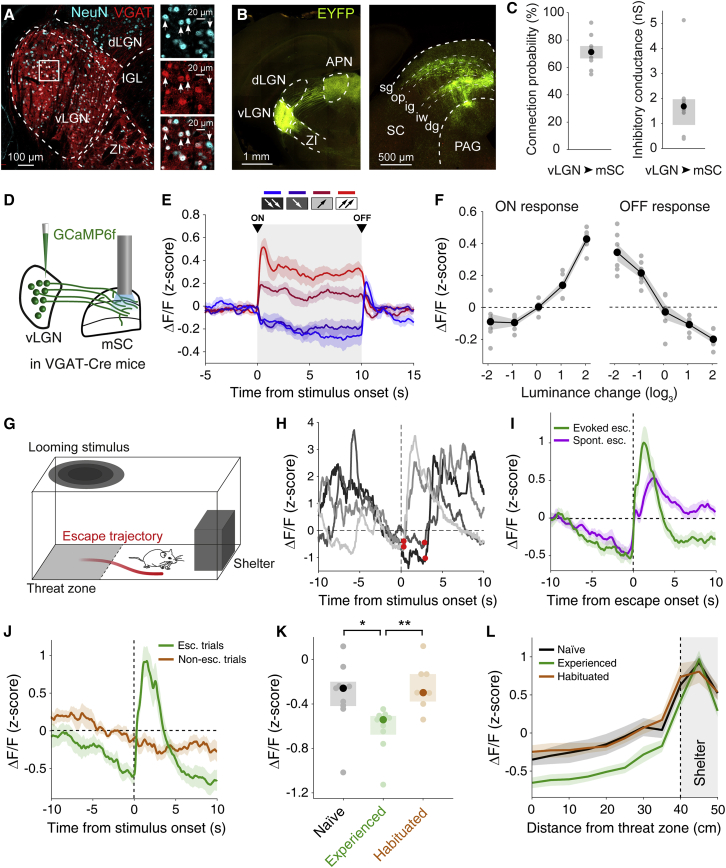
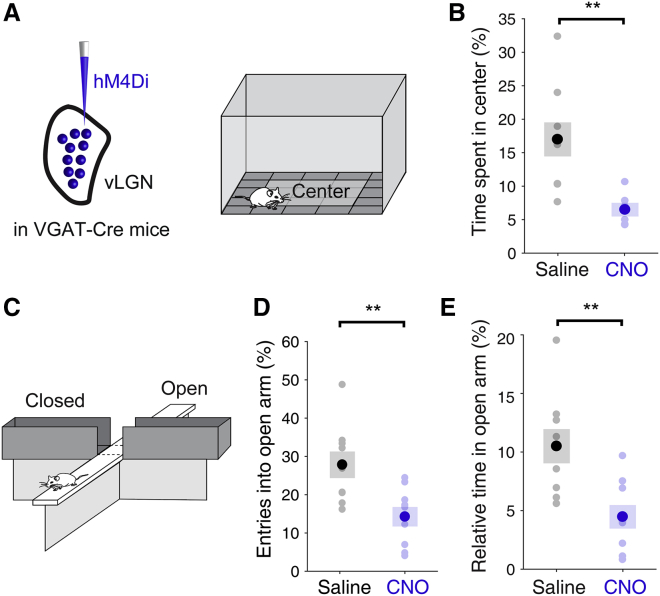
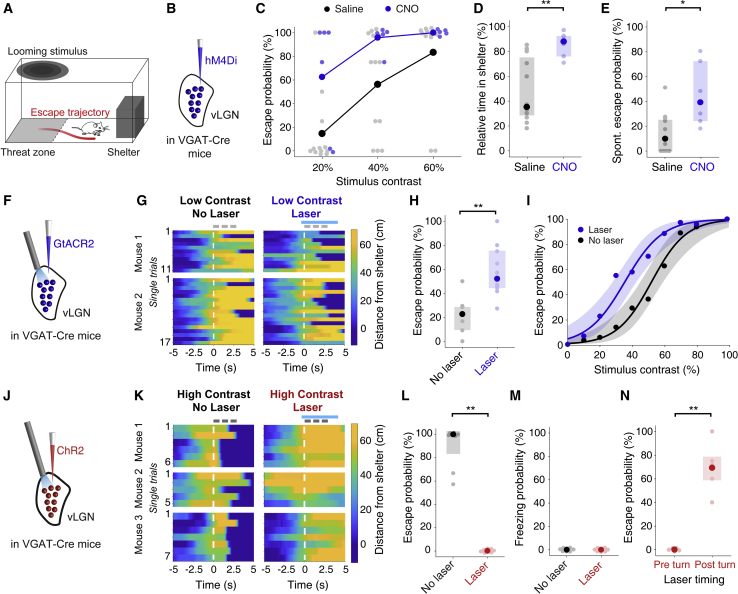
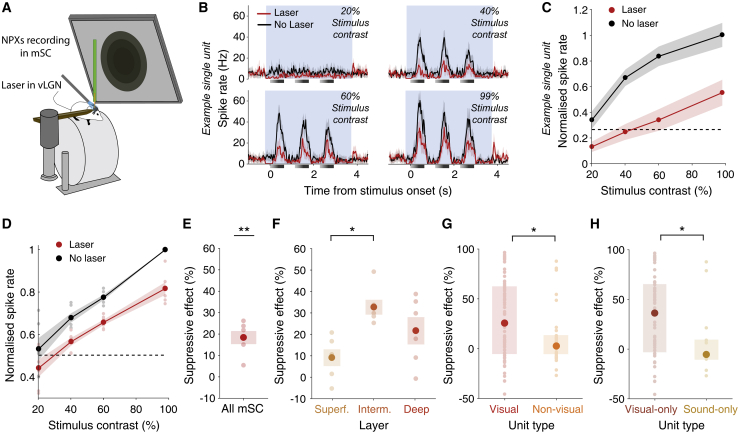
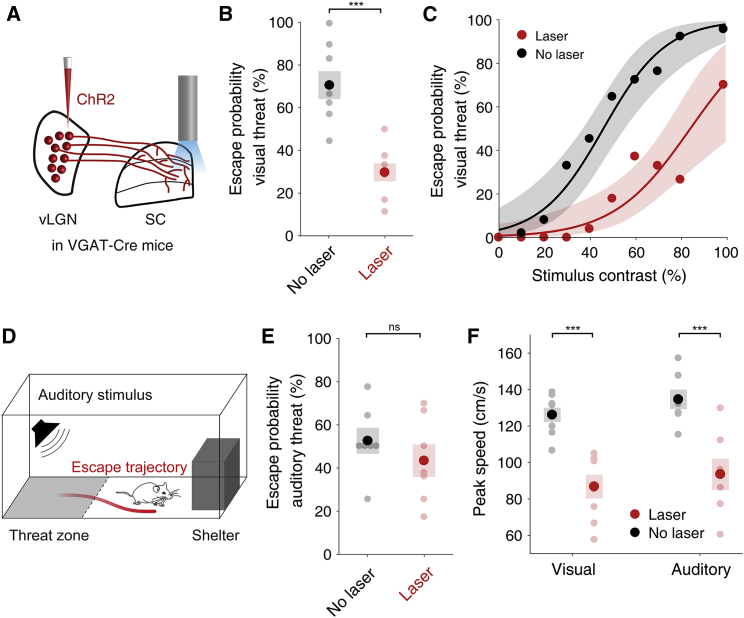
Animals can choose to act upon, or to ignore, sensory stimuli, depending on circumstance and prior knowledge. This flexibility is thought to depend on neural inhibition, through suppression of inappropriate and disinhibition of appropriate actions. Here, we identified the ventral lateral geniculate nucleus (vLGN), an inhibitory prethalamic area, as a critical node for control of visually evoked defensive responses in mice. The activity of vLGN projections to the medial superior colliculus (mSC) is modulated by previous experience of threatening stimuli, tracks the perceived threat level in the environment, and is low prior to escape from a visual threat. Optogenetic stimulation of the vLGN abolishes escape responses, and suppressing its activity lowers the threshold for escape and increases risk-avoidance behavior. The vLGN most strongly affects visual threat responses, potentially via modality-specific inhibition of mSC circuits. Thus, inhibitory vLGN circuits control defensive behavior, depending on an animal's prior experience and its anticipation of danger in the environment.

Keywords: behavioral control; escape behavior; inhibitory control; instinctive behavior; long-range inhibition; mouse; prethalamus; superior colliculus; ventral lateral geniculate nucleus; visually guided behavior.


Conflict of interest statement

Declaration of interests The authors declare no competing interests.

Figures

None
Graphical abstract
Figure 1
Figure 1
Activity of vLGN axons in mSC reflects previous experience of threat (A) Example images of tdTomato expression in VGAT+ neurons in the vLGN (red), combined with NeuN staining (cyan). Images on the right are from the inset in the left image, showing only NeuN staining (top), tdTomato expression (middle), and both combined (bottom). Arrows indicate examples of NeuN+ neurons. (B) Left, expression of EYFP in the vLGN after injection of AAV-flex-EYFP in VGAT-Cre mice. Right, GABAergic vLGN axons in the SC and PAG. APN, anterior pretectal nucleus; dLGN, dorsal lateral geniculate nucleus; IGL, intergeniculate leaflet; PAG, periaqueductal gray; SC, superior colliculus; vLGN, ventral lateral geniculate nucleus; ZI, zona incerta. SC layers: sg, superficial gray layer; op, optical layer; ig, intermediate gray layer; iw, intermediate white layer; dg, deep gray layer. (C) Left, mean connection probability between GABAergic vLGN axons and cells in the medial SC (mSC), observed using ChR2-assisted circuit mapping in vitro. Error bars represent standard errors of the mean (SEM) across mice. Right, median inhibitory conductance in mSC cells in response to stimulation of GABAergic vLGN axons. Error bars represent the interquartile range (IQR) across mice. Grey dots represent data from single animals; n = 8 mice, 81 cells. (D) Experimental paradigm for fiber photometry recordings of calcium signals from GABAergic vLGN axons in the mSC. (E) Mean calcium activity of vLGN axons in the mSC in response to increases (27 cd × m−2, magenta; 81 cd × m−2, red) and decreases (3 cd × m−2, indigo; 1 cd × m−2, blue) in luminance from baseline levels (9 cd × m−2). Stimulus duration is indicated by gray shading. Error-bar shading represents SEM across mice; n = 6 mice. (F) Mean change in calcium activity due to the onset (ON response, left; see Method details) and the offset (OFF response, right) of the change in luminance. Luminance change values are the base-3 logarithm of the ratio between the stimulus and baseline luminance. Grey dots represent data points from individual mice. Shading shows SEM across mice; n = 6 mice. (G) Schematic of the experimental approach. Red line denotes escape trajectory. (H) Four representative single-trial calcium traces of vLGN axons in the mSC during threat-evoked escape aligned to stimulus onset. Red dots, escape onset. (I) Mean calcium activity of vLGN axons in the mSC during threat-evoked (green) and spontaneous (purple) escapes aligned to escape onset. Shading shows SEM across mice; n = 9 mice. (J) Mean calcium activity of vLGN axons recorded in the mSC in escape trials early in the recording session, before the start of the habituation protocol (green, n = 9 mice), and during non-escape trials in habituated animals (orange, n = 7 mice), aligned to stimulus onset. Shading shows SEM across mice. (K) Median calcium activity of vLGN axons in mice approaching the threat zone before presentation of the first looming stimulus (black, naive, n = 9 mice), after presentation of the first looming stimulus (green, experienced, n = 9 mice), and after habituation (orange, n = 7 mice). Pale dots represent data from single animals. Error bars represent the IQR across mice. Naive-experienced: p = 0.0130, experienced-habituated: p = 8.31 × 10−3, naive-habituated: p = 0.983, Dunn’s multiple comparison test, preceded by Kruskal-Wallis one-way analysis of variance, p = 2.96 × 10−3. (L) Mean calcium activity of vLGN axons binned by distance during the 30 s before reaching the threat zone in naive mice (black, n = 9 mice), after presentation of the first looming stimulus (green, experienced, n = 9 mice), and after habituation (orange, n = 7 mice). Shading shows SEM across mice. Dashed line and gray shading indicate the location of the shelter.
Figure 2
Figure 2
vLGN suppression increases risk-avoidance behavior (A) Experimental approach: open field test after expression of hM4Di in GABAergic vLGN neurons. (B) Mean relative time spent in the center during 5 min in the open field arena in systemic CNO- (blue, n = 6 mice) and saline-injected (black, n = 9 mice) animals. p = 6.75 × 10−3, independent two-sample t test. (C) Schematic of the elevated plus maze. (D) Mean entries into open arms as a percentage of total arm entries during 15 min on the maze in systemic CNO- (blue, n = 9 mice) and saline-injected (black, n = 9 mice) animals. p = 6.29 × 10−3, independent two-sample t test. (E) Mean relative time spent in open arms during 15 min on the elevated plus maze. p = 3.71 × 10−3, independent two-sample t test. In all plots, pale dots represent data from single animals. Error bars represent SEM across mice.
Figure 3
Figure 3
vLGN bidirectionally controls escape from imminent visual threat (A) Experimental schematic. (B) Experimental approach: bilateral expression of hM4Di in vLGN of VGAT-Cre mice for inhibition of GABAergic vLGN neurons. (C) Mean escape probability in response to looming stimuli of different contrasts for systemic CNO- (blue, n = 6 mice) and saline-injected (black, n = 12 mice) animals. Pale dots represent data from single animals here and in all following plots. (D) Median relative time spent in the shelter after exposure to the first looming stimulus for CNO- (blue, n = 6 mice) and saline-injected (black, n = 12 mice) animals. Error bars represent IQR across mice. p = 3.23 × 10−3, Wilcoxon rank-sum test. (E) Median spontaneous escape probability after exposure to the first looming stimulus for CNO- (blue, n = 6 mice) or saline-injected (black, n = 12 mice) animals. Error bars represent IQR across mice. p = 0.0102, Wilcoxon rank-sum test. (F) Schematic of the experimental approach: bilateral optogenetic inhibition of GABAergic vLGN neurons during looming stimulus presentation after expression of stGtACR2. (G) Single trials of low-contrast (30%–40%) looming stimulus presentation in control trials (left, no laser) and with optogenetic inhibition of vLGN (right, laser), showing the mice's distance from the shelter (shelter position, −10 to 0 cm) over time, aligned to stimulus onset (white dashed line) in two example mice. Gray and blue lines on top indicate timing and duration of looming stimuli and laser stimulation, respectively. Trials are in chronological order. (H) Median escape probability in response to low-contrast looming stimuli in control trials (black) and bilateral vLGN inhibition trials (blue); n = 10 mice. Error bars represent IQR across mice. p = 1.95 × 10−3, Wilcoxon signed-rank test. (I) Mean escape probability as a function of looming-stimulus contrast in control trials (black) and bilateral vLGN inhibition trials (blue); n = 10 mice. Shading shows 95% confidence interval of the logistic regression of escape probability across mice. (J) Schematic of the experimental approach: bilateral optogenetic stimulation of GABAergic vLGN neurons during looming-stimulus presentation after expression of ChR2. (K) Similar to (G), but showing behavior during single trials of high-contrast looming stimulus (99%) presentation in control trials (left) and in trials with optogenetic ChR2 stimulation (right). (L) Median escape probability in response to high-contrast looming stimuli in control trials (black) and bilateral vLGN stimulation trials (red); n = 8 mice. Error bars represent IQR across mice. p = 7.81 × 10−3, Wilcoxon signed-rank test. (M) Median freezing probability in response to high-contrast looming stimuli in no-laser control trials (black) and bilateral-laser stimulation trials (red). N = 8 animals. (N) Mean escape probability in response to high-contrast looming stimuli (99%) in trials in which vLGN stimulation was initiated after stimulus onset, before the mouse turned toward the shelter (left), and after the mouse turned toward the shelter (right); n = 5 mice. Error bars represent SEM across mice. p = 2.12 × 10−3, dependent t test for paired samples.
Figure 4
Figure 4
Activating vLGN reduces activity in mSC (A) Schematic of the experimental setup for Neuropixels (NPXs) recordings in the mSC during optogenetic stimulation of ChR2-expressing GABAergic vLGN neurons in awake, head-fixed mice. (B) Mean spike rates of an example single unit in the mSC in response to three consecutive looming stimuli of different contrasts (gray bars) during vLGN stimulation (red) and in control trials (black). Background shading shows the laser stimulation period. Shading shows the 95% confidence interval of the mean across trials. (C) Mean spike rate of the single unit shown in (B) during a 3-s window from stimulus onset in control (black) and laser trials (red), normalized to the mean response to 99%-contrast looming stimuli in control trials. Shading shows the 95% confidence interval of the mean across trials. The dashed line represents the normalized mean pre-stimulus spike rate of the single unit. (D) Mean population spike rate of all recorded units in the mSC during looming stimuli of different contrasts in control (black) and laser trials (red), normalized to the response to 99%-contrast looming stimuli; n = 6 mice. Pale dots represent data from single animals. Shading shows SEM across mice. Dashed line represents the normalized mean pre-stimulus activity. (E) Mean suppressive effect of vLGN stimulation on the population spike rate of all recorded units in the mSC during a 99%-contrast looming stimulus, n = 6 mice. Error bars represent SEM across mice. Pale dots represent data from single animals; p = 1.70 × 10−3, one-sample t test. (F) Mean suppressive effect of vLGN stimulation on the population-spike rate of recorded units in superficial (Superf., yellow), intermediate (Interm., orange), or deep (Deep, red) layers in the mSC during 99%-contrast looming stimulus presentation. Superficial-intermediate, p = 0.0126; intermediate-deep, p = 0.257; superficial-deep, p = 0.191. Tukey’s honest significance test preceded by repeated-measures, one-way analysis of variance, p = 0.0161). (G) Median suppressive effect of vLGN stimulation during spontaneous activity on single units responding to either looming or grating stimuli (visual, red, n = 84 units), and on single units not responding to any visual stimulus (non-visual, orange, n = 34 units) in intermediate and deep layers of the mSC. Pale dots represent data from single units. Error bars represent IQR across single units. Single units from 11 recordings in six animals. p = 0.0121, Wilcoxon rank-sum test. (H) Median suppressive effect of vLGN stimulation during spontaneous activity on single units responding to either looming or grating stimuli, but not to sounds (visual-only, dark red, n = 62 units) and on single units not responding to any visual stimulus, but showing a significant response to sounds (sound-only, dark orange, n = 14 single units) in intermediate and deep layers of the mSC. Single units from 11 recordings in six animals. p = 0.0240, Wilcoxon rank-sum test.
Figure 5
Figure 5
Activating vLGN axons in the mSC suppresses escape from visual threat (A) Schematic of the experimental approach: optogenetic stimulation of ChR2-expressing GABAergic vLGN axons in the mSC during looming stimulus presentation. (B) Mean escape probability in response to intermediate-contrast (50%–60%) looming stimuli in control trials (black) and trials with laser stimulation of vLGN axons in the mSC (red); n = 8 mice. Error bars represent SEM across mice. p = 9.60 × 10−4, dependent t test for paired samples. (C) Mean escape probability as a function of looming stimulus contrast in control trials (black) and trials with laser stimulation of vLGN axons in the mSC (red); n = 8 mice. Error bars represent the 95% confidence interval of the logistic regression of escape probability across mice. (D) Schematic of the experimental approach. Mice were presented with high-frequency sounds in the threat zone instead of looming stimuli. (E) Mean escape probability in response to high-frequency sounds in control trials (black) and in trials with laser stimulation of vLGN axons in mSC (red); n = 7 mice. Error bars represent SEM across mice. p = 0.223, dependent t test for paired samples. (F) Mean peak running speed during escape in control escape trials (black) and escape trials during stimulation of vLGN axons in mSC (red) in response to looming stimuli (left, n = 8 mice, p = 4.28 × 10−6, dependent t test for paired samples) and in response to high-frequency sounds (right, n = 7 mice, p = 6.88 × 10-4). In all plots, pale dots represent data from single animals.

Comment in

References

    1. Ahmadlou M., Houba J.H.W., van Vierbergen J.F.M., Giannouli M., Gimenez G.-A., van Weeghel C., Darbanfouladi M., Shirazi M.Y., Dziubek J., Kacem M., de Winter F., Heimel J.A. A cell type–specific cortico-subcortical brain circuit for investigatory and novelty-seeking behavior. Science. 2021;372:eabe9681. doi: 10.1126/science.abe9681. - DOI - PubMed
    1. Akam T., Walton M.E. pyPhotometry: open source Python based hardware and software for fiber photometry data acquisition. Sci. Rep. 2019;9:3521. - PMC - PubMed
    1. Alford S., Schwartz E. In: Squire L.R., editor. Academic Press; 2009. Presynaptic inhibition; pp. 1001–1006. (Encyclopedia of Neuroscience).
    1. Armbruster B.N., Li X., Pausch M.H., Herlitze S., Roth B.L. Evolving the lock to fit the key to create a family of G protein-coupled receptors potently activated by an inert ligand. PNAS. 2007;104:5163–5168. - PMC - PubMed
    1. Biagioni A.F., de Freitas R.L., da Silva J.A., de Oliveira R.C., de Oliveira R., Alves V.M., Coimbra N.C. Serotonergic neural links from the dorsal raphe nucleus modulate defensive behaviours organised by the dorsomedial hypothalamus and the elaboration of fear-induced antinociception via locus coeruleus pathways. Neuropharmacology. 2013;67:379–394. - PubMed

Publication types

LinkOut - more resources