. 2022 Feb;12(2):502-521.
doi: 10.1158/2159-8290.CD-20-1848. Epub 2021 Oct 6.

Transcription Elongation Machinery Is a Druggable Dependency and Potentiates Immunotherapy in Glioblastoma Stem Cells

Affiliations

Transcription Elongation Machinery Is a Druggable Dependency and Potentiates Immunotherapy in Glioblastoma Stem Cells

Zhixin Qiu et al. Cancer Discov. 2022 Feb.

Abstract

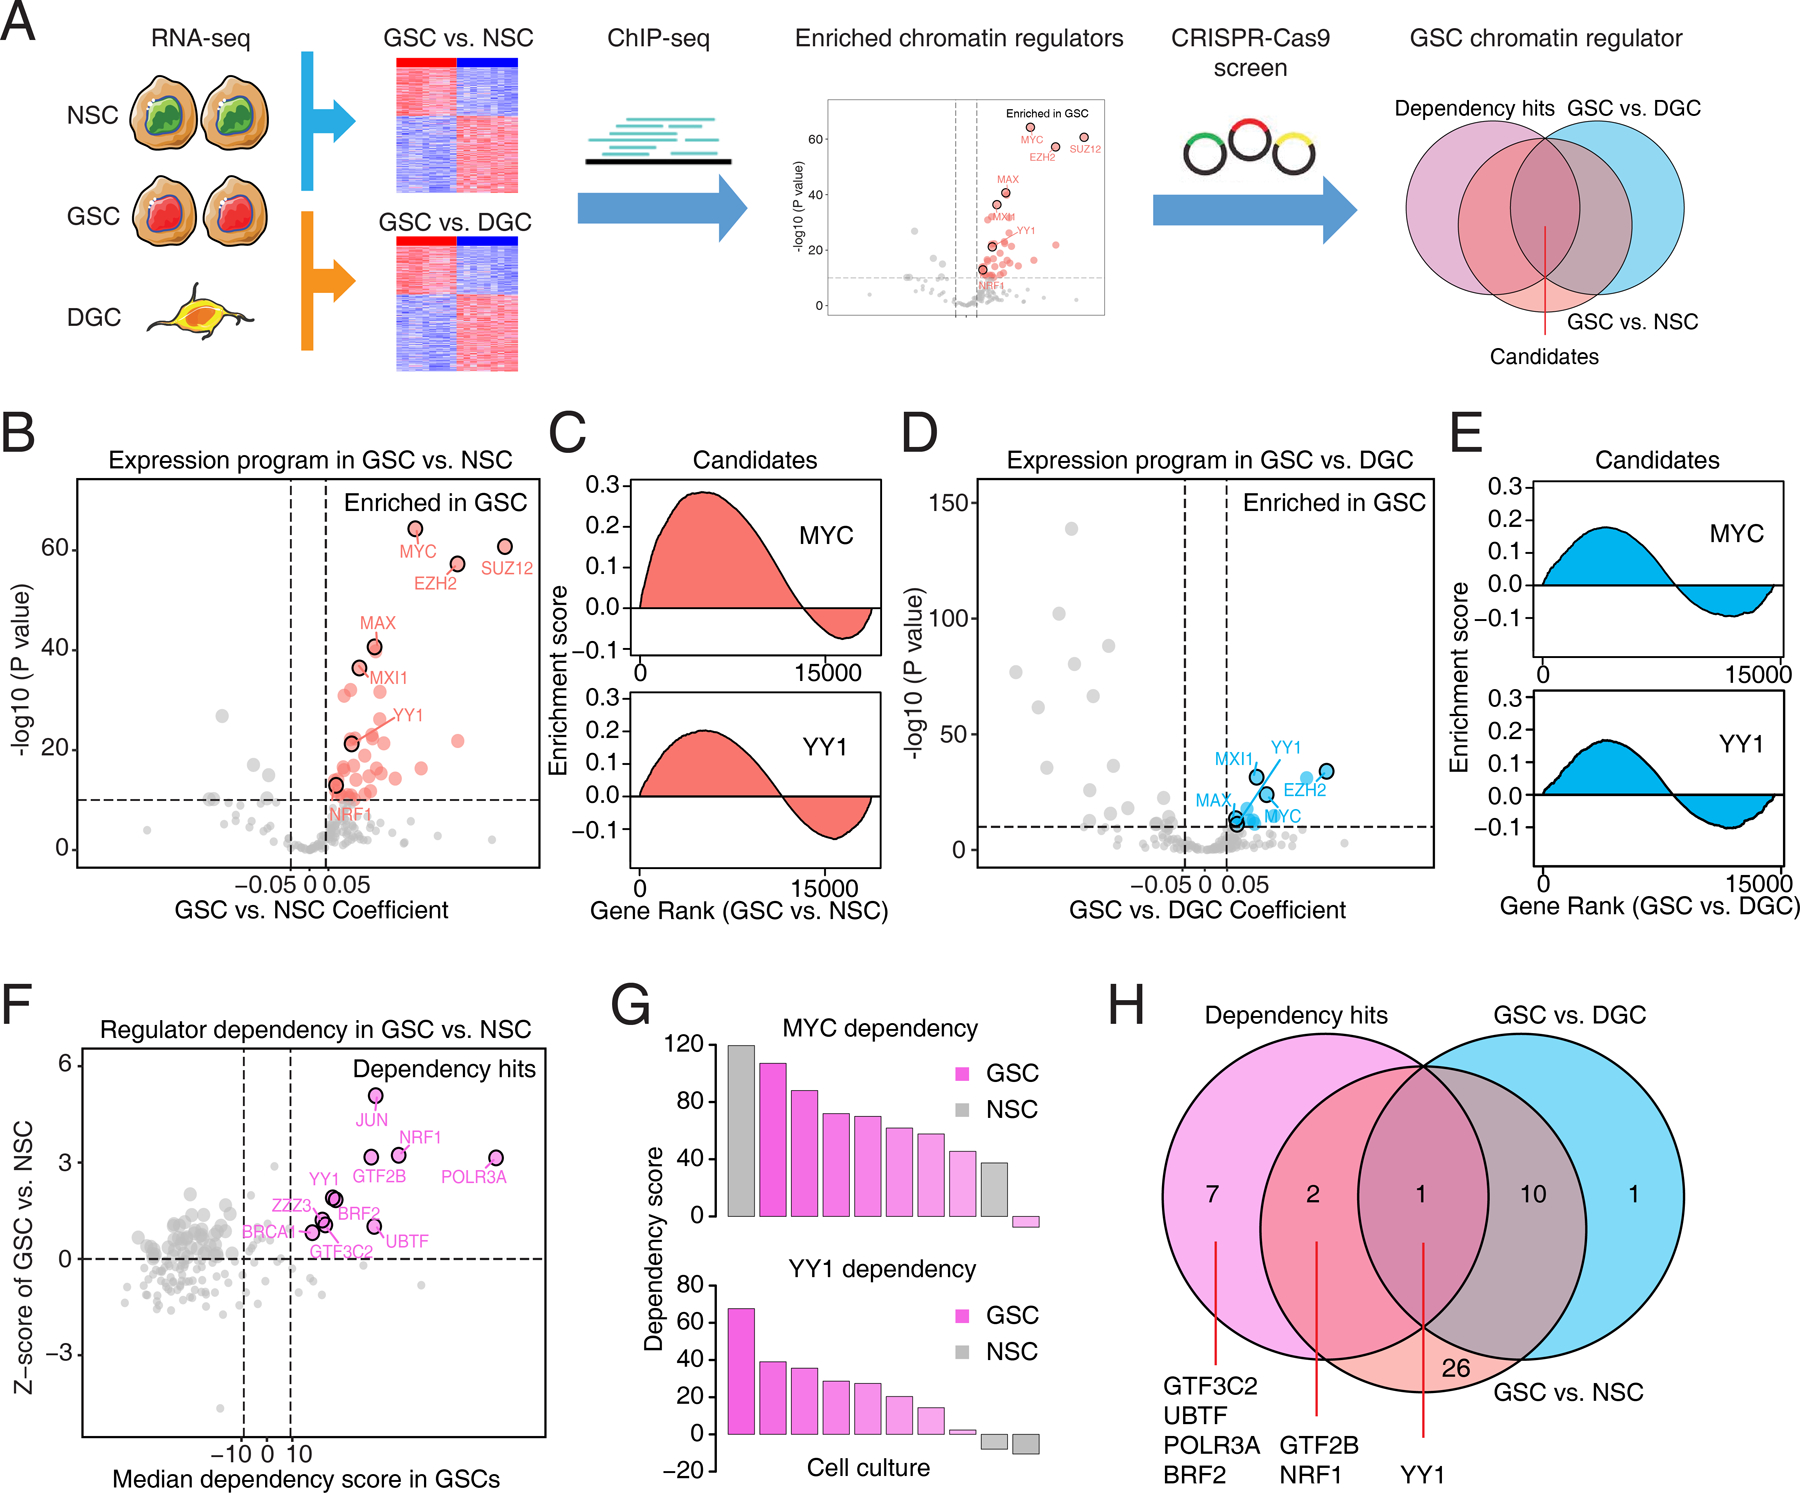
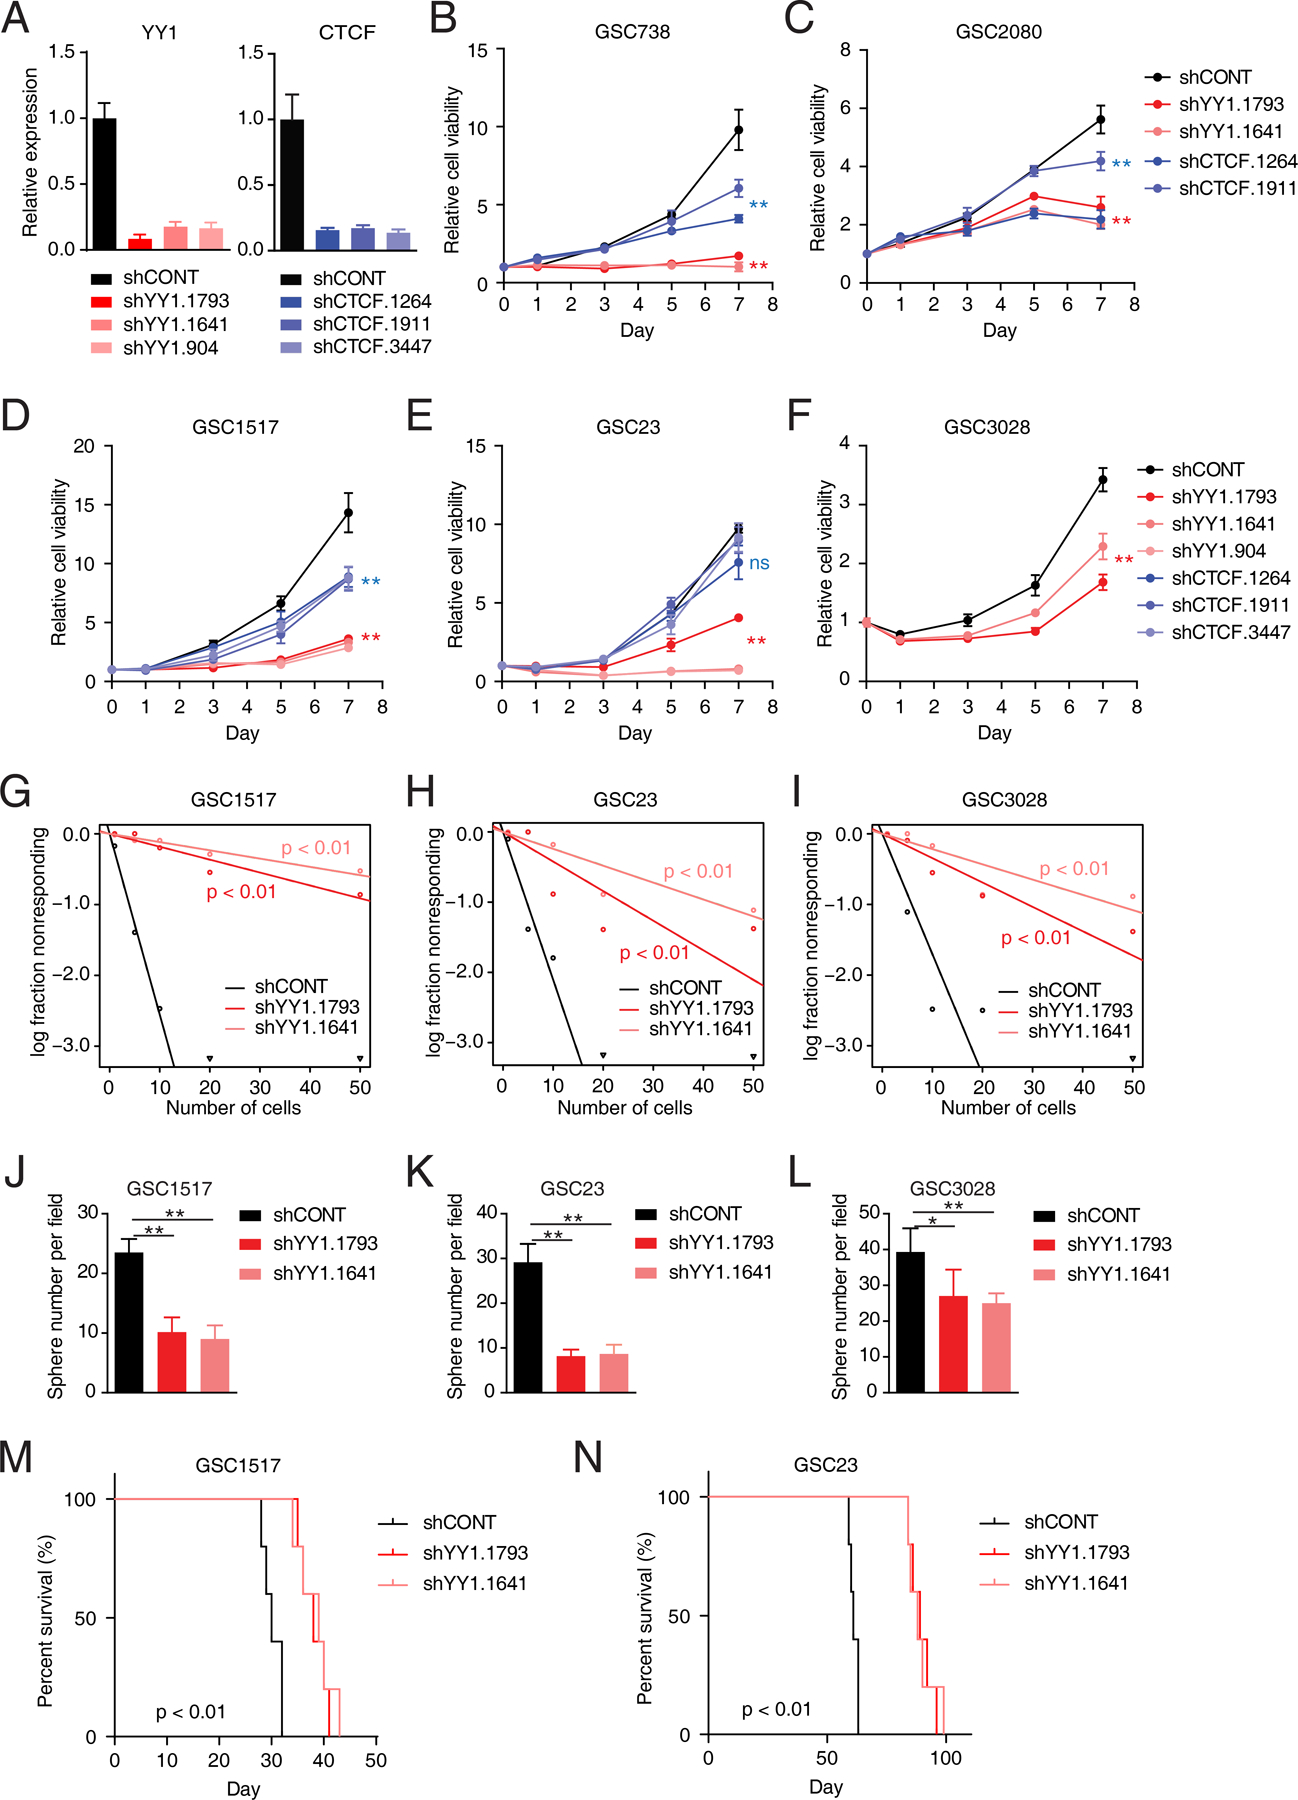
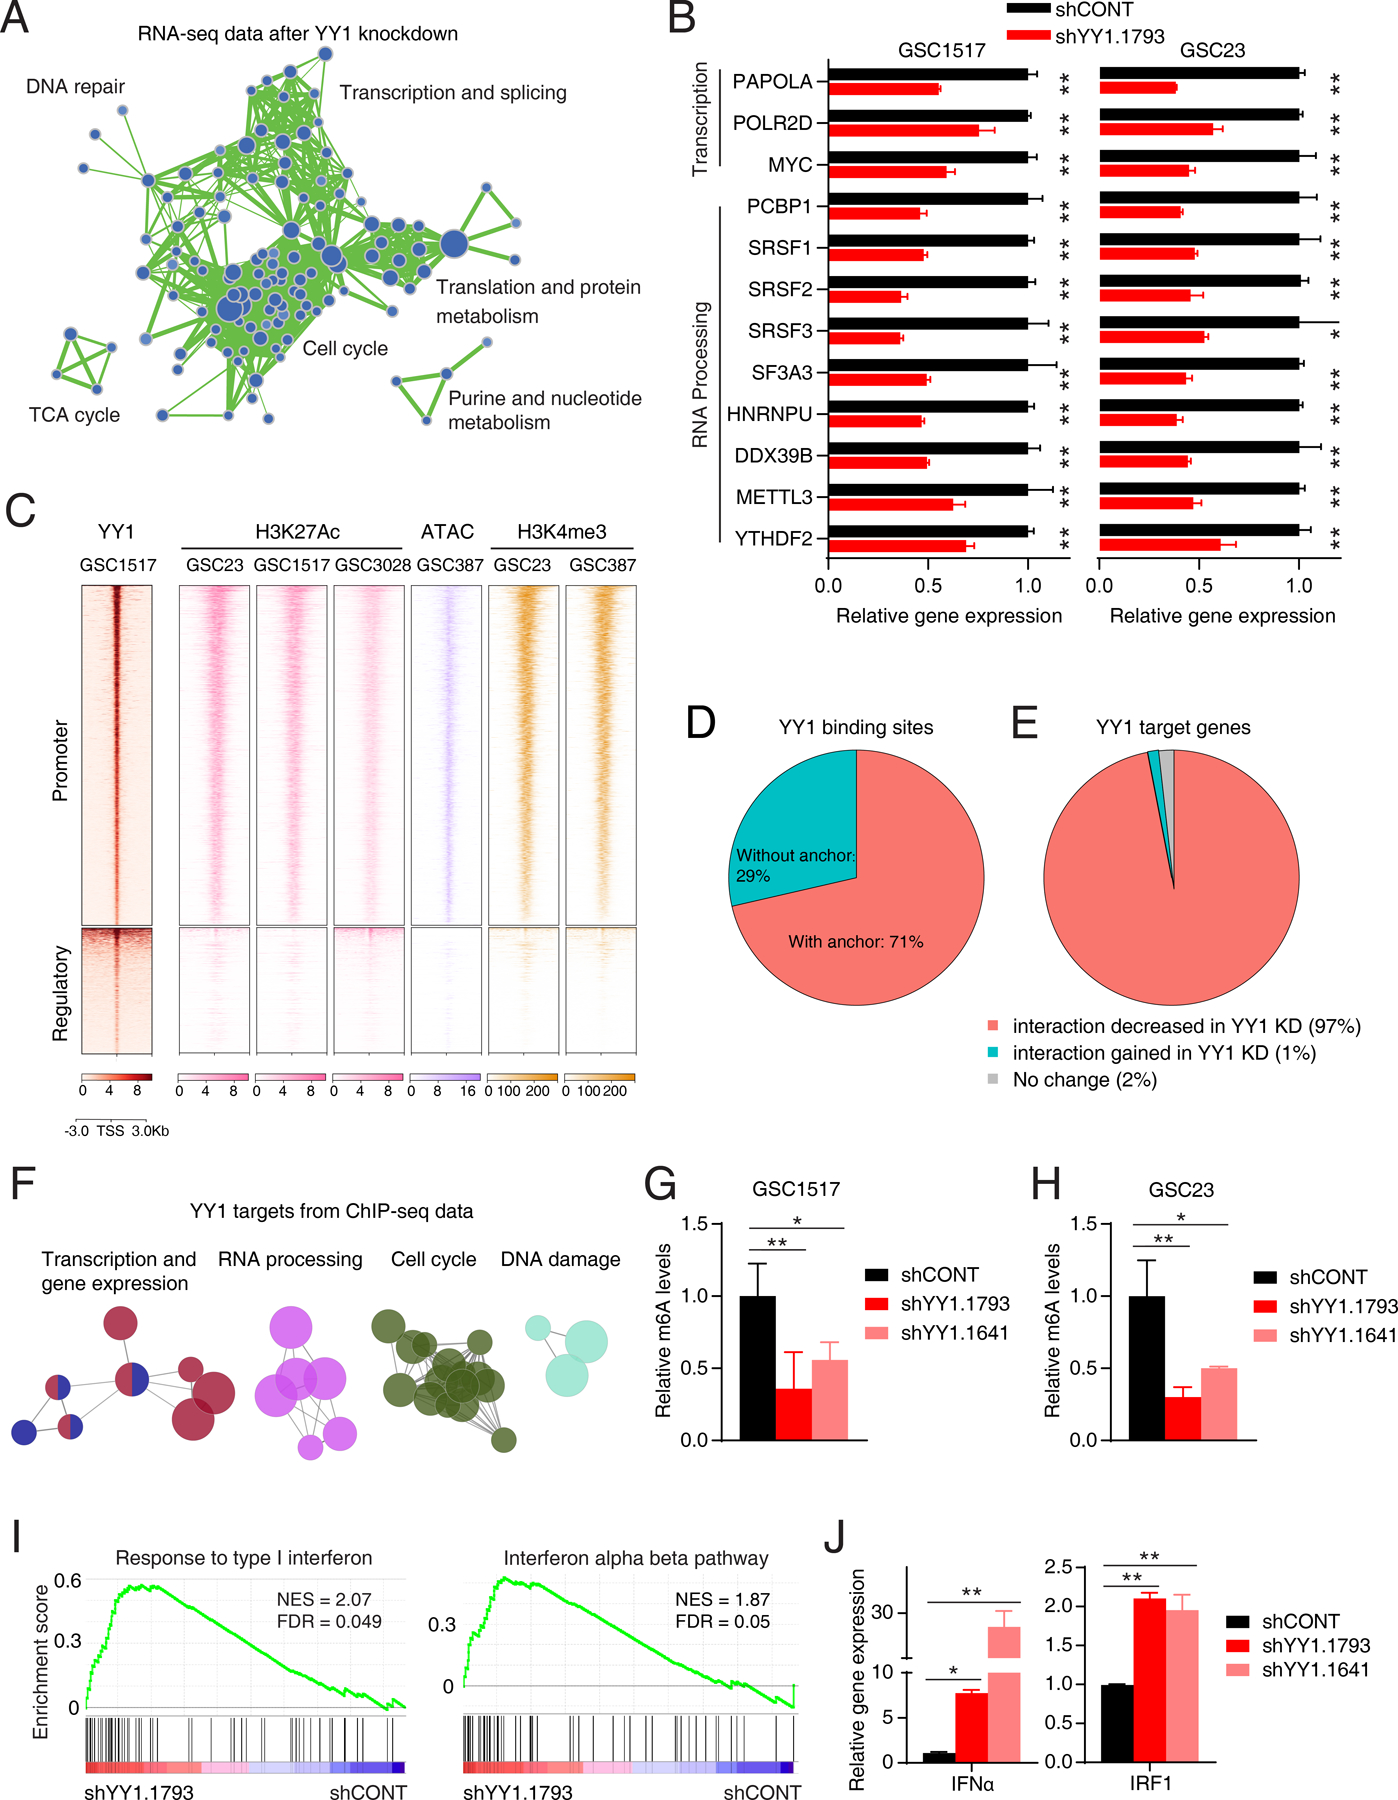
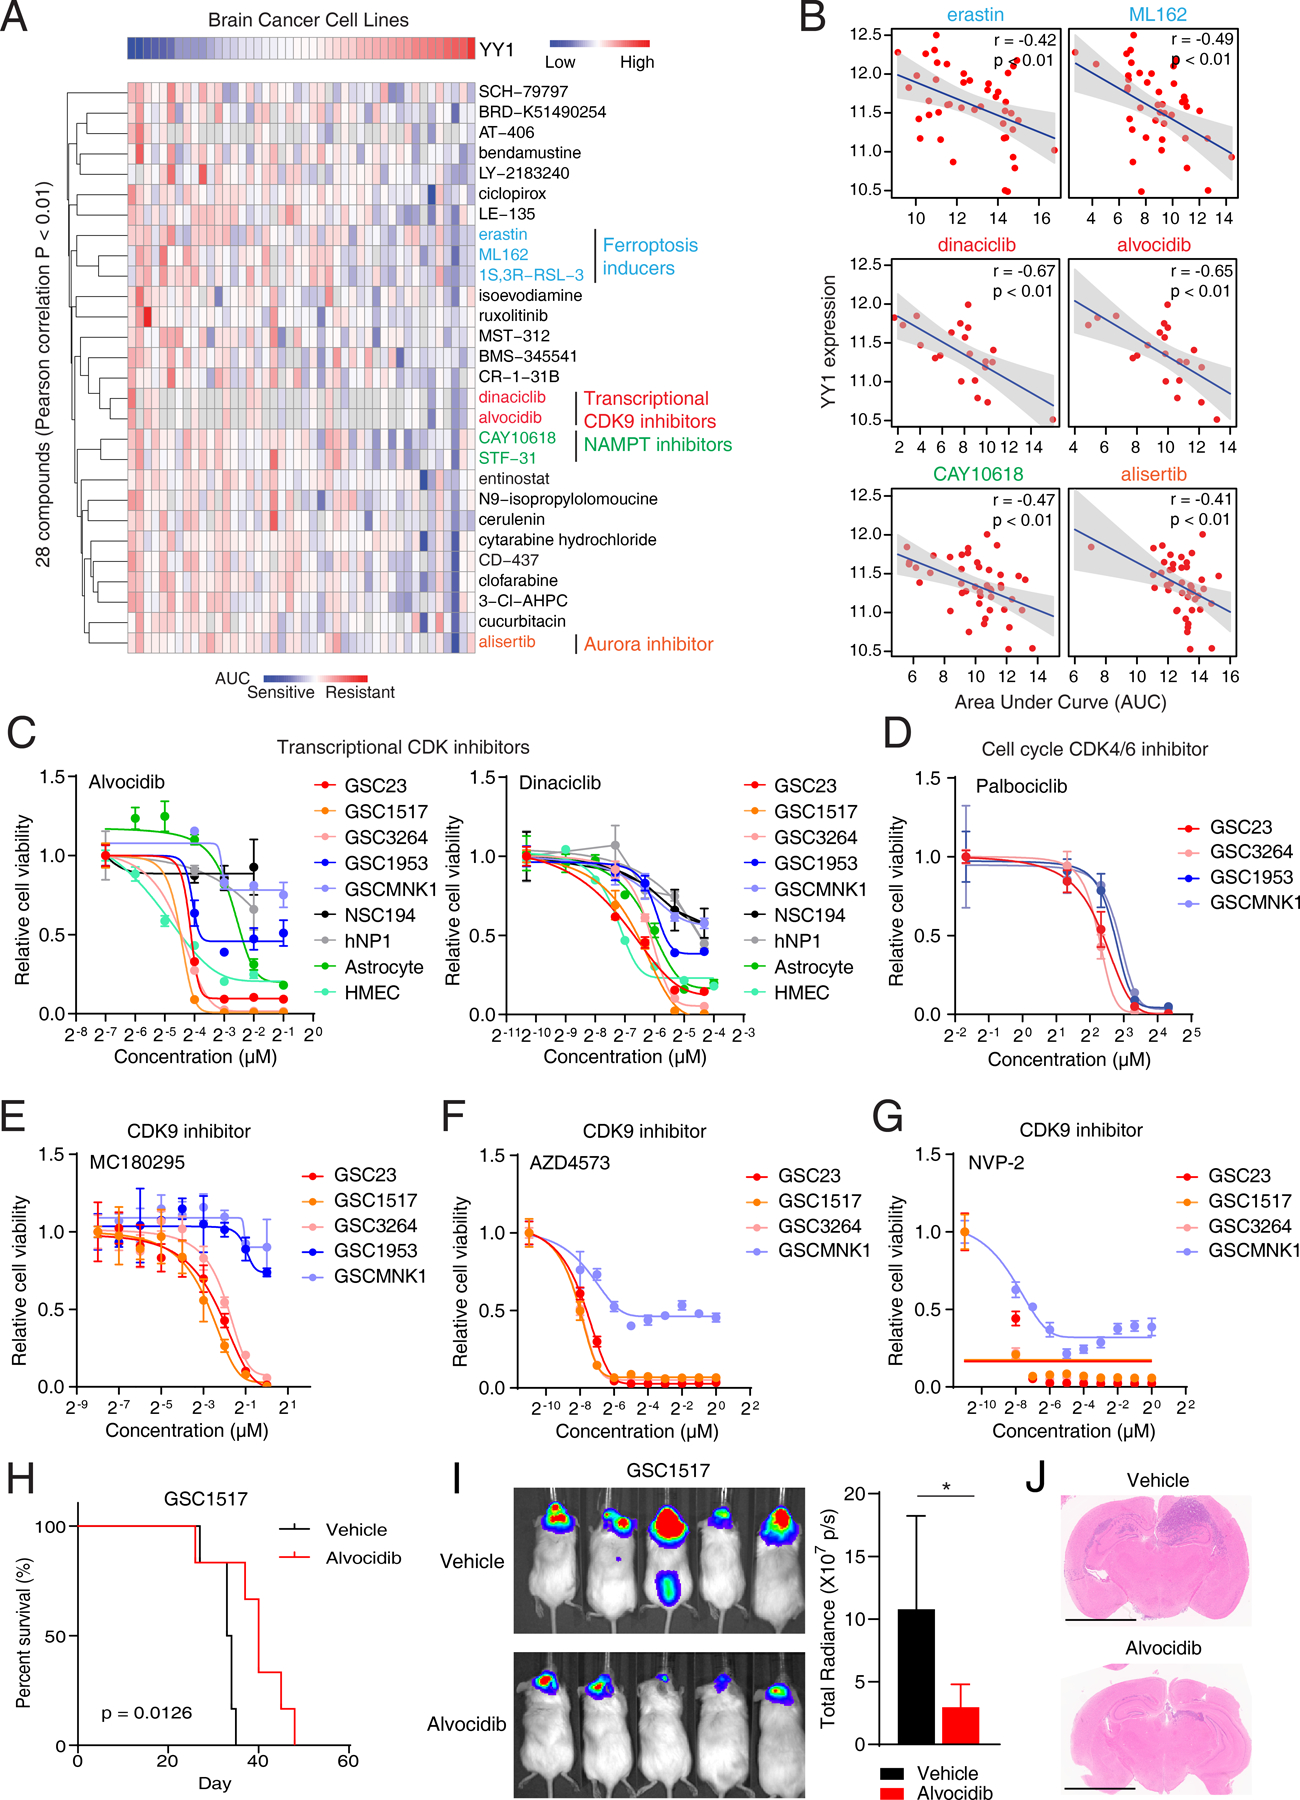
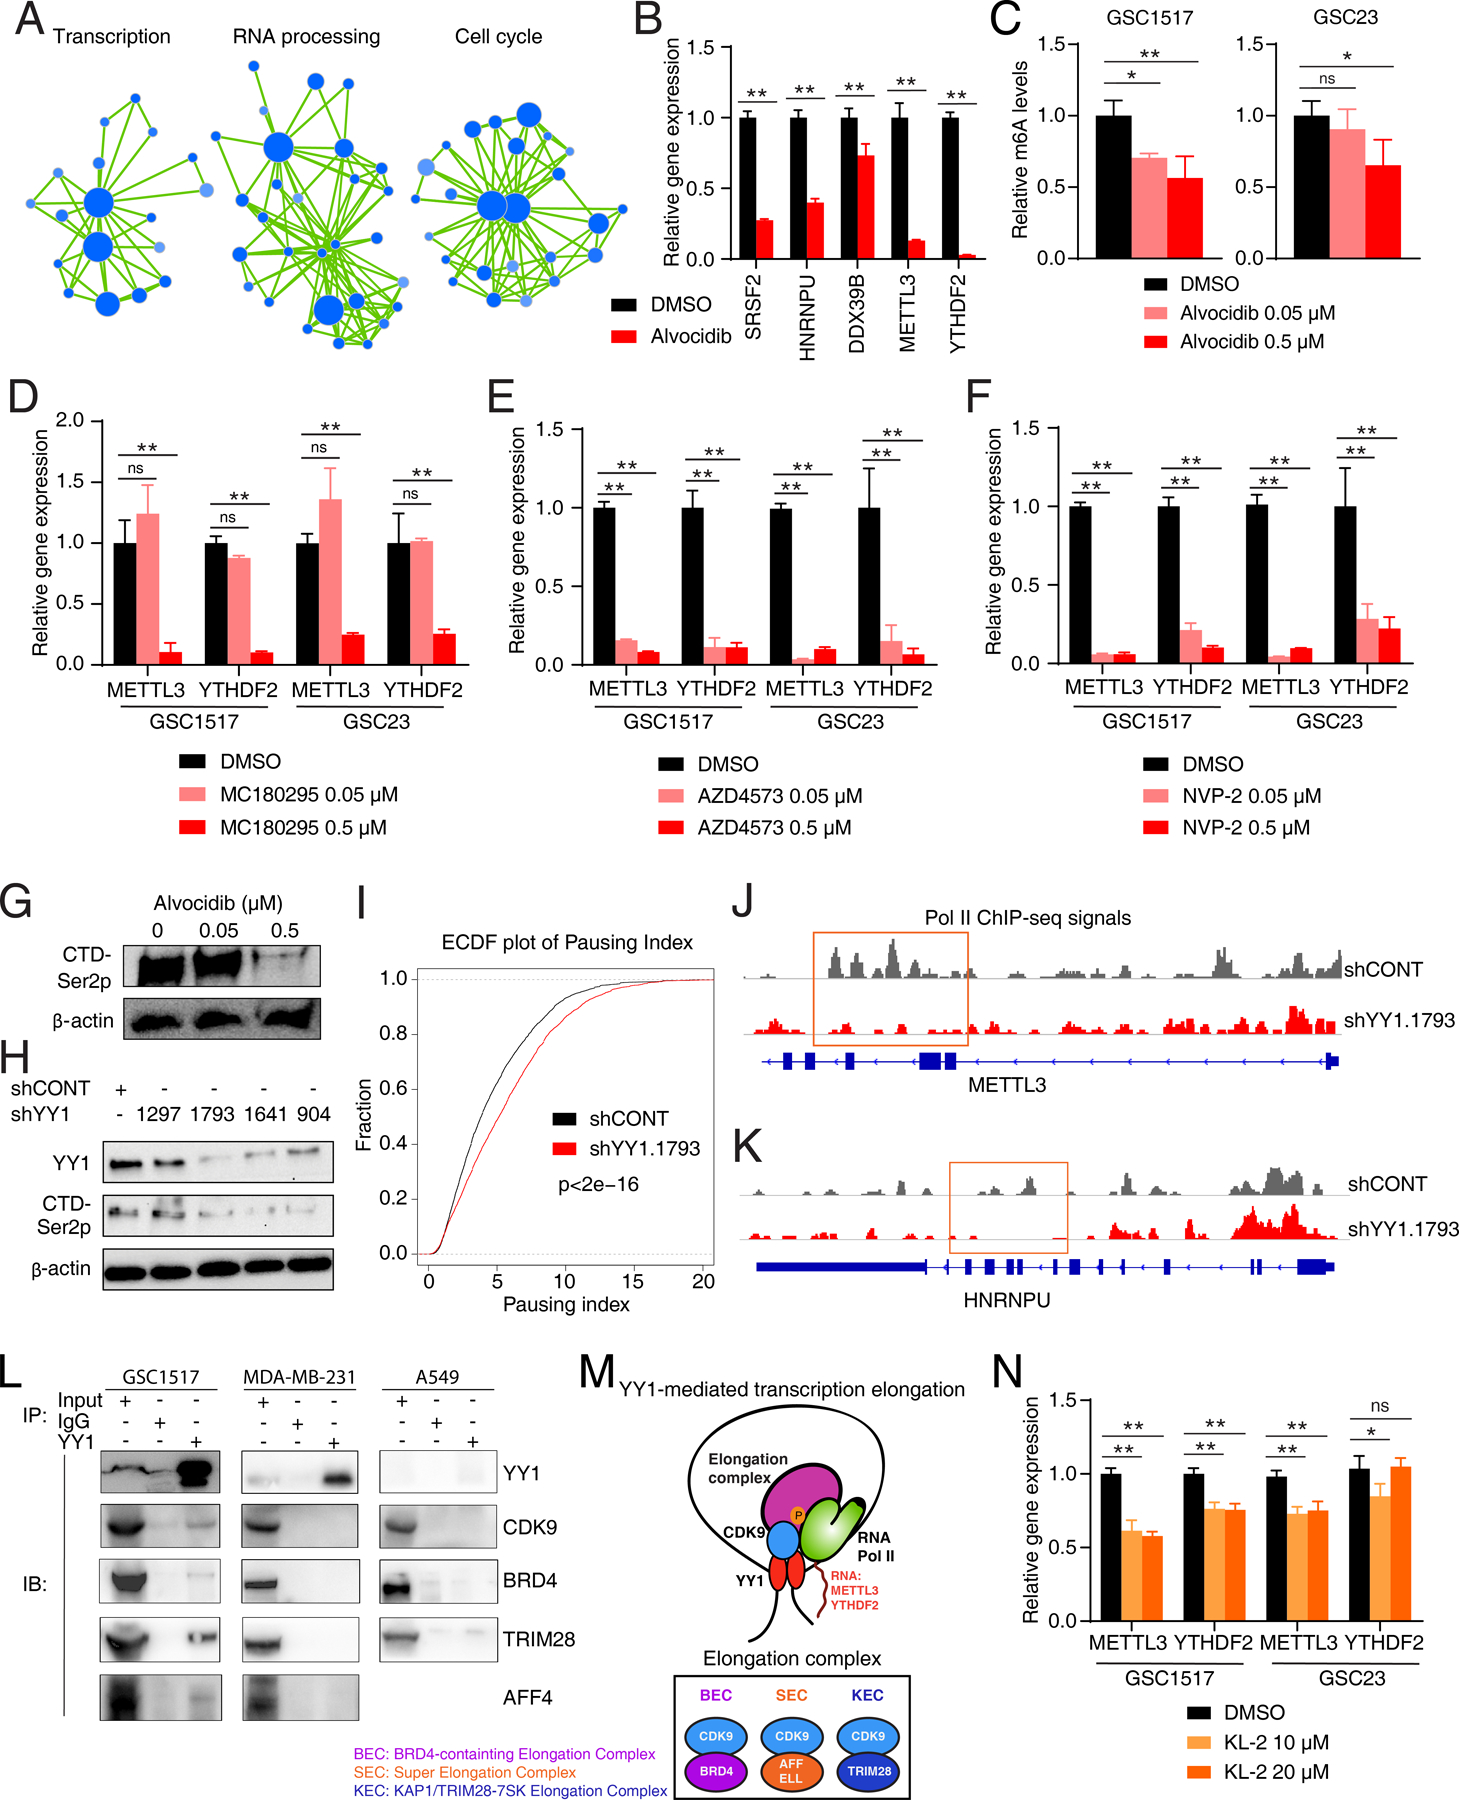
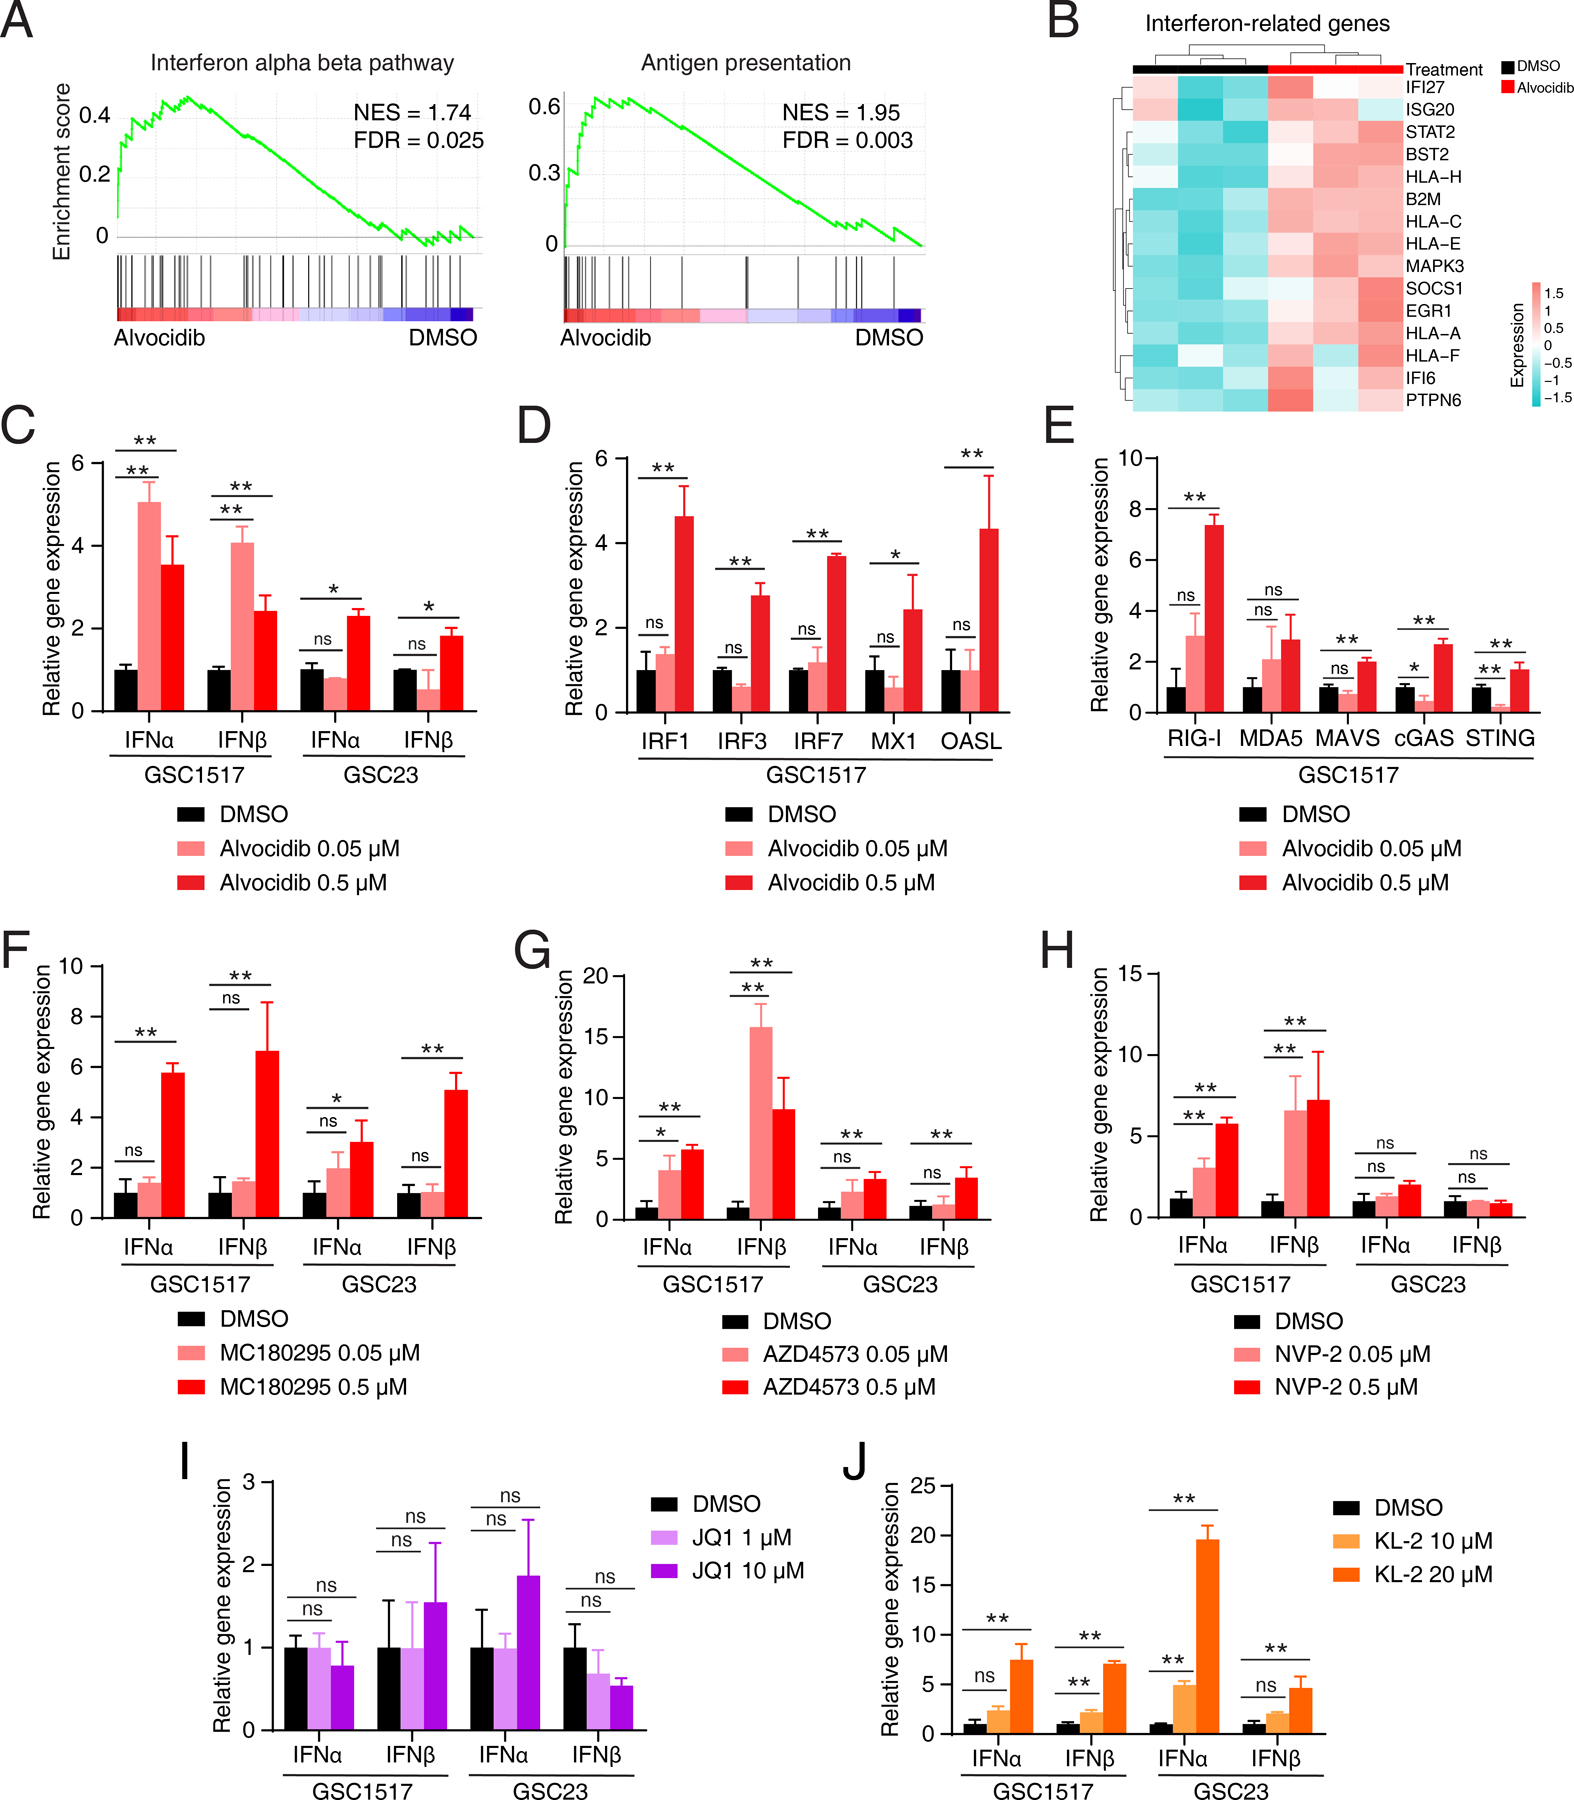
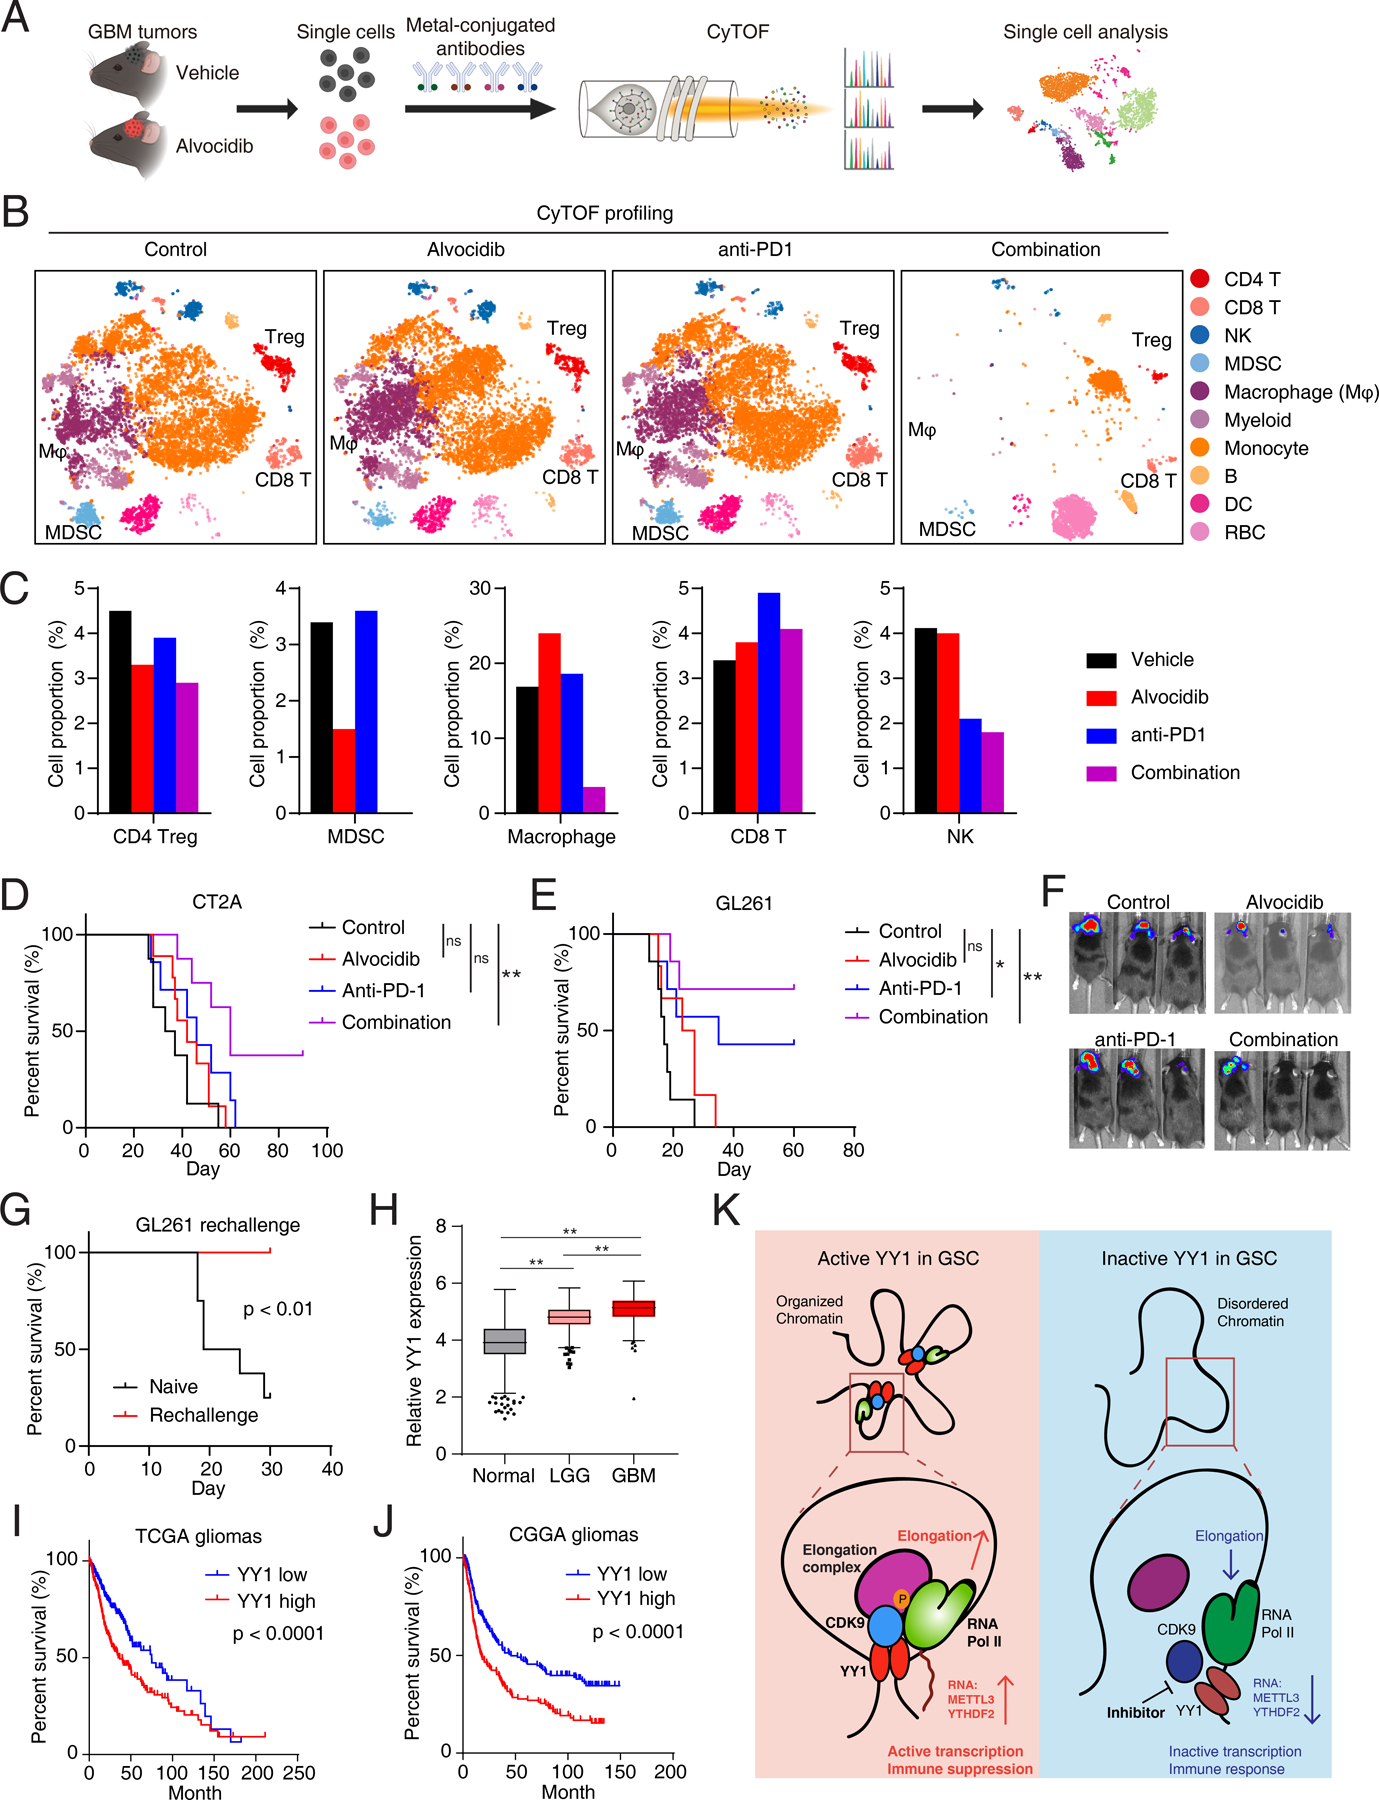
Glioblastoma (GBM) is the most lethal primary brain cancer characterized by therapeutic resistance, which is promoted by GBM stem cells (GSC). Here, we interrogated gene expression and whole-genome CRISPR/Cas9 screening in a large panel of patient-derived GSCs, differentiated GBM cells (DGC), and neural stem cells (NSC) to identify master regulators of GSC stemness, revealing an essential transcription state with increased RNA polymerase II-mediated transcription. The YY1 and transcriptional CDK9 complex was essential for GSC survival and maintenance in vitro and in vivo. YY1 interacted with CDK9 to regulate transcription elongation in GSCs. Genetic or pharmacologic targeting of the YY1-CDK9 complex elicited RNA m6A modification-dependent interferon responses, reduced regulatory T-cell infiltration, and augmented efficacy of immune checkpoint therapy in GBM. Collectively, these results suggest that YY1-CDK9 transcription elongation complex defines a targetable cell state with active transcription, suppressed interferon responses, and immunotherapy resistance in GBM. SIGNIFICANCE: Effective strategies to rewire immunosuppressive microenvironment and enhance immunotherapy response are still lacking in GBM. YY1-driven transcriptional elongation machinery represents a druggable target to activate interferon response and enhance anti-PD-1 response through regulating the m6A modification program, linking epigenetic regulation to immunomodulatory function in GBM.This article is highlighted in the In This Issue feature, p. 275.


Figures

Figure 1.
Figure 1.. Chromatin regulator landscapes identify transcriptional dependencies in glioblastoma stem cells.
A, Diagram depicting the screening strategy to identify the enriched chromatin regulators with selective dependency in glioblastoma stem cells (GSCs). NSC, neural stem cell. DGC, differentiated glioblastoma cell. B, Volcano plot showing enrichment of 160 transcription regulator programs in 38 GSCs and 5 NSCs (GSE119834). Genes with its target program highly expressed in GSCs were labeled as red. C, Enrichment map visualization of candidate regulator programs (MYC and YY1) in GSCs compared to NSCs. D, Volcano plot showing enrichment of 160 transcription regulator programs in three pairs of GSCs and DGCs (GSE54791). Genes with its target program highly expressed in GSCs were labeled as blue. E, Enrichment map visualization of candidate regulator programs (MYC and YY1) in GSCs compared to DGCs. F, Scatter plot showing relative dependencies of 160 transcription regulators in 8 GSCs and 2 NSCs from whole genome CRISPR/Cas9 loss-of-function screening. Dependency genes specifically for GSCs were labeled as pink. G, Bar plots showing dependency scores of MYC and YY1 from whole genome CRISPR/Cas9 loss-of-function screening in a panel of GSCs (pink) and NSCs (gray). H, Venn diagram plot showing overlapping of transcription program and dependency hits for 160 regulators in GSCs.
Figure 2.
Figure 2.. YY1 is essential for glioblastoma stem cells both in vitro and in vivo.
A, Bar plots showing YY1 and CTCF expression levels in GSC1517 with shRNA-mediated knockdown of YY1 or CTCF, respectively, as determined by qRT-PCR. Data are presented as mean + SD. B-F, Relative cell viabilities of a panel of GSCs with shRNA-mediated knockdown of YY1 or CTCF at different time points. Data are presented as mean ± SD. G-I, Tumor sphere formation efficiency and self-renewal capacity were measured by extreme in vitro limiting dilution assays (ELDA) in three GSCs. P-values were determined by likelihood ratio test. J-L, Bar plots showing the number of spheres from different GSCs after YY1 knockdown at day 7. Data are presented as mean + SD. M and N, Kaplan-Meier curves showing survival of immunocompromised mice bearing intracranial tumors from GSC1517 (M) and GSC23 (N) following transduction with indicated shRNAs. P-values were determined by log-rank test. *p < 0.05, **p < 0.01 by one-way ANOVA with Dunnett multiple comparison test; ns, not significant.
Figure 3.
Figure 3.. YY1 regulates transcription and RNA m6A methylation programs and suppresses interferon signaling.
A, Enrichment map visualization of downregulated gene sets in GSEA after YY1 knockdown. B, Bar plots showing selected down-regulated genes involved in RNA Pol II transcription and RNA processing after YY1 knockdown. Data are presented as mean + SD. *p < 0.05, **p < 0.01 by unpaired Student’s t-test. C, Heatmaps showing ChIP-seq signals of YY1, H3K27Ac, H3K4me3 and ATAC-Seq signals in GSCs. The signals are displayed within a region spanning ±3 kb around center of YY1 binding peaks. D, Pie plot showing the overlapping between YY1 binding sites and chromatin interaction anchors inferred by BL-Hi-C sequencing in GSC cells. E, Pie plots showing the percentage of YY1 target genes with decreased chromatin interactions after YY1 knockdown. F, ClueGO plot of canonical pathways enriched in the YY1 putative target genes inferred from ChIP-seq profiling in GSC1517. G and H, Bar plots showing relative m6A levels after YY1 knockdown in GSC1517 (G) and GSC23 (H). Data are presented as mean + SD. *p < 0.05, **p < 0.01 by one-way ANOVA with Dunnett multiple comparison test. I, GSEA plots of representative gene sets involved in immune response after YY1 knockdown. The normalized enrichment score (NES) and false discovery rate (FDR) were indicated. J, Bar plots showing expression levels of IFNα and IRF1 in GSC1517 after YY1 knockdown determined by qRT-PCR. Data are presented as mean + SD. *p < 0.05, **p < 0.01 by one-way ANOVA with Dunnett multiple comparison test.
Figure 4.
Figure 4.. A pharmacogenomic analysis identifies YY1-associated therapeutic response in brain cancers.
A, Hierarchical clustering of drug AUC values from brain cancer cell lines. YY1 expression levels were shown on the top of the heatmap. Only drugs with Pearson correlation p-value < 0.01 were included. A low AUC value (blue) indicates sensitivity to drug treatment. B, Scatter plots showing correlation between YY1 expression levels and drug AUC values in brain cancer cell lines. Pearson correlation coefficients and p values were shown. C, Dose-response curves of transcriptional CDK inhibitors, alvocidib and dinaciclib, in YY1-dependent GSCs (GSC23, GSC1517 and GSC3264), YY1-independent GSCs (GSC1953 and MNK1) and non-malignant cells (astrocyte and HMEC). HMEC, Human Mammary Epithelial Cells. Data are presented as mean ± SD. D, Dose-response curves of cell cycle-related CDK4/6 inhibitor in 4 GSCs. Data are presented as mean ± SD. E-G, Dose-response curves of selective CDK9 inhibitors in GSCs. Data are presented as mean ± SD. H, Kaplan-Meier curves showing survival of immunocompromised mice bearing intracranial tumors from GSC1517 with vehicle or alvocidib (10 mg/kg) treatment. P-values were determined by log-rank test. I and J, In vivo bioluminescent imaging (I) and H&E-stained coronal sections (J) of immunocompromised mice bearing intracranial tumors with vehicle or alvocidib treatment. Scale bars, 2 mm. Data are presented as mean + SD. *p < 0.05 by unpaired Student’s t-test.
Figure 5.
Figure 5.. YY1 is involved in transcription elongation through interacting with CDK9 and other elongation factors.
A, Enrichment map visualization of downregulated genes in GSEA after alvocidib treatment in GSC1517 cells. B, Bar plots showing relative expression levels of RNA processing and m6A genes after alvocidib treatment in GSC1517 determined by qRT-PCR. C, Bar plots showing relative m6A levels after alvocidib treatment in GSC1517 and GSC23. D-F, Bar plots showing relative expression levels of METTL3 and YTHDF2 after treatment of selective CDK9 inhibitors in GSC1517 determined by qRT-PCR. G, Immunoblot showing Ser2 phosphorylation (Ser2p) of RNA Pol II CTD (C-terminal domain) in GSC after alvocidib treatment. Data are representative results of three independent experiments. H, Immunoblot showing YY1 and Ser2 phosphorylation (Ser2p) of RNA Pol II CTD in GSCs after YY1 knockdown. I, Empirical cumulative density function (ECDF) plots of Pol II pausing index after YY1 knockdown in GSCs. J and K, Visualization of Pol II occupancy at representative genomic loci, METTL3 (J) and HNRNPU (K). L, Co-immunoprecipitation (IP) assay followed by immunoblot (IB) showing the interactions between YY1 and CDK9 or other transcription elongation complexes (BRD4, TRIM28, and AFF4). M, A working model for YY1-mediated transcription elongation complex. N, Bar plots showing relative expression levels of METTL3 and YTHDF2 after treatment of SEC inhibitor KL-2 determined by qRT-PCR. Data are presented as mean + SD. *p < 0.05, **p < 0.01 by one-way ANOVA with Dunnett multiple comparison test; ns, not significant.
Figure 6.
Figure 6.. Targeting transcription elongation complexes elicits interferon response in glioblastoma stem cells.
A, GSEA plots of representative gene sets involved in immune response after alvocidib treatment. The normalized enrichment score (NES) and false discovery rate (FDR) were indicated. B, Heatmap showing immune response related differentially expressed genes after alvocidib treatment in GSC1517 cells. C, Bar plots showing expression levels of IFNα and IFNβ in two GSC models (GSC1517 and GSC23) with alvocidib treatment determined by qRT-PCR. D and E, Bar plots showing expression levels of interferon-stimulated genes with alvocidib treatment in GSC1517 determined by qRT-PCR. F-H, Bar plots showing expression levels of IFNα and IFNβ in two GSC models (GSC1517 and GSC23) with selective CDK9 inhibitor treatment determined by qRT-PCR. I and J, Bar plots showing expression levels of IFNα and IFNβ in two GSCs (GSC1517 and GSC23) with BEC inhibitor JQ1 (I) and SEC inhibitor KL-2 (J) treatment determined by qRT-PCR. Data are presented as mean + SD. *p < 0.05, **p < 0.01 by one-way ANOVA with Dunnett multiple comparison test; ns, not significant.
Figure 7.
Figure 7.. Pharmacological Targeting of the YY1-CDK9 complex reprograms microenvironment and enhances anti-PD-1 response in gliomas.
A, The workflow of the cytometry by time of flight (CyTOF) experiment to analyze the microenvironment in GBM models. B, The t-SNE plots of immune cell clusters from GL261 tumors treated with vehicle, alvocidib, anti-PD1 and combination, colored by cell clusters, from CyTOF analysis. C, Proportion of cells from GL261 tumors for the indicated cell types. D and E, Kaplan-Meier curves showing survival of immunocompetent mice bearing intracranial tumors from syngeneic CT2A (D) and GL261 (E) cells with alvocidib and anti-PD-1 treatment. *p < 0.05, **p < 0.01 by log-rank test; ns, not significant. F, In vivo bioluminescent imaging of immunocompetent mice bearing intracranial syngeneic tumors from mouse glioma CT2A cells with alvocidib and anti-PD-1 treatment. G, Kaplan-Meier curves showing survival of immunocompetent mice from Fig. 7D re-challenged with GL261 cells. P value was determined by log-rank test. H, Box-and-whisker plot showing expression pattern of YY1 in normal brains, low grade gliomas and glioblastomas from TCGA and GTEx databases. **p < 0.01 by one-way ANOVA with Dunnett multiple comparison test. I and J, Survival analysis of glioblastoma and low-grade gliomas in TCGA (I) and CGGA (J) databases divided by median value of YY1 expression levels. P value was determined by log-rank test. K, A working model showing the role of YY1-CDK9 complex in transcription elongation regulation and interferon response in GSCs.

References

    1. Ostrom QT, Gittleman H, Fulop J, Liu M, Blanda R, Kromer C, et al. CBTRUS Statistical Report: Primary Brain and Central Nervous System Tumors Diagnosed in the United States in 2008–2012. Neuro-oncology 2015;17 Suppl 4:iv1–iv62 - PMC - PubMed
    1. Ceccarelli M, Barthel FP, Malta TM, Sabedot TS, Salama SR, Murray BA, et al. Molecular Profiling Reveals Biologically Discrete Subsets and Pathways of Progression in Diffuse Glioma. Cell 2016;164(3):550–63 - PMC - PubMed
    1. Wang Q, Hu B, Hu X, Kim H, Squatrito M, Scarpace L, et al. Tumor Evolution of Glioma-Intrinsic Gene Expression Subtypes Associates with Immunological Changes in the Microenvironment. Cancer cell 2018;33(1):152. - PMC - PubMed
    1. Singh SK, Hawkins C, Clarke ID, Squire JA, Bayani J, Hide T, et al. Identification of human brain tumour initiating cells. Nature 2004;432(7015):396–401 - PubMed
    1. Wakimoto H, Kesari S, Farrell CJ, Curry WT Jr., Zaupa C, Aghi M, et al. Human glioblastoma-derived cancer stem cells: establishment of invasive glioma models and treatment with oncolytic herpes simplex virus vectors. Cancer research 2009;69(8):3472–81 - PMC - PubMed

Publication types