. 2021 Oct 6;12(1):5847.
doi: 10.1038/s41467-021-26146-6.

Multi-targeted 1H/19F MRI unmasks specific danger patterns for emerging cardiovascular disorders

Affiliations

Multi-targeted 1H/19F MRI unmasks specific danger patterns for emerging cardiovascular disorders

Ulrich Flögel et al. Nat Commun. .

Abstract

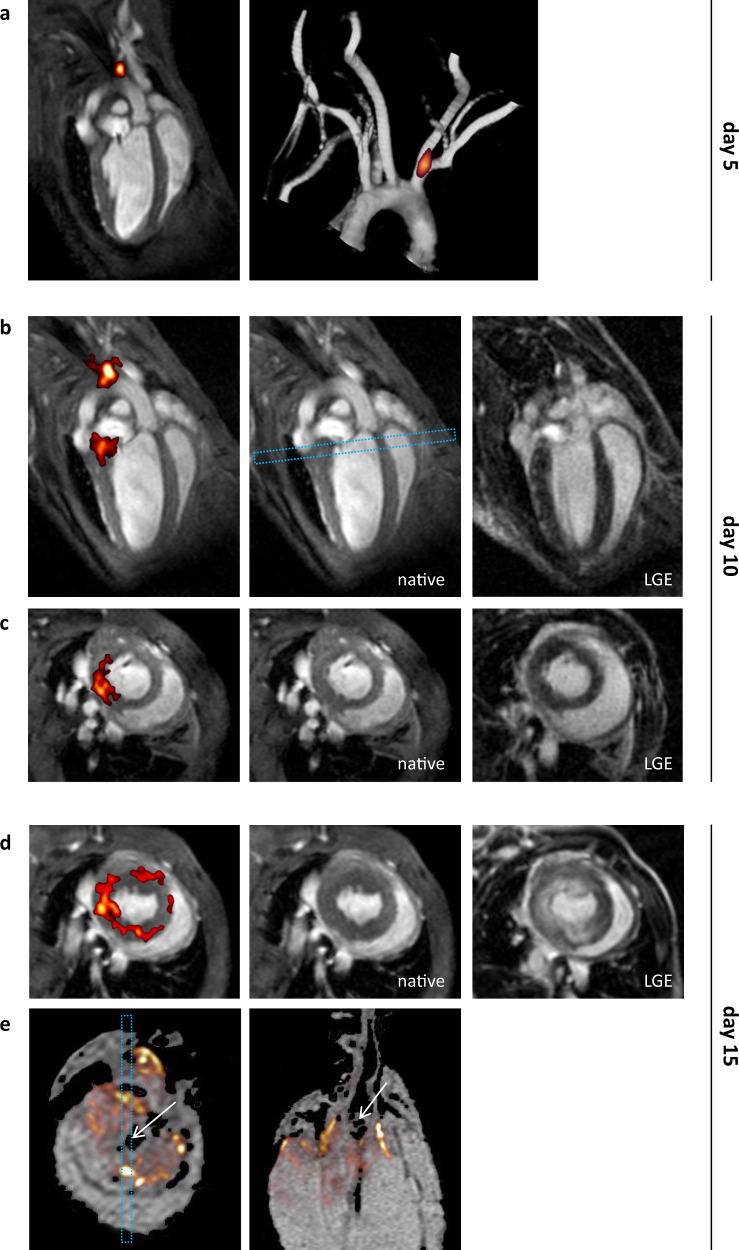
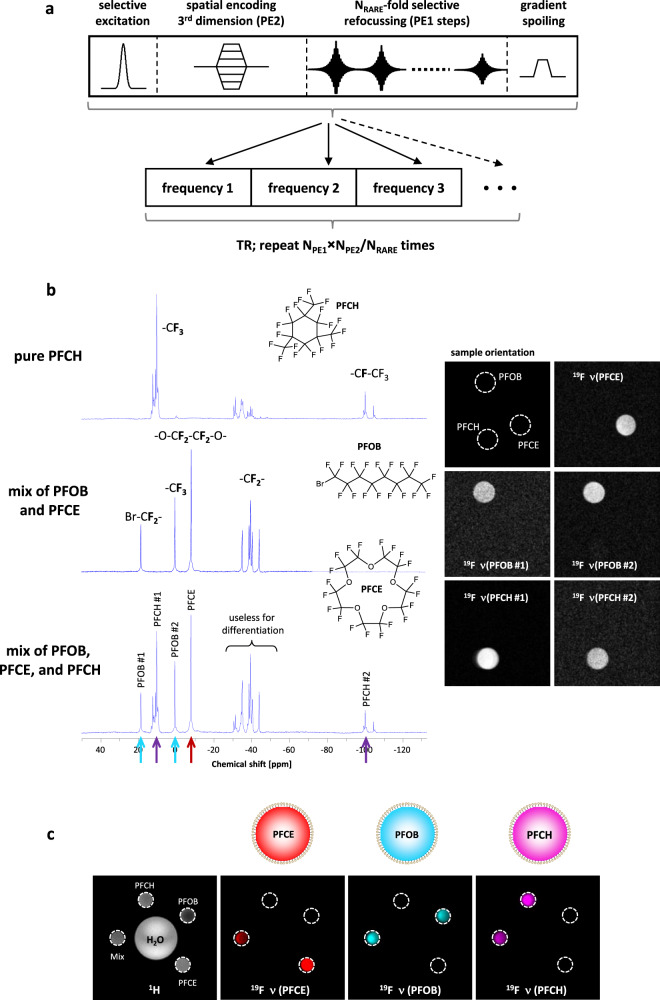
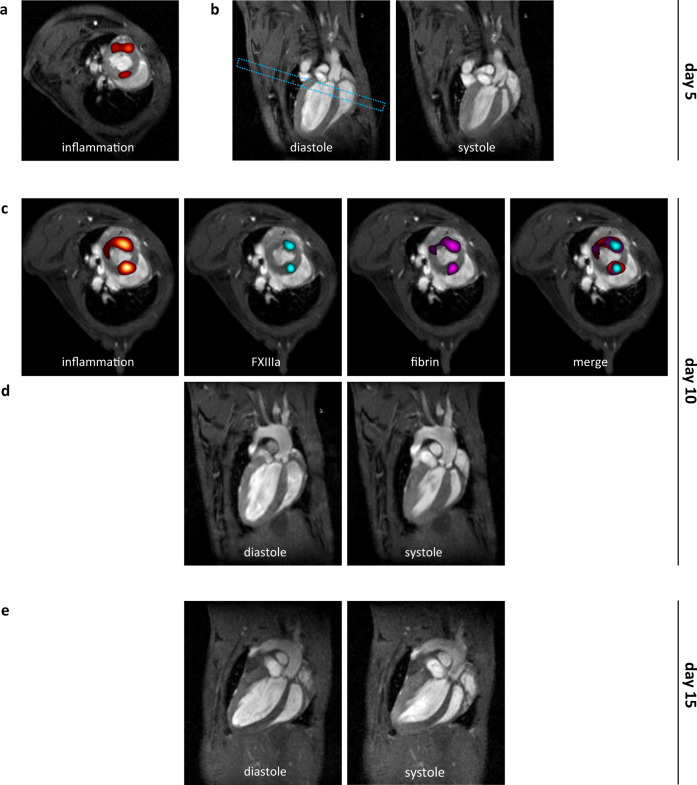
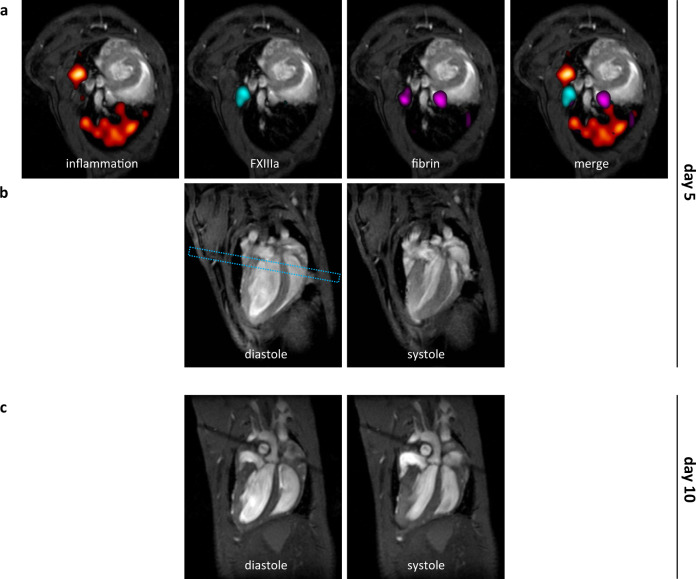
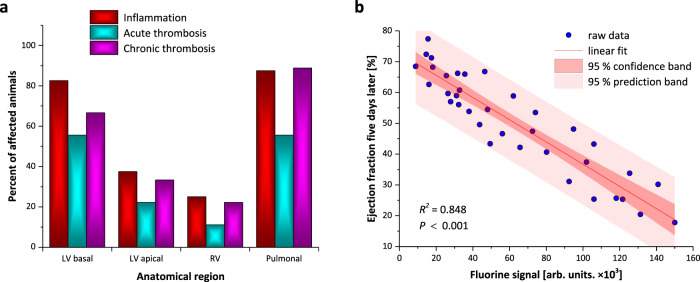
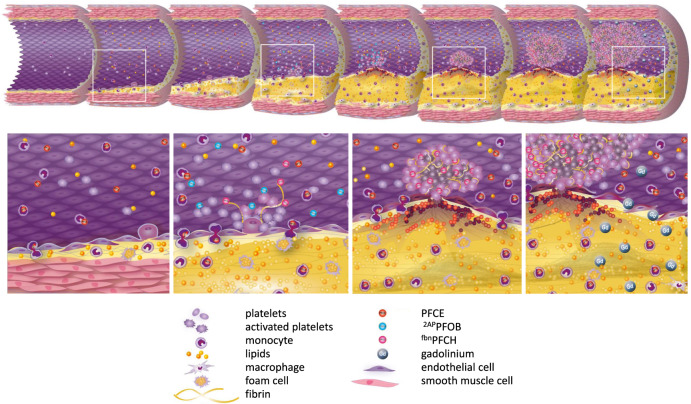
Prediction of the transition from stable to acute coronary syndromes driven by vascular inflammation, thrombosis with subsequent microembolization, and vessel occlusion leading to irreversible myocardial damage is still an unsolved problem. Here, we introduce a multi-targeted and multi-color nanotracer platform technology that simultaneously visualizes evolving danger patterns in the development of progressive coronary inflammation and atherothrombosis prior to spontaneous myocardial infarction in mice. Individual ligand-equipped perfluorocarbon nanoemulsions are used as targeting agents and are differentiated by their specific spectral signatures via implementation of multi chemical shift selective 19F MRI. Thereby, we are able to identify areas at high risk of and predictive for consecutive development of myocardial infarction, at a time when no conventional parameter indicates any imminent danger. The principle of this multi-targeted approach can easily be adapted to monitor also a variety of other disease entities and constitutes a technology with disease-predictive potential.


Conflict of interest statement

The authors declare no competing interests.

Figures

Fig. 1
Fig. 1. Early detection of cardiovascular inflammation and its gradual progression over time by 1H/19F MRI.
Tracking of PFC-loaded immune cells in the same mouse 5 days (a), 10 days (b+c) and 15 days (d+e) after onset of the diet. 19F MRI data are superimposed in red over anatomical 1H MRI data (greyscale). a First investigation on day 5: Long axis view (left) showing 19F signal only at the cusp of the aortic arch. The presence of 19F signal at the branching site of right common carotid and subclavian artery at the brachiocephalic trunk was further confirmed by merging of 19F and time-of-flight MR angiography data (middle). b+c Follow-up on day 10 revealed increased PFC deposition in the aortic arch and concomitantly onset of inflammation at the base of the heart (left). The dashed rectangle (middle) indicates the perpendicular view illustrated in c. Upon Gd application, in both views no signal enhancement was observed at the site of inflammation (b+c) right (LGE) vs middle (native). d Further check-up on day 15 demonstrated progressing annular infiltration of immune cells at the heart base, now associated with congruent LGE pattern. Thus, tracking of PFC-loaded immune cells early identified myocardial tissue later prone to myocardial ischemia. e Post mortem 3D 1H/19F MRI at an isotropic resolution of 40 µm revealed that the 19F label was primarily co-located with the proximal large coronary arteries at the base of the heart (left and middle, white arrows point to the aortic root; dashed rectangle in the short axis view represents spatial orientation of the long axis view), indicating infiltration of PFC-loaded immune cells into inflammatory hotspots within the coronary ostia and aortic valves as classical predilection sites of atherosclerosis.
Fig. 2
Fig. 2. Multi chemical shift selective imaging for artefact-free detection of different PFCs.
a Schematic presentation of the multi chemical shift selective imaging (mCSSI) pulse sequence. It can be considered as a multi-slice 3D rapid acquisition with relaxation enhancement (RARE) variant, in which slice selection is replaced by frequency selective excitation (NPE = number of phase encoding steps, NRARE = RARE factor). Narrow bandwidth excitation is followed by phase encoding of the third dimension and acquisition of the echo train with selective refocussing pulses. Gradient spoiling is required to destroy remaining transverse magnetization at the end of each cycle. This procedure is repeated for the number of excitation frequencies within one repetition time which is similar to TR of the standard RARE sequence. The method provides a complete 3D dataset for each of the excitation frequencies and allows the simultaneous acquisition of several frequencies within one scan. Either individual or (user-defined) sum images can be created from these datasets using dedicated reconstruction software. b Left: 19F MR spectra of pure PFCH (top), a mixture of PFOB + PFCE (middle) and a combination of all three PFCs (bottom). The arrows in the bottom spectrum indicate which signals were used for mCSSI. Chemical structures of PFCH, PFOB, and PFCE are given next to the spectra and signal assignments are indicated in bold. Right: 19F mCSSI images acquired from the individual resonance frequencies indicated on the left clearly demonstrate artefact-free imaging of the respective five signals. c 19F mCSSI of PFCE, PFCOB and PFCH and a composition of all PFCs (mix). Images are axial cross-sections through five microfuge tubes. The 1H image (left) shows the position of the samples with a large water phantom in the middle. Adjacent, the reconstructed 19F images for PFCE (red), PFOB (cyan), and PFCH (magenta) with the last two merged from the individual images #1 and #2, respectively (cf. b right). Note, that in the PFC mixture all three signals were found and that there are no false-positive signals.
Fig. 3
Fig. 3. Multi-targeted PFCs for thromboinflammatory states.
Concurrent monitoring of PFCs targeting inflammation (red), FXIIIa (cyan) and fibrin (magenta) in the same mouse 5 days (a+b), 10 days (c+d) and 15 (e) days after onset of the diet. 19F mCSSI data are superimposed over anatomical 1H MRI data (greyscale). First investigation on day 5 indicated a low cardiac inflammation at base level and b normal function in long axis views in diastole and systole (LVEF 67.5%). The dashed rectangle indicates the perpendicular view shown in a+c. Follow-up on day 10 revealed c enhanced infiltration of immune cells and both freshly developed (FXIIIa + fibrin) and persisting thrombosis (fibrin only) at sites of preceding inflammation (cf. a). d Despite incipient thrombosis in the left ventricle cardiac function still is preserved at this time (LVEF 66.4%). e Further check-up on day 15 depicts diastolic dilation and massively impaired systolic function (LVEF 25.7%).
Fig. 4
Fig. 4. Premature detection of pulmonary inflammation and thrombosis turns into right heart failure.
Multi-targeted PFCs for detection of inflammation (red), FXIIIa (cyan) and fibrin (magenta) in the same mouse 5 days (a+b) and 10 days (c) after onset of the diet. a 19F mCSSI data are superimposed over anatomical 1H MRI data (greyscale) and first investigation on day 5 indicated differentially affected tissue sites mainly in pulmonary areas with b normal function in long axis views in diastole and systole (LVEF 70.4%, RVEF 71.1%). The dashed rectangle indicates the perpendicular view shown in a. c Follow-up on day 10 revealed that preceding pulmonary thromboinflammation (a) leads to severe right ventricular impairment (LVEF 54.6%, RVEF 17.8%).
Fig. 5
Fig. 5. Occurrence, distribution, and prognostic value of detected 19F signals.
a Occurrence and distribution of detected danger patterns are expressed as percentage of animals affected by inflammation (red), acute (cyan) and chronic (magenta) thrombosis in different anatomical regions (n = 50 in 23/17/10 mice on days 5/10/15; LV, RV = left and right ventricle). b Linear regression analysis for detectable 19F signal at day x and cardiac function at day x+5, i.e. the follow-up investigation five days later (n = 36 in 9/17/10 mice on days 5/10/15, adjusted R2 = 0.84811, P = 2.926 × 10−15). The measure of center for the error band is given by the regression line of the linear fit with y = −0.0004x + 72.816 and the P value was determined from ANOVA sum of squares. Source data are provided as a source data file.
Fig. 6
Fig. 6. Unmasking of emerging danger patterns by multi-targeted PFCs.
Schematic drawing of the pathophysiological cascade from beginning coronary inflammation to atherothrombosis and vessel occlusion and the respective epitopes identified by multi-color 19F MRI. Top: Overview of the atherosclerotic continuum from coronary inflammation to occlusion in HypoE mice upon exposure to atherogenic high-fat diet. White rectangles indicate the magnified areas shown below. Bottom: 1st column: Uptake of injected PFCE droplets by circulating monocytes and early infiltration of 19F-loaded cells into inflamed endothelium; 2nd column: acute thrombosis leads to (i) incorporation of α2APPFOB into the developing fibrin network via cross-linking by FXIIIa and (ii) binding of fbnPFCH to fibrin strands; 3rd column: Advanced thrombi are labeled by fbnPFCHs only with no detectable signal for α2APPFOB due to lack of FXIIIa. Acute and advanced thrombosis are accompanied by progressing infiltration of PFCE-loaded monocytes into surrounding tissue; 4th column: Vessel occlusion results in ischemia accompanied by loss of endothelial integrity and late gadolinium enhancement.

References

    1. Virani SS, et al. Heart disease and stroke statistics − 2020 update: a report from the American heart association. Circulation. 2020;141:e139–e596. - PubMed
    1. Jackson SP, Darbousset R, Schoenwaelder SM. Thromboinflammation: challenges of therapeutically targeting coagulation and other host defense mechanisms. Blood. 2019;133:906–918. doi: 10.1182/blood-2018-11-882993. - DOI - PubMed
    1. Partida RA, Libby P, Crea F, Jang I-K. Plaque erosion: a new in vivo diagnosis and a potential major shift in the management of patients with acute coronary syndromes. Eur. Heart J. 2018;39:2070–2076. doi: 10.1093/eurheartj/ehx786. - DOI - PMC - PubMed
    1. Chen Y-C, Huang AL, Kyaw TS, Bobik A, Peter K. Atherosclerotic plaque rupture: Identifying the straw that breaks the camel’s back. Arterioscler. Thromb. Vasc. Biol. 2016;36:e63–e72. - PubMed
    1. Libby P, Pasterkamp G, Crea F, Jang I-K. Reassessing the mechanisms of acute coronary syndromes. Circ. Res. 2019;124:150–160. doi: 10.1161/CIRCRESAHA.118.311098. - DOI - PMC - PubMed

Publication types