. 2021 Oct 6;12(1):5857.
doi: 10.1038/s41467-021-26135-9.

The GPR171 pathway suppresses T cell activation and limits antitumor immunity

Affiliations

The GPR171 pathway suppresses T cell activation and limits antitumor immunity

Yuki Fujiwara et al. Nat Commun. .

Abstract

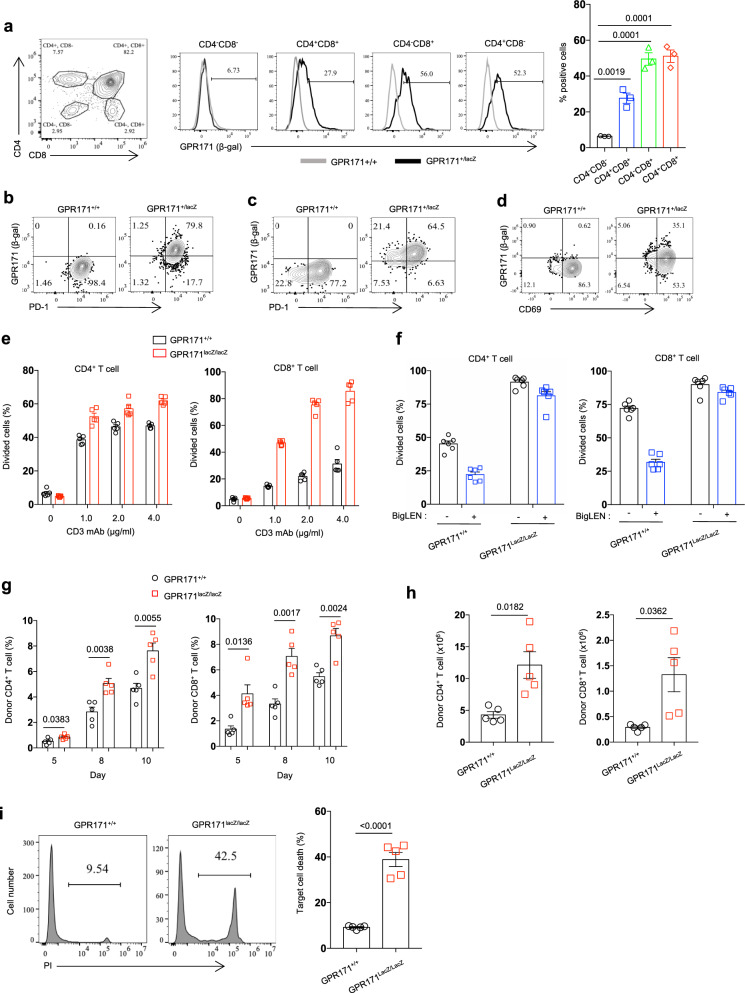
The recently identified G-protein-coupled receptor GPR171 and its ligand BigLEN are thought to regulate food uptake and anxiety. Though GPR171 is commonly used as a T cell signature gene in transcriptomic studies, its potential role in T cell immunity has not been explored. Here we show that GPR171 is transcribed in T cells and its protein expression is induced upon antigen stimulation. The neuropeptide ligand BigLEN interacts with GPR171 to suppress T cell receptor-mediated signalling pathways and to inhibit T cell proliferation. Loss of GPR171 in T cells leads to hyperactivity to antigen stimulation and GPR171 knockout mice exhibit enhanced antitumor immunity. Blockade of GPR171 signalling by an antagonist promotes antitumor T cell immunity and improves immune checkpoint blockade therapies. Together, our study identifies the GPR171/BigLEN axis as a T cell checkpoint pathway that can be modulated for cancer immunotherapy.


Conflict of interest statement

The authors declare no competing interests.

Figures

Fig. 1
Fig. 1. GPR171 signaling inhibits human T-cell activation.
a GPR171 transcript in different immune cells isolated from peripheral blood of healthy donor was determined by qPCR. b GPR171 protein in human PBMC and Jurkat cells were examined by western blot. HEK293T cells transduced to express GPR171(GPR171 + HEK293T) were used as a positive control. cf Human T cells were stimulated with coated OKT3 with or without BigLEN. The percentage of divided CD8+ T cells (c) and the number of live cells (d), were determined 6 days after stimulation. 6 days post-stimulation, CD4+ T-cell division in response to titrated OKT3 with or without BigLEN was determined (e). Cytokines in the supernatant were quantified (f). Except IL-2 (day 2), all other cytokines were measured in CD4+ T-cell supernatant after 6 days culture. g Intracellular calcium levels over time in WT or GPR171KO Jurkat cells stimulated with OKT3 and different concentration of BigLEN (upper). The area under the curve (AUC) from the calcium flux test was calculated (lower). The dashed arrow indicated the addition of OKT3. h Luciferase activity of WT or GPR171KO Jurkat-NFAT-Luc cells stimulated by PD-L1+ CHO stimulator for 4 h. BigLEN or PD-1 mAb was added at the beginning of culture. i Western blot of phosphorylated PLCγ1, ERK and AKT in WT or GPR171KO Jurkat cells stimulated with OKT3 or OKT3 + BigLEN at different timepoints. j Western blot of phosphorylated ZAP70 and CD3ζ in WT or GPR171KO Jurkat cells stimulated with OKT3 + CD28 mAbs or OKT3 + CD28mAbs + BigLEN at different timepoints. Statistical significance was determined by two-tailed Student’s t-test for f. Unless otherwise denoted, values are mean ± SEM. Source data was provided as a Source Data file. Data are representative of two (a, b, c, d, e, f, g, h, and j) or three independent experiments (i).
Fig. 2
Fig. 2. The BigLEN/GPR171 interaction inhibits mouse T-cell response.
a, b CFSE-labeled naive OT-1 T cells were stimulated with different concentrations of SIINFEKL peptide for 6 days. The percentages of divided OT-1 cells (a) and the numbers of live OT-1 cells (b) were determined by flow cytometry. c, d B6 mice transferred with naive CD45.1+ OT-1 T cells were immunized with OT-1 peptide and followed with the treatment of GPR171 antagonist. Transferred OT-1 T cells in peripheral blood at 4 and 7 days after peptide injection were examined by flow cytometry (c). The number of CD45.1+ OT-1 T cells in the spleen at 7 days after injection was enumerated (d). e, f B16-OVA bearing mice were transferred with CFSE-labeled CD45.1+ naive OT-1 T cells and followed with the treatment of GPR171 antagonist. 5 and 7 days after OT-1 transfer, the divisions (e) and percentages (f) of transferred OT-1 T cells in dLNs were determined. c, d n = 8 (control) and n = 7 (GPR171 antagonist) biologically independent samples. e, f n = 3 biologically independent samples. Statistical significance was determined by two-tailed Student’s t-test for c, d, e, f. Unless otherwise denoted, values are mean ± SEM. Source data was provided as a Source Data file. All data are representative of two independent experiments.
Fig. 3
Fig. 3. T cells from GPR171 KO mice are hyperactive to antigen stimulation.
a GPR171 (β-gal) expression in thymus immune cells from naive WT or GPR171+/LacZ mice. b Flow cytometry analysis of GPR171 expression (β-gal) in activated CD4+ T cells from WT or GPR171+/LacZ mice. c Flow cytometry analysis of GPR171 expression (β-gal) in activated CD8+ T cells from WT or GPR171+/LacZ mice. d Flow cytometry analysis of GPR171 expression (β-gal) in splenic NK cells from WT or GPR171+/LacZ mice injected with poly I:C. e CFSE-labeled T cells from WT  or GPR171LacZ/LacZ mice were stimulated with titrated mCD3 mAb for 3 days. Cell division of CD4+ and CD8+T cells were quantified by CFSE dilution. f CFSE-labeled WT or GPR171LacZ/LacZ T cells were stimulated with mCD3 mAb and BigLEN for 3 days. Cell division of CD4+ and CD8+ T cells were quantified by CFSE dilution. gi Splenocytes from WT or GPR171Lacz/LacZ mice were transferred into B6D2F1/J to induce GVH response. Donor T cells in peripheral blood were determined by flow cytometry (g). On day 10 after transfer, the numbers of graft T cells in the spleen were enumerated (h). The alloreactivity of splenocytes was evaluated by their 4-h killing capacity against CFSE-labeled BALB/c splenocytes (i). a n = 3 biologically independent samples. g, h and i n = 5 biologically independent sample. Statistical significance was determined by one-way ANOVA for a and two-tailed Student’s t-test for ag, h, and i. Unless otherwise denoted, values are mean ± SEM. Source data was provided as a Source Data file. All data are representative of two independent experiments.
Fig. 4
Fig. 4. Genomic knockout of GPR171 exhibits stronger antitumor immunity.
a, b GPR171LacZ/lacZ mice were inoculated with MC38 tumors for 14 days. The expression of GPR171 (β-gal) on T cells and NK cells in dLN and tumor were quantified by flow cytometry (a). In GPR171lacZ/lacZ tumors, TILs were examined for the expressions of GPR171 together with immune checkpoints (ICs), including PD-1, LAG3, TIGIT, and TIM3 (b). ch GPR171lacZ/lacZ GPR171+/lacZ, and WT littermates were inoculated subcutaneously with MC38 tumor cells. Tumor growth curve (c) and tumor weight (d) at day 16 after tumor inoculation were determined. Single-cell suspensions were prepared from MC38 tumors to determine the densities of immune cells (e). The frequency of CD4+ Treg cells (f), the ratio of CD8/Treg (g), as well as the percentages of CD8+ T cells expressing Granzyme B or CD137 (h), within tumors were quantified. (i) MC38 tumor weights after 19 days of tumor inoculation were determined. In some mice, NK cells, CD4 + T cells, or CD8+ T cells were eliminated by corresponding depleting antibody. jn GPR171lacZ/lacZ and WT littermates were injected intravenously with B16F10 tumor cells. Overall survival of mice was followed till 60 days after tumor inoculation (j). 4 weeks later, gross images of lung metastasis were taken (k); lung weight (l) and tumor nodules in the lung (m) were quantified. The incidences of tumor metastasis in organs other than lung were recorded (n). a n = 8 biologically independent samples. b n = 4 biologically independent samples. cd n = 8 (WT littermates and GPR171lacZ/lacZ) and n = 6 (GPR171+/lacZ) biologically independent samples. ei n = 8 (WT littermates) and n = 10 (GPR171lacZ/lacZ) biologically independent samples. fh n = 8 (WT littermates) and n = 8 (GPR171lacZ/lacZ) biologically independent samples. j n = 7 biologically independent samples. kn n = 7 biologically independent samples. Statistical significance was determined by one-way ANOVA for d and i, two-tailed Student’s t-test for a, b, d, e, f, g, h, l and m, two-way ANOVA for c, log-rank test for j or chi-square test for n. Unless otherwise denoted, values are mean ± SEM. Source data was provided as a Source Data file. Data are representative of two (a, b, i, j, k, l, m, and n) or three independent experiments (c, d, e, f, g, and h).
Fig. 5
Fig. 5. GPR171 antagonist promotes T-cell-mediated antitumor immunity.
a, b Black B6 mice were inoculated with MC38 tumor cells and followed with the treatment of GPR171 antagonist or control saline three times per week. Tumor volume was recorded (a). In some mice, CD4+ or CD8+ T cells were depleted by specific antibodies right before tumor challenge; tumor volume at 18 days after tumor inoculation was determined (b). cg Single-cell suspensions were prepared from MC38 tumors harvested on day 17 after tumor inoculation. Flow cytometry analysis was performed to determine the densities of infiltrating immune cells (c). The ratio of CD8+ to CD4+ T cells (d), the percentages of Foxp3+ Treg in CD4+ T cells (e), as well as PD-1 and TIGIT-double-positive CD8+ T cells (f) were determined by flow cytometry analysis. The percentages of IFN-γ and TNF-α -producing cells in CD8+ TILs were determined by intracellular staining (g). h Black B6 mice inoculated with B16-OVA tumor cells were treated with GPR171 antagonist or control saline daily right after tumor inoculation. Tumor volume and weight at 14 days after tumor inoculation were recorded. i BALB/c mice inoculated with CT26 tumor cells were treated with GPR171 antagonist or control saline daily right after tumor inoculation. Tumor volume and weight at 21 days after tumor inoculation were recorded. a n = 5 biologically independent samples. b n = 7 (control and GPR171 antagonist group) and n = 5 (GPR171 antagonist + CD4 mAb and GPR171 antagonist + CD8 mAb group). cg n = 7 biologically independent samples. h, i n = 7 (Control) and n = 8 (GPR171 antagonist). Statistical significance was determined by One-way ANOVA for b, two-tailed Student’s t-test for c, d, e, f, g, h and i, Two-way ANOVA for a, h, and i. Unless otherwise denoted, values are mean ± SEM. Source data was provided as a Source Data file. Data are representative of three (a, b, c, d, e, f, and g) or two independent experiments (h and i).
Fig. 6
Fig. 6. GPR171 blockade improves therapeutic antitumor effect of ICB.
a TILs from MC38 tumors in GPR171+/LacZ mice under 10 days control or PD-1 mAb treatment were analyzed for TIM3 and GPR171 expression. b Tumor growth and tumor-related survival of MC38-bearing mice under the treatment of PD-1 mAb and GPR171 antagonist were shown. Therapy was started 10 days after tumor inoculation. c Tumor growth and tumor-related survival of CT26-bearing mice under the treatment of TIGIT mAb and GPR171 antagonist were shown. Therapy was started 7 days after tumor inoculation. df Tumor growth and survival of B16F10-bearing mice treated with ICB (PD-L1 + CTLA-4 mAbs) together with GPR171 antagonist were shown (d). Therapy was started 7 days after tumor inoculation. 14 days after therapy, single-cell suspensions were prepared to determine the percentages of intratumoral CD8+ T cells (e) and cytokine- producing CD8+ T cells (f). In Figure b, c, and d, the dash line in each left panel indicates the date when all control mice were dead due to tumor burden. The dash line in each right panel shows median survival. GPR171 antagonist was administrated three times a week for up to total nine times while antibody was injected twice per week for up to total six times. a n = 8 biologically independent samples. b n = 6 (control, GPR171 antagonist and PD-L1 group) and n = 7 (combination group). c n = 7 (control, GPR171 antagonist and TIGIT group) and n = 8 (combination group). d n = 7 (control and GPR171 antagonist group) and n = 8 (ICB and combination group). e and f n = 4 biologically independent samples. Statistical significance was determined by One-way ANOVA for e and f, two-tailed Student’s t-test for a, or Log-rank test for b, c and d. Unless otherwise denoted, values are mean ± SEM. Source data was provided as a Source Data file. All data are representative of two independent experiments.

References

    1. Zhu Y, Yao S, Chen L. Cell surface signaling molecules in the control of immune responses: a tide model. Immunity. 2011;34:466–478. doi: 10.1016/j.immuni.2011.04.008. - DOI - PMC - PubMed
    1. Greenwald RJ, Freeman GJ, Sharpe AH. The B7 family revisited. Annu. Rev. Immunol. 2005;23:515–548. doi: 10.1146/annurev.immunol.23.021704.115611. - DOI - PubMed
    1. Wherry EJ, Kurachi M. Molecular and cellular insights into T cell exhaustion. Nat. Rev. Immunol. 2015;15:486–499. doi: 10.1038/nri3862. - DOI - PMC - PubMed
    1. Anderson AC, Joller N, Kuchroo VK. Lag-3, Tim-3, and TIGIT: co-inhibitory receptors with specialized functions in immune regulation. Immunity. 2016;44:989–1004. doi: 10.1016/j.immuni.2016.05.001. - DOI - PMC - PubMed
    1. Le Mercier I, Lines JL, Noelle RJ. Beyond CTLA-4 and PD-1, the generation Z of negative checkpoint regulators. Front. Immunol. 2015;6:418. doi: 10.3389/fimmu.2015.00418. - DOI - PMC - PubMed

Publication types

MeSH terms