. 2021 Oct 6;12(1):5848.
doi: 10.1038/s41467-021-26153-7.

Pig genome functional annotation enhances the biological interpretation of complex traits and human disease

Affiliations

Pig genome functional annotation enhances the biological interpretation of complex traits and human disease

Zhangyuan Pan et al. Nat Commun. .

Abstract

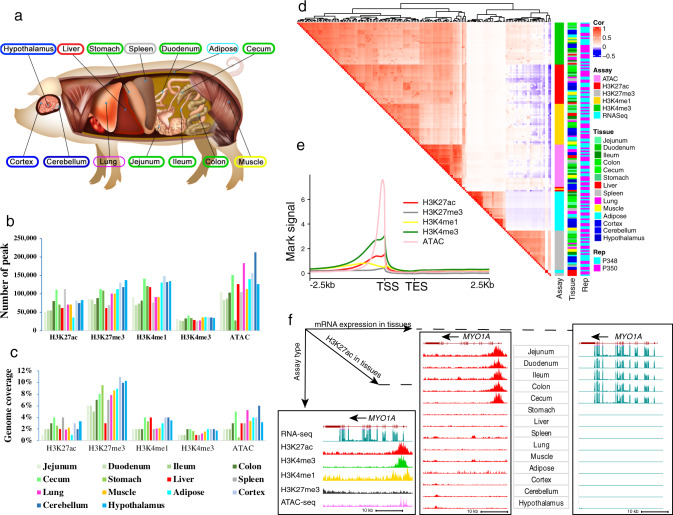
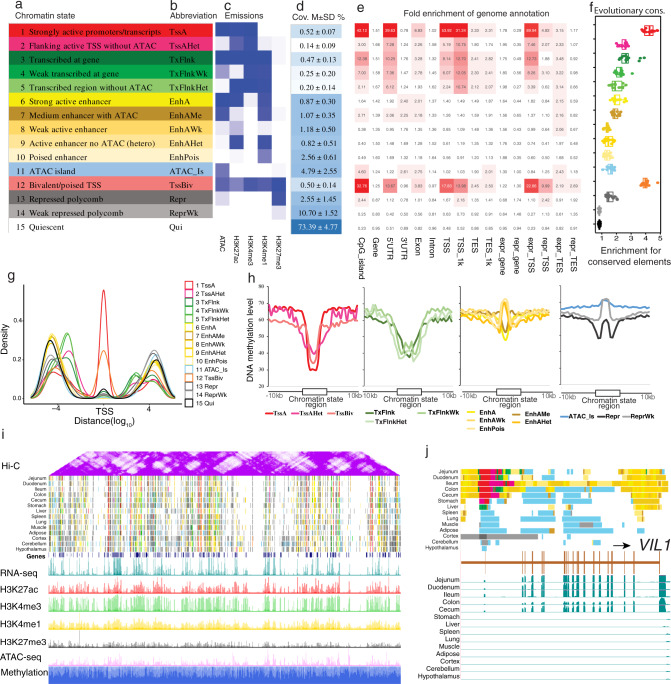
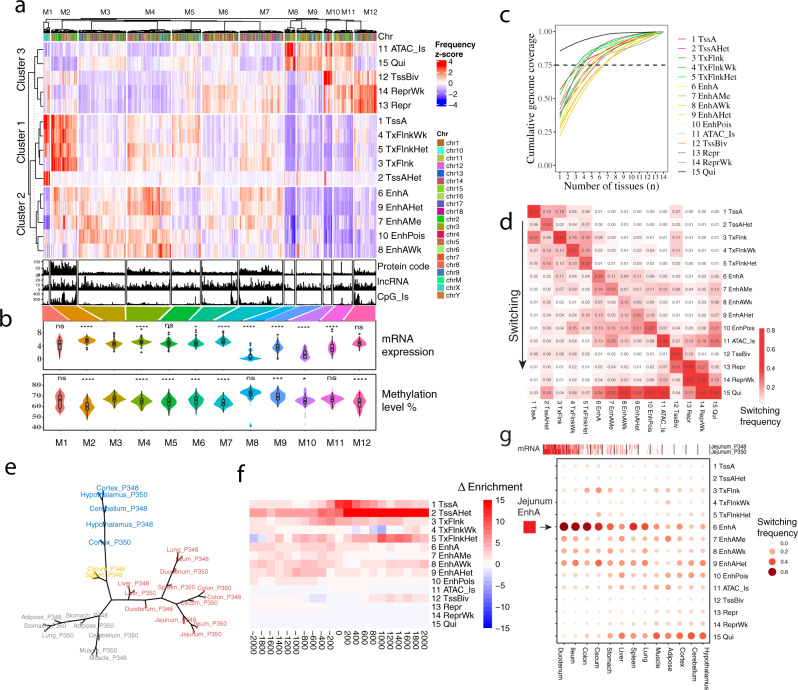
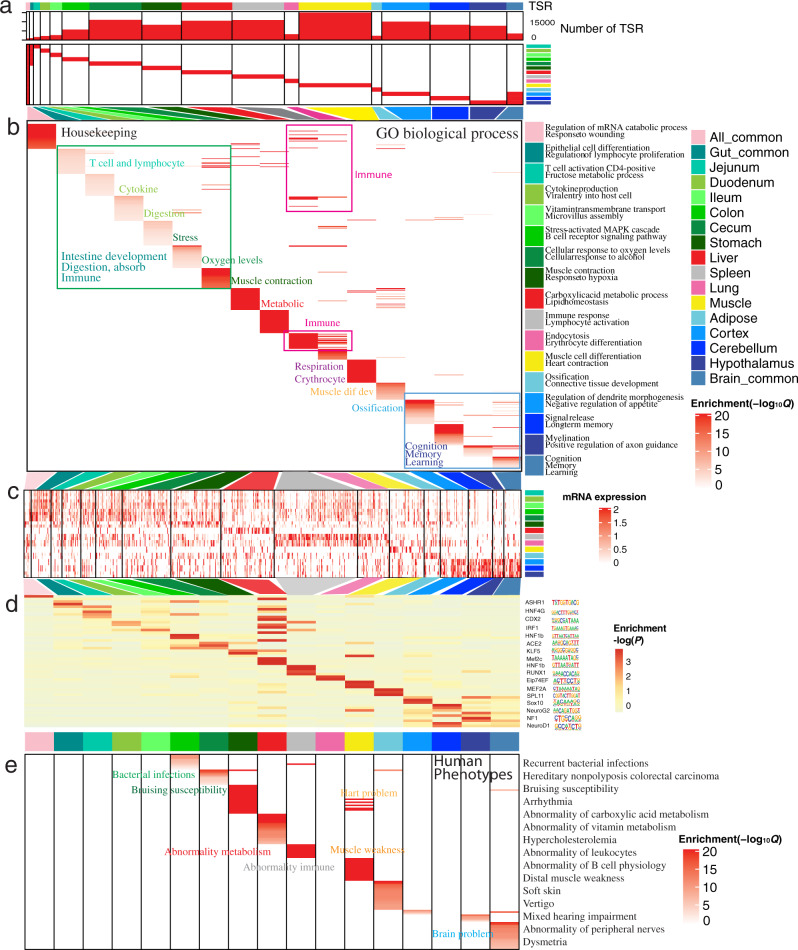
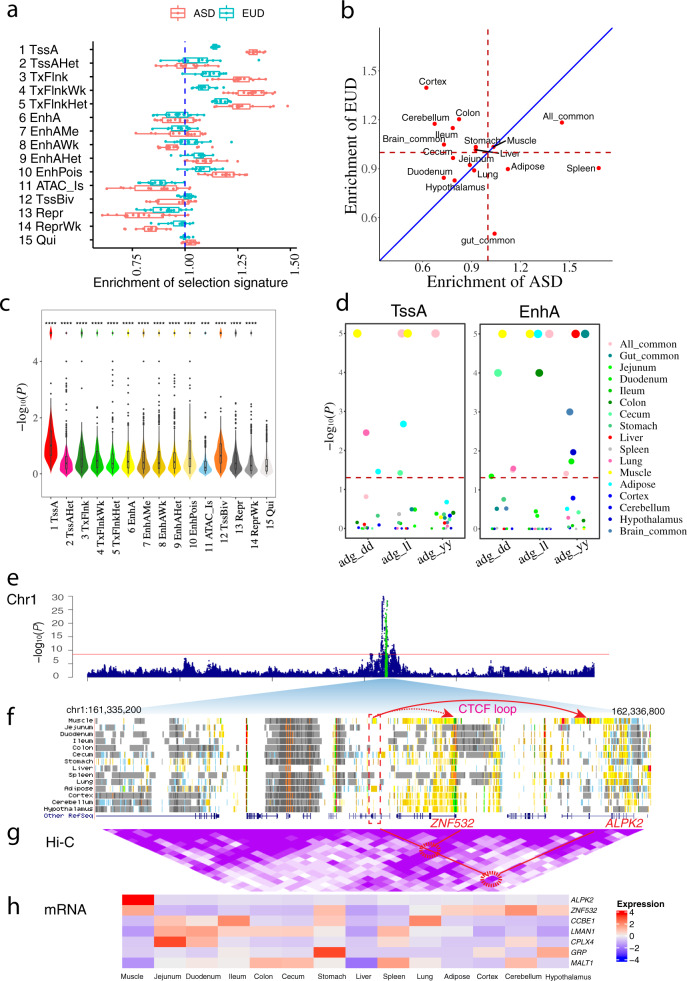
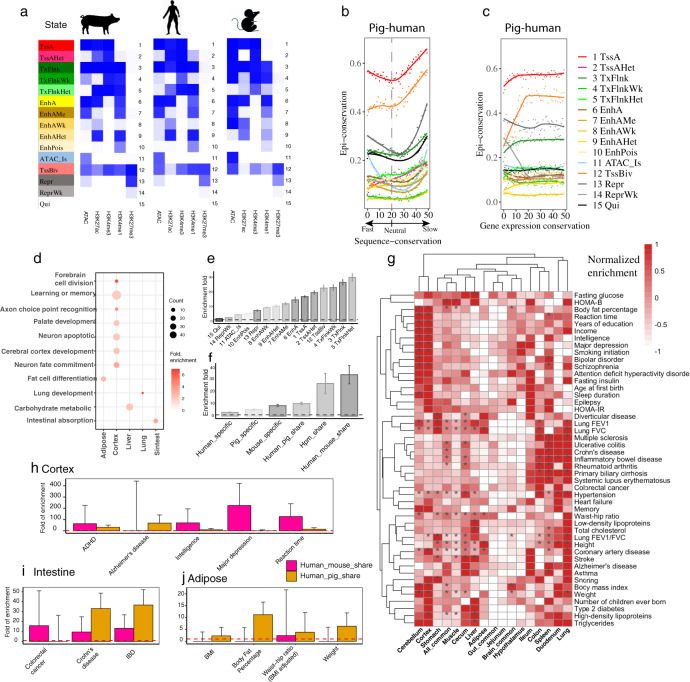
The functional annotation of livestock genomes is crucial for understanding the molecular mechanisms that underpin complex traits of economic importance, adaptive evolution and comparative genomics. Here, we provide the most comprehensive catalogue to date of regulatory elements in the pig (Sus scrofa) by integrating 223 epigenomic and transcriptomic data sets, representing 14 biologically important tissues. We systematically describe the dynamic epigenetic landscape across tissues by functionally annotating 15 different chromatin states and defining their tissue-specific regulatory activities. We demonstrate that genomic variants associated with complex traits and adaptive evolution in pig are significantly enriched in active promoters and enhancers. Furthermore, we reveal distinct tissue-specific regulatory selection between Asian and European pig domestication processes. Compared with human and mouse epigenomes, we show that porcine regulatory elements are more conserved in DNA sequence, under both rapid and slow evolution, than those under neutral evolution across pig, mouse, and human. Finally, we provide biological insights on tissue-specific regulatory conservation, and by integrating 47 human genome-wide association studies, we demonstrate that, depending on the traits, mouse or pig might be more appropriate biomedical models for different complex traits and diseases.


Conflict of interest statement

The authors declare no competing interests.

Figures

Fig. 1
Fig. 1. Data summary of epigenomic information across tissues and marks.
a Tissues assayed by this study. b, c Average peak number and genome coverage for each epigenetic mark in each tissue. d The Pearson correlations among assays, tissues, and biological replicates (P348 and P350) based on the normalized signal in 1 kb windows stepped across the whole genome. e Average epigenetic mark signal proximal to protein-coding genes. TSS transcription start site, TES transcription end site. f Epigenetic signal at the MYO1A locus according to different assays and in different tissues. Vertical scale of UCSC tracks shows normalized signal from 0 to 200 for RNA-seq, 0 to 100 for H3K27ac and H3K4me3, and 0 to 50 for other marks and ATAC-seq.
Fig. 2
Fig. 2. Chromatin landscape across 14 tissues.
a, b Definitions and abbreviations of 15 chromatin states. c Emission probabilities of individual epigenetic marks for each chromatin state. The color from white to deep blue indicates emission probability (0–1). d Genomic coverage of each chromatin state. M ± SD mean ± standard deviation. e Average enrichment of chromatin states for genomic annotations, including CpG islands, genes, TSS/TES_1K (±1 kb around TSS and TES), expressed genes (TPM ≥ 0.1), and repressed genes (TPM < 0.1) in each tissue. f Fold enrichments of chromatin states for non-coding mammalian conserved elements from Genomic Evolutionary Rate Profiling (GERP). Whiskers show 1.5× interquartile range. Each data point represents one of 14 different tissues. g Density of each chromatin state in positions relative to gene TSS. h Average methylation level of chromatin states in jejunum. i Hi-C (250 kb resolution), predicted chromatin states, epigenetic signal, and normalized methylation level in jejunum across chromosome 7. j Chromatin state landscape and mRNA expression at VIL1 locus (chr15:120,459,825-120,493,312, susScr11) across 14 tissues. Vertical scale of UCSC tracks shows normalized signal from 0 to 200 for RNA-seq.
Fig. 3
Fig. 3. Genome-wide chromatin state dynamics across tissues.
a Clustering of 2 Mb intervals (1224 columns) into modules (M1–M12) based on average chromatin state frequency across tissues in each interval. Number of protein-coding genes, lncRNA, and CpG islands in each interval shown in bottom. b Average mRNA expression (log2(TPM + 1)) of genes and average methylation level of 2 Mb intervals belonging to each module. M1–M12 module was comprised of 24, 100, 183, 167, 111, 139, 168, 41, 98, 33, 75, 85 intervals, respectively. M3 was used as reference for the statistical two-sided t-test, where *P < 0.05, **P < 0.01, and ***P < 0.001. P values of gene expression (M1 = 0.33, M2 < 2.2e-16, M4 = 4.8e-10, M5 = 0.15, M6 = 0.017, M7 = 1e-14, M8 < 2.2e-16, M9 = 3.3e-10, M10 = 2.5e-15, M11 = 8.6e-08, M12 = 0.08); P values of methylation level (M1 = 0.066, M2 < 2.2e-16, M4 = 6.7e-09, M5 = 8.1e-07, M6 = 0.00027, M7 < 2.2e-16, M8 = 0.1, M9 = 0.00028, M10 = 0.049, M11 = 0.26, M12 = 5.5e-07). No adjustment was made for multiple comparisons. Whiskers show 1.5× interquartile range. Black circles were outliers. c Chromatin state variability based on cumulative genome coverage fraction. Dashed line = 0.75. d Chromatin state switching between all tissues. e Hierarchical epigenome clustering using H3K4me1 signal in EnhA states. f Chromatin state enrichment in promoters of genes with jejunum-specific expression, relative to muscle. g Chromatin state switching of target enhancers (EnhA) of jejunum-specific genes in other tissues.
Fig. 4
Fig. 4. Tissue-specific strong enhancers (EnhA) and their potential functions in 14 tissues.
a The number and enrichment distribution of 17 modules of TSR (strong enhancers (EnhA)) in tissues. TSR tissue-specific regulatory elements. The top colors represent 17 modules of strong enhancers (column) referred to by the legend on the right. The side colors represent 14 tissues (row), also referred to by the legend on the right. b Functional enrichment of proximal genes for each module based on gene ontology (GO) biological processes. The columns represent 17 modules of strong enhancers. The rows represent GO terms in each module. All GO terms are presented in Supplementary Data 5. Notes within the heatmap summarize functions of nearby GO terms (up-noted from jejunum to spleen, down-noted for lung, muscle, and adipose). c The average expression (TPM) of EnhAs’ putative target genes in each module. The columns represent the genes in each module, the rows represent each tissue. d The enrichment of transcription factor motifs in each module. The columns represent 17 modules of EnhAs. The rows represent motifs. All enriched motifs are presented in Supplementary Fig. 10a. The P values were generated by HOMER. e Enrichment for human phenotypes in each module, based on proximal genes. The columns represent 17 modules of EnhAs. The rows represent phenotypes. The enrichment of all phenotypes is presented in Supplementary Data 7. Notes within the heatmap summarize nearby enriched phenotypes, with the color of the text indicating the corresponding tissue.
Fig. 5
Fig. 5. Chromatin state plays an important role in pig domestication and complex traits.
a Domestication selection signature enrichment within chromatin states in Asian and European pigs. ASD Asian pig domestication, EUD European pig domestication. Values greater than 1 (dashed line) indicate significant enrichment. Whiskers show 1.5× interquartile range. Each datapoint represents one of 14 different tissues. b Domestication selection signature enrichment in tissue-specific promoters (TssA) between Asian and European pigs. Values >1 (dashed line) indicate significant enrichment, measured by Fisher’s exact test. Deviation from the diagonal line shows a tissue’s enrichment tendency towards either Asian or European pigs. c Genome-wide association study (GWAS) signal enrichment within chromatin states across 14 tissues and 44 complex traits in pigs. The statistical significance of comparisons were calculated by two-sided t-test using “15 Qui” as a reference. No adjustment was made for multiple comparisons. ***P < 0.001. The P-value in each group were “1 TssA”<2.2e-16, “2 TssAHet”=9.1e-09, “3 TxFlnk”< 2.2e-16, “4 TxFlnkWk”=6.7e-16, “5 TxFlnkHet”=2.8e-12, “6 EnhA”<2.2e-16, “7 EnhAMe”=3.6e-16, “8 EnhAWk”=2.5e-16, “9 EnhAHet”<2.2e-16, “10 EnhPois”<2.2e-16, “11 ATAC_Is”= 0.00015, “12 TssBiv”<2.2e-16, “13 Repr”=7.1e − 15, and “14 ReprWk”=3.8e-10. Whiskers show 1.5× interquartile range. Black points were outliers. d GWAS signal enrichment of promoter (TssA) and strong enhancer (EnhA) tissue-specific regulatory elements (TSR) for average daily gain (ADG) in three pig populations (dd: Duroc, ll: Landrace, yy: Yorkshire). Significance was based on 10,000 iterations of a genotype cyclical permutation test. Dashed line set at −log10(P = 0.05). Values over the dashed line were significantly enriched. e Manhattan plot of ADG in the Landrace population (88,984). f Chromatin states for each tissue in a genomic region where GWAS hits were found. Dashed rectangular box includes a muscle-specific enhancer that coincides with GWAS hits. Arrows in red indicate predicted CTCF looping and H3K27ac signal, which together suggest that the muscle-specific enhancer may target ZNF532 and ALPK2. g Hi-C loop (25 kb resolution) depiction between a muscle-specific enhancer and putative target genes. Purple shading for the Hi-C data represents loop intensity (auto-scale). Two highlighted Hi-C loops delineated with red circles are potential contacts between a muscle-specific enhancer and ZNF532 and ALPK2. h Expression (normalized and centered TPM) of genes proximal to the muscle-specific enhancer.
Fig. 6
Fig. 6. Interspecies conservation of chromatin states.
a 15 chromatin states predicated in three species. The colors from white to deep blue indicate emission probabilities, ranging from 0 to 1. b Relation between sequence conservation and epigenomic conservation across six tissues. Fifty genomic regions were ordered from the fastest changing (0th), neutral (20th), and slowest changing (49th) in terms of sequence conservation (Supplementary Fig. 16d). Epigenome conservation (see Methods section) for each chromatin state within each region was calculated between pigs and humans and plotted. c Relation between expression conservation and epigenomic conservation across six tissues. Expression conservation was based on expression of 14,302 orthologous genes among the three species. Regions were ordered from the biggest difference in expression (0th), to the smallest difference (49th). d GO enrichment was based on genes proximal to (±2 kb) human-specific TssA with extreme sequence conservation (49th). Count refers to the number of genes. e Human GWAS (47 traits) signal enrichment in 15 different chromatin states across six tissues. Enrichment was the proportion of heritability divided by the proportion of SNPs in each chromatin state. Values greater than the dashed line (set at 1) indicate significant enrichment. Error bars represent standard error around the estimates of enrichment. Dashed lines and error bars are similarly formatted in sub-figures (f, hj). f Human GWAS (47 traits) enrichment in six groups of species-specific or shared EnhA across six tissues. (hpm_share stands for human-pig-mouse shared). g GWAS enrichment of pig tissue-specific enhancer (EnhA) in humans. “*” indicates FDR < 0.05. hj Different GWAS enrichments between human-pig and human-mouse shared strong enhancers (EnhA) in brain cortex (1799 vs. 61 enhancers), small intestine (5311 vs. 2430 enhancers), and adipose (2014 vs. 1638 enhancers), respectively. Data in Figs. ej are available at  10.6084/m9.figshare.16531197.v1.

References

    1. Consortium EP, et al. Expanded encyclopaedias of DNA elements in the human and mouse genomes. Nature. 2020;583:699–710. doi: 10.1038/s41586-020-2493-4. - DOI - PMC - PubMed
    1. Consortium EP. The ENCODE (ENCyclopedia of DNA elements) project. Science. 2004;306:636–640. doi: 10.1126/science.1105136. - DOI - PubMed
    1. Consortium EP. Identification and analysis of functional elements in 1% of the human genome by the ENCODE pilot project. Nature. 2007;447:799. doi: 10.1038/nature05874. - DOI - PMC - PubMed
    1. Dunham I, et al. An integrated encyclopedia of DNA elements in the human genome. Nature. 2012;489:57. doi: 10.1038/nature11247. - DOI - PMC - PubMed
    1. Filion GJ, et al. Systematic protein location mapping reveals five principal chromatin types in Drosophila cells. Cell. 2010;143:212–224. doi: 10.1016/j.cell.2010.09.009. - DOI - PMC - PubMed

Publication types