. 2021 Oct;23(10):1095-1104.
doi: 10.1038/s41556-021-00764-0. Epub 2021 Oct 6.

POLθ-mediated end joining is restricted by RAD52 and BRCA2 until the onset of mitosis

Affiliations

POLθ-mediated end joining is restricted by RAD52 and BRCA2 until the onset of mitosis

Marta Llorens-Agost et al. Nat Cell Biol. 2021 Oct.

Erratum in

Abstract

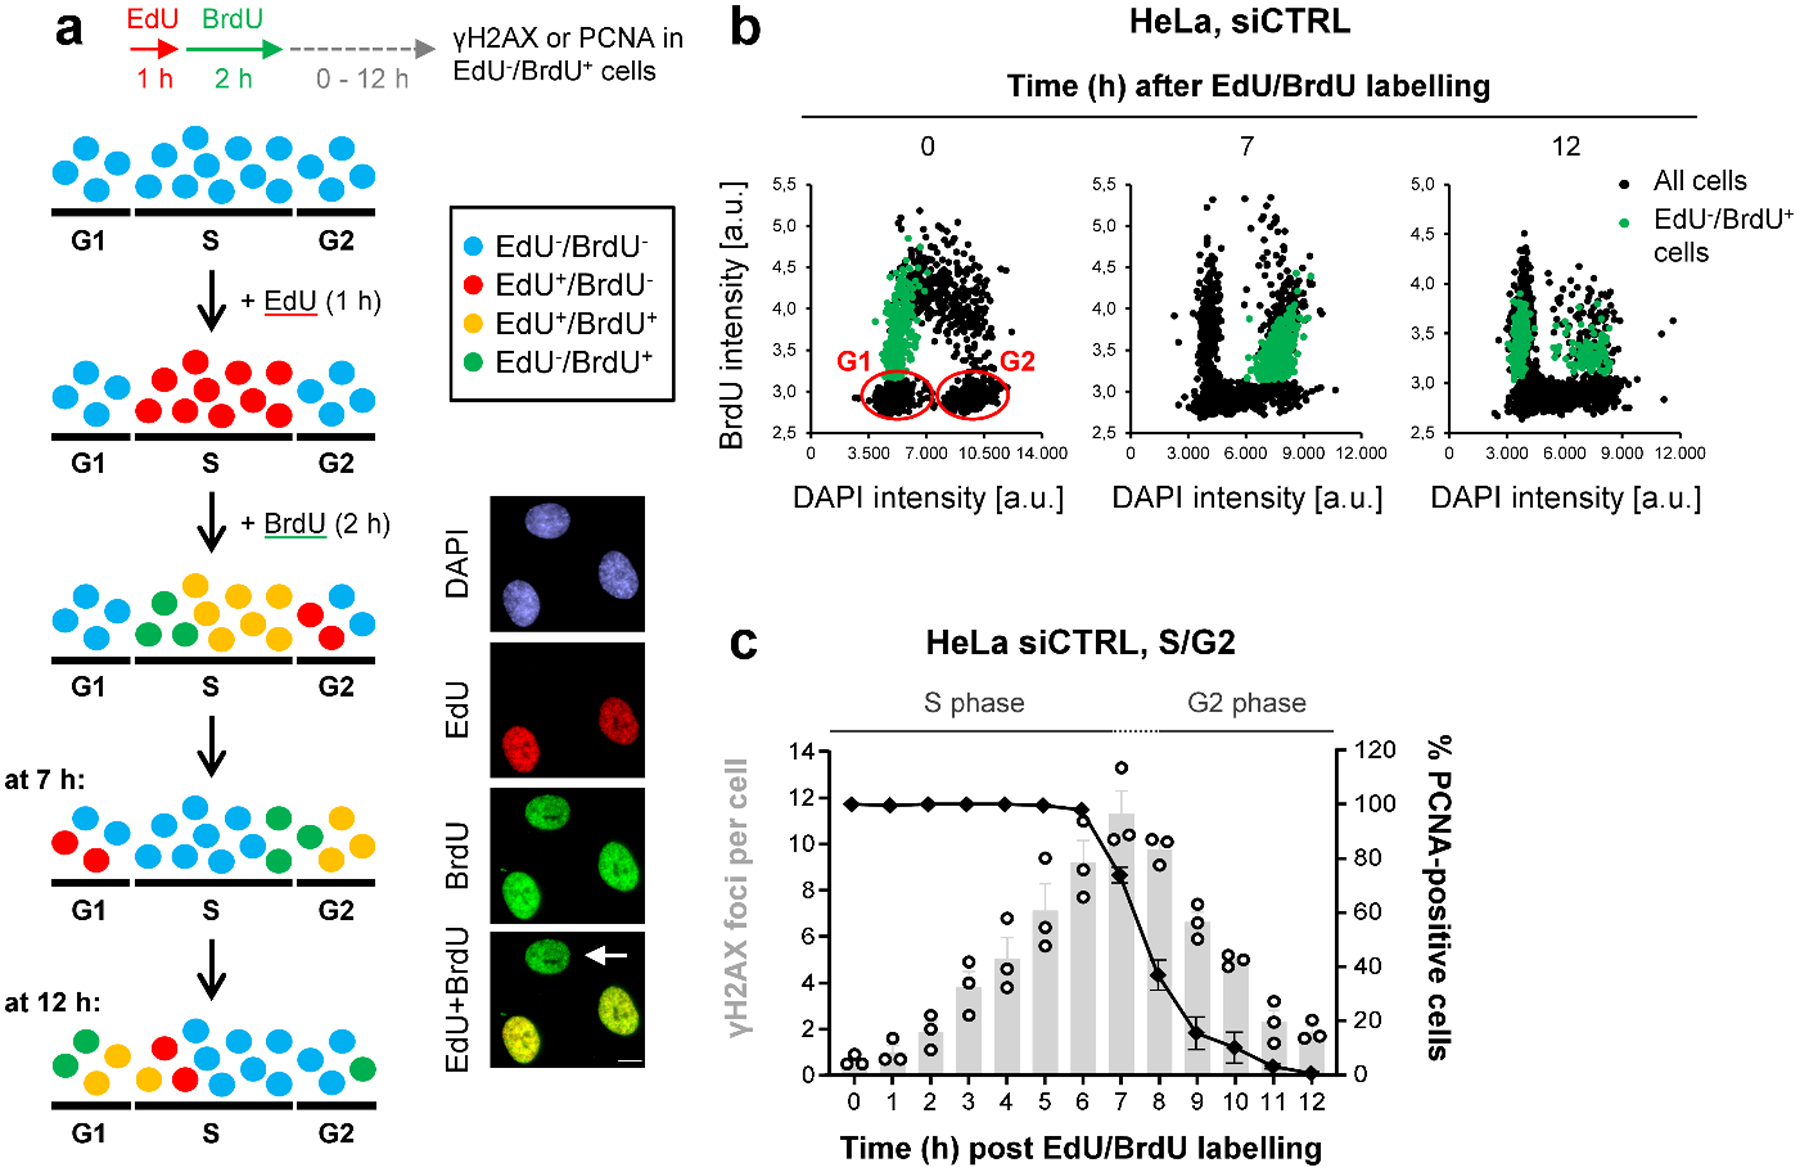
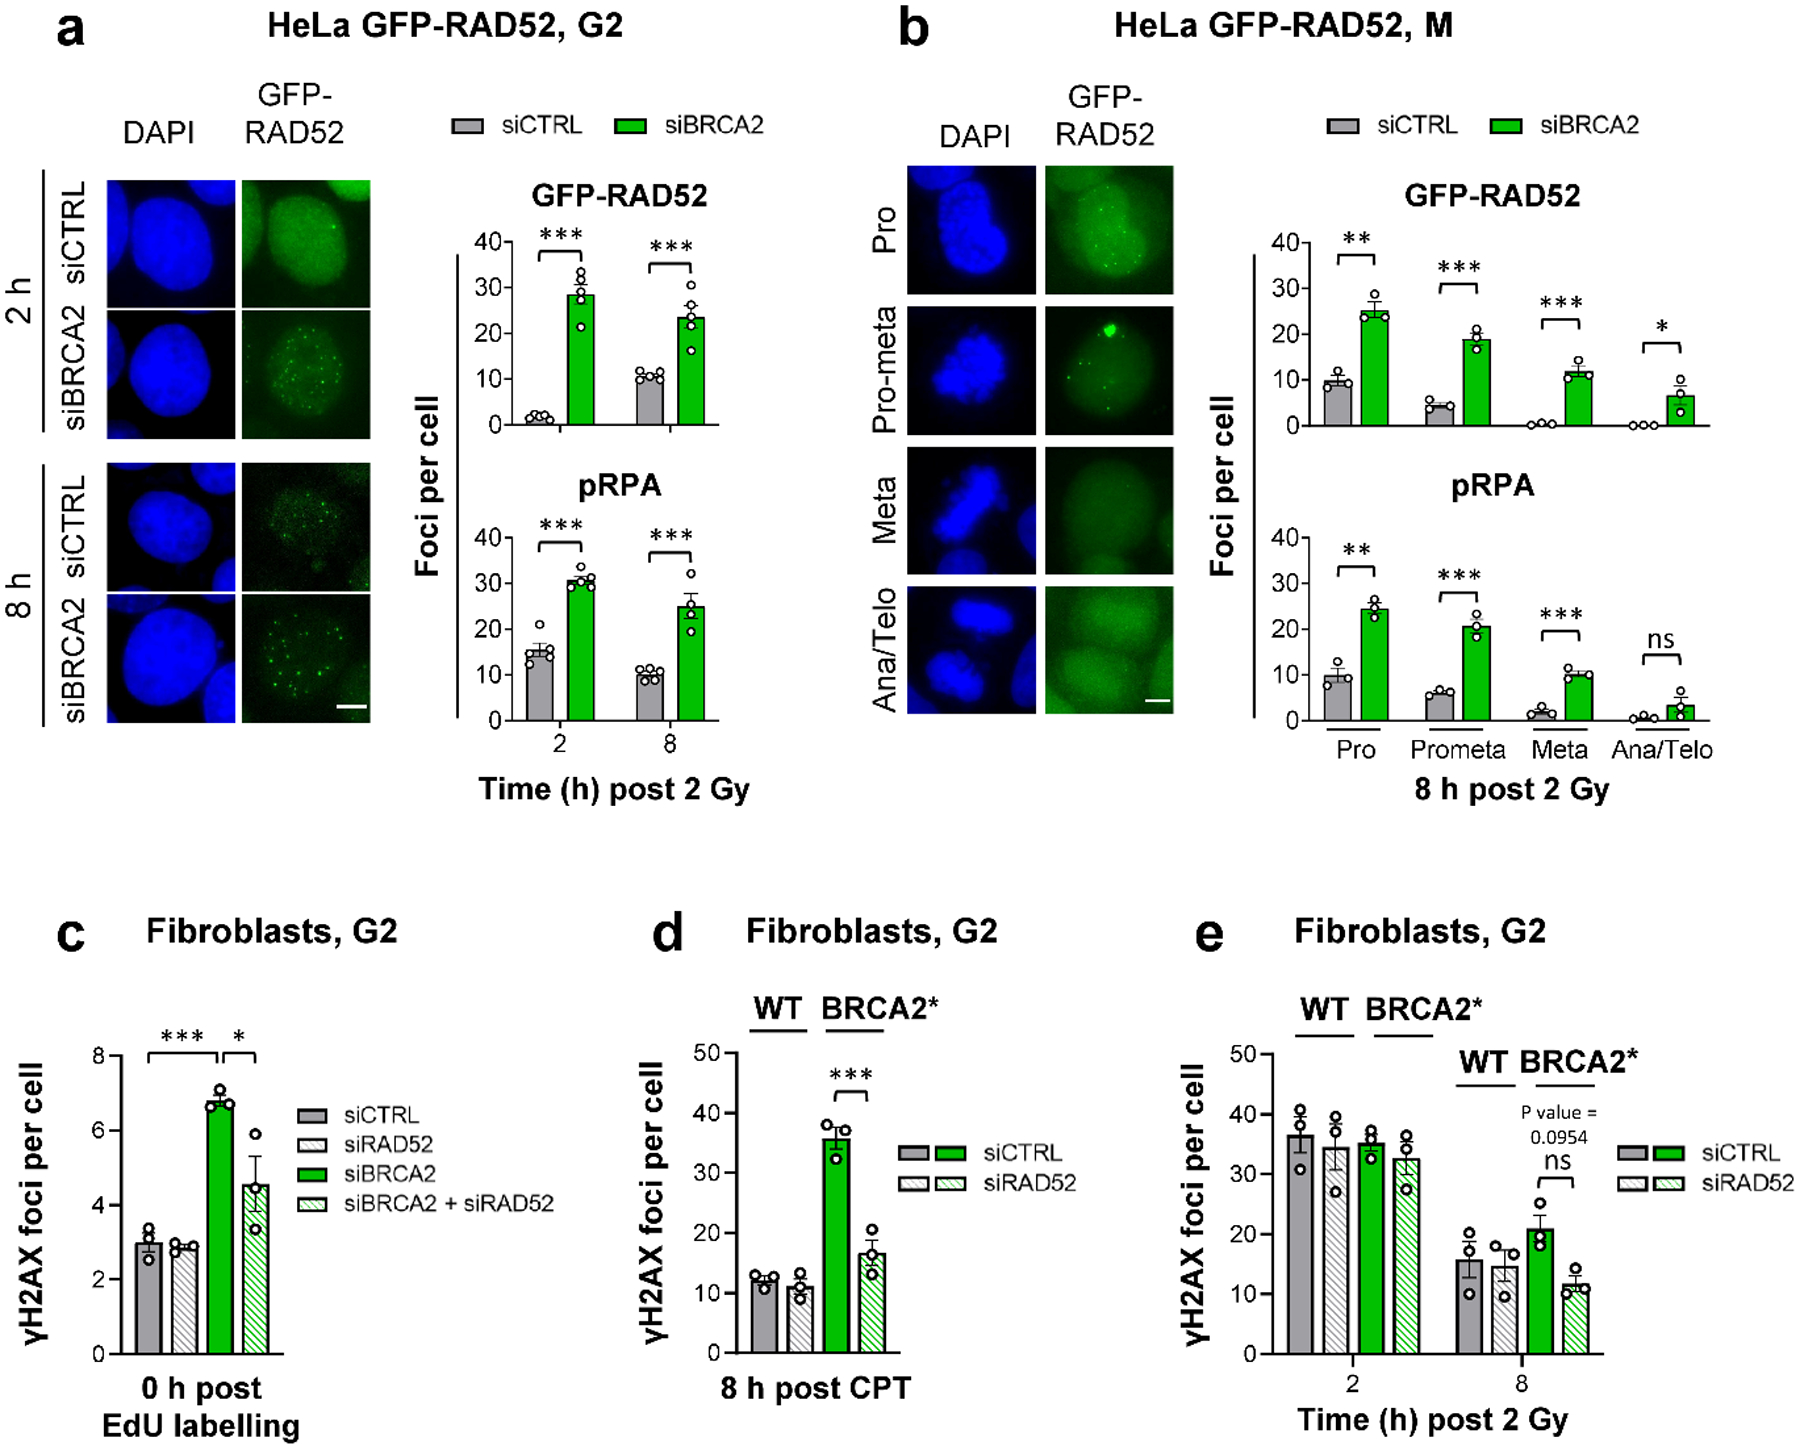
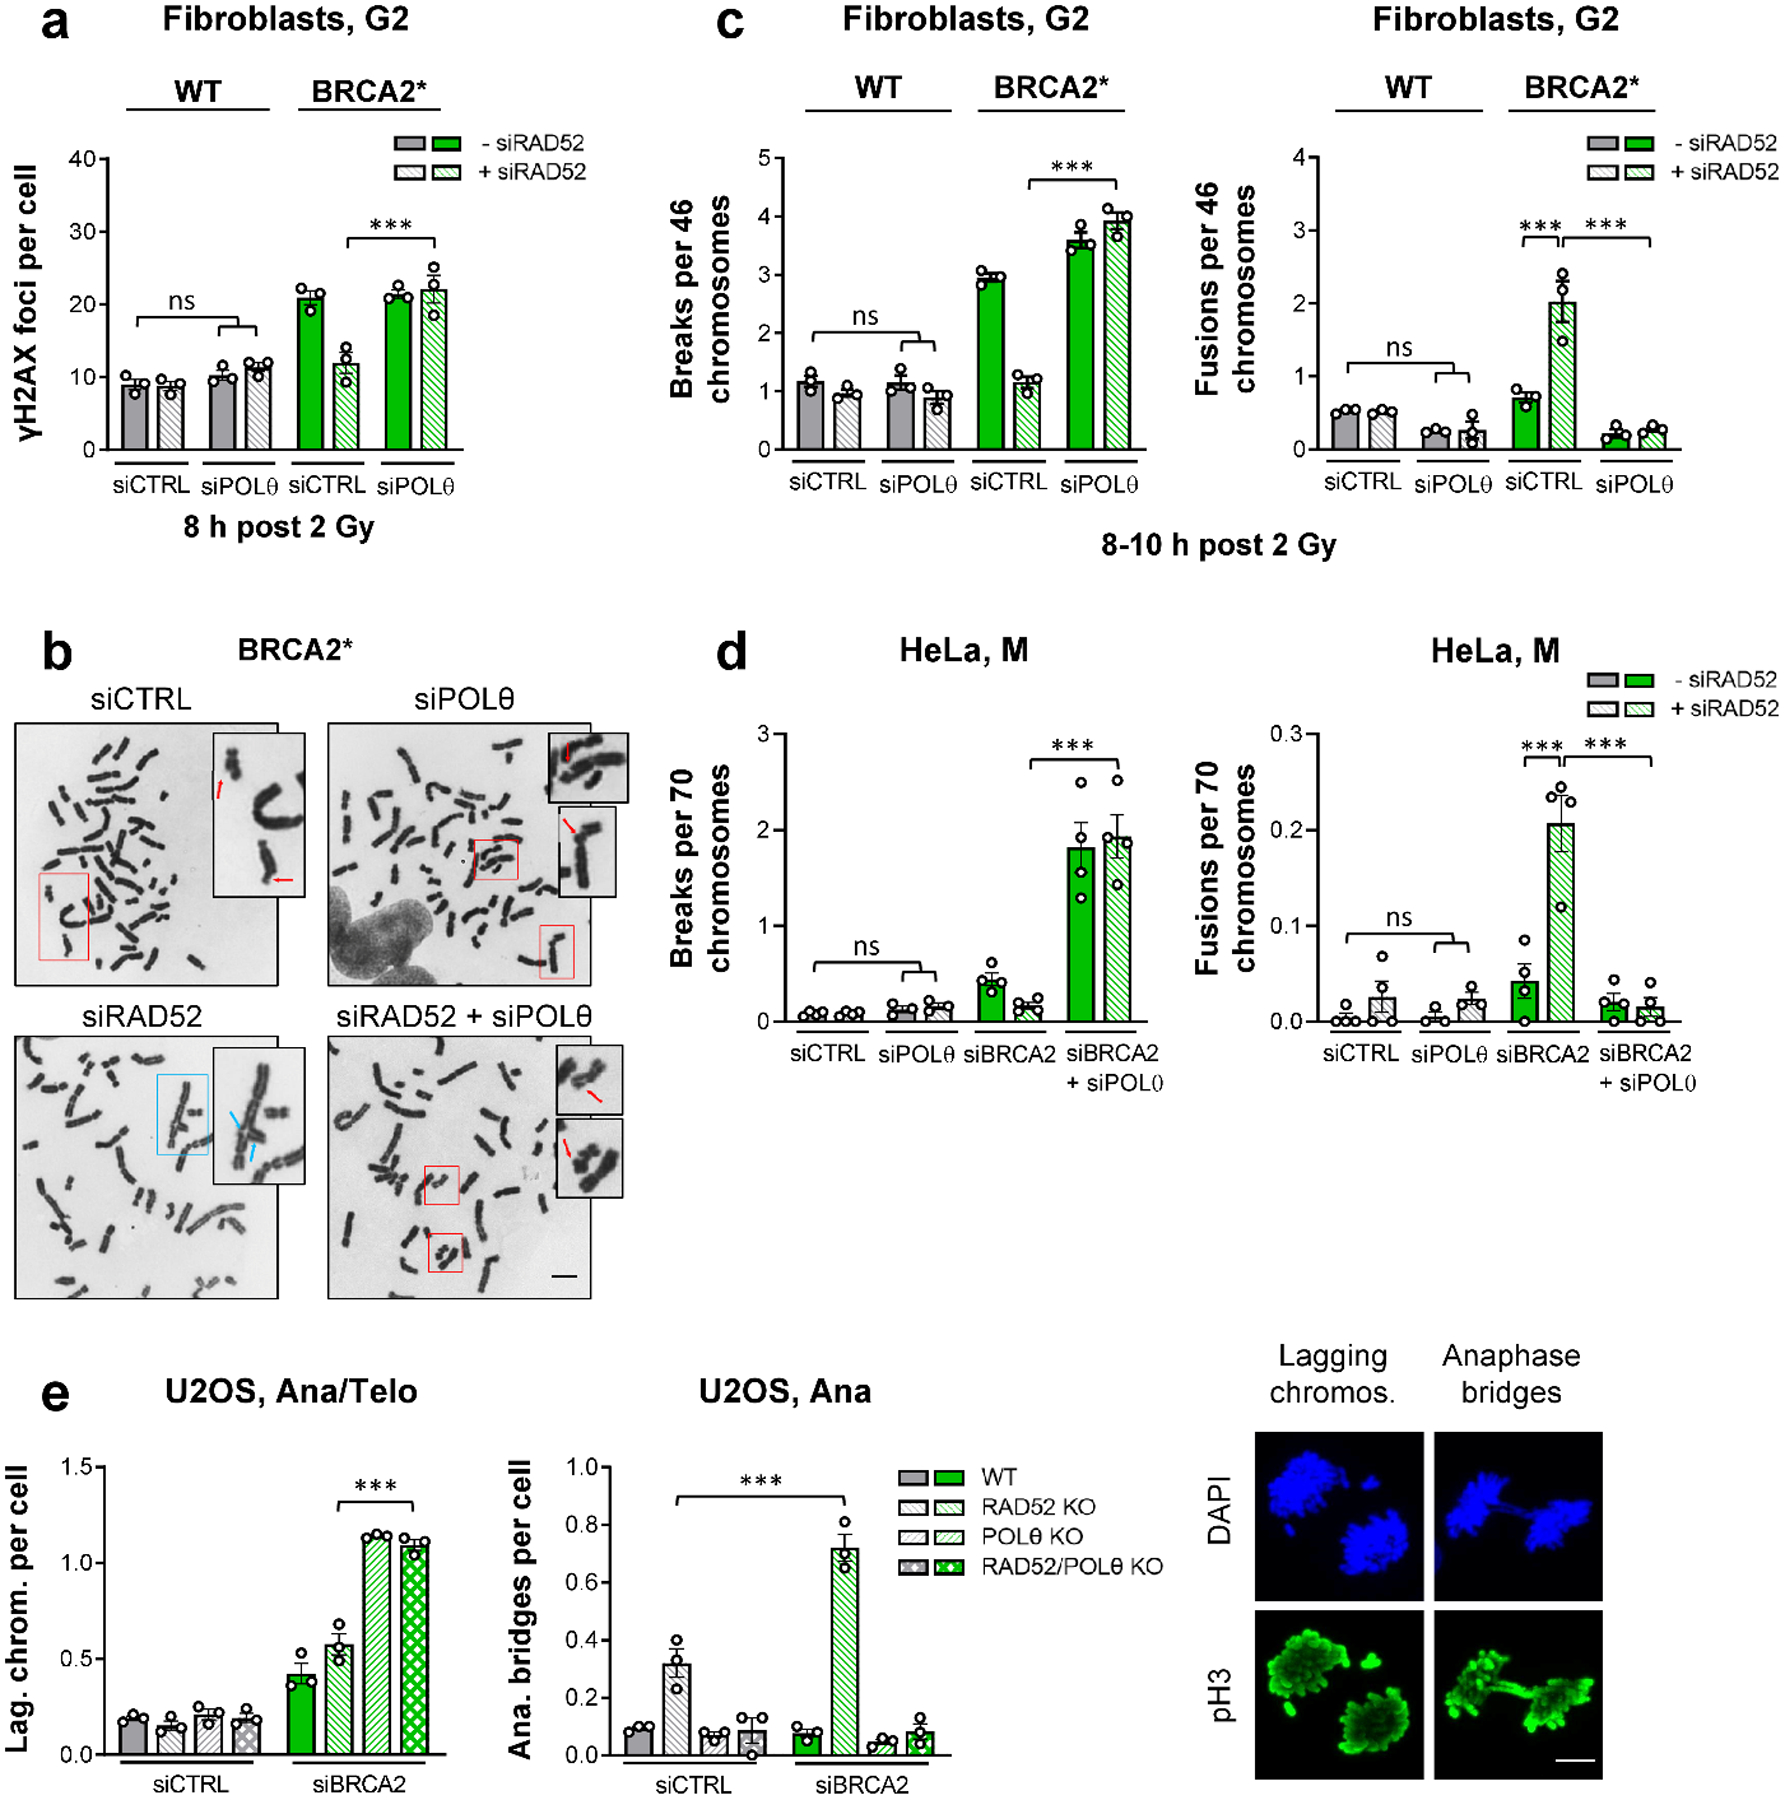
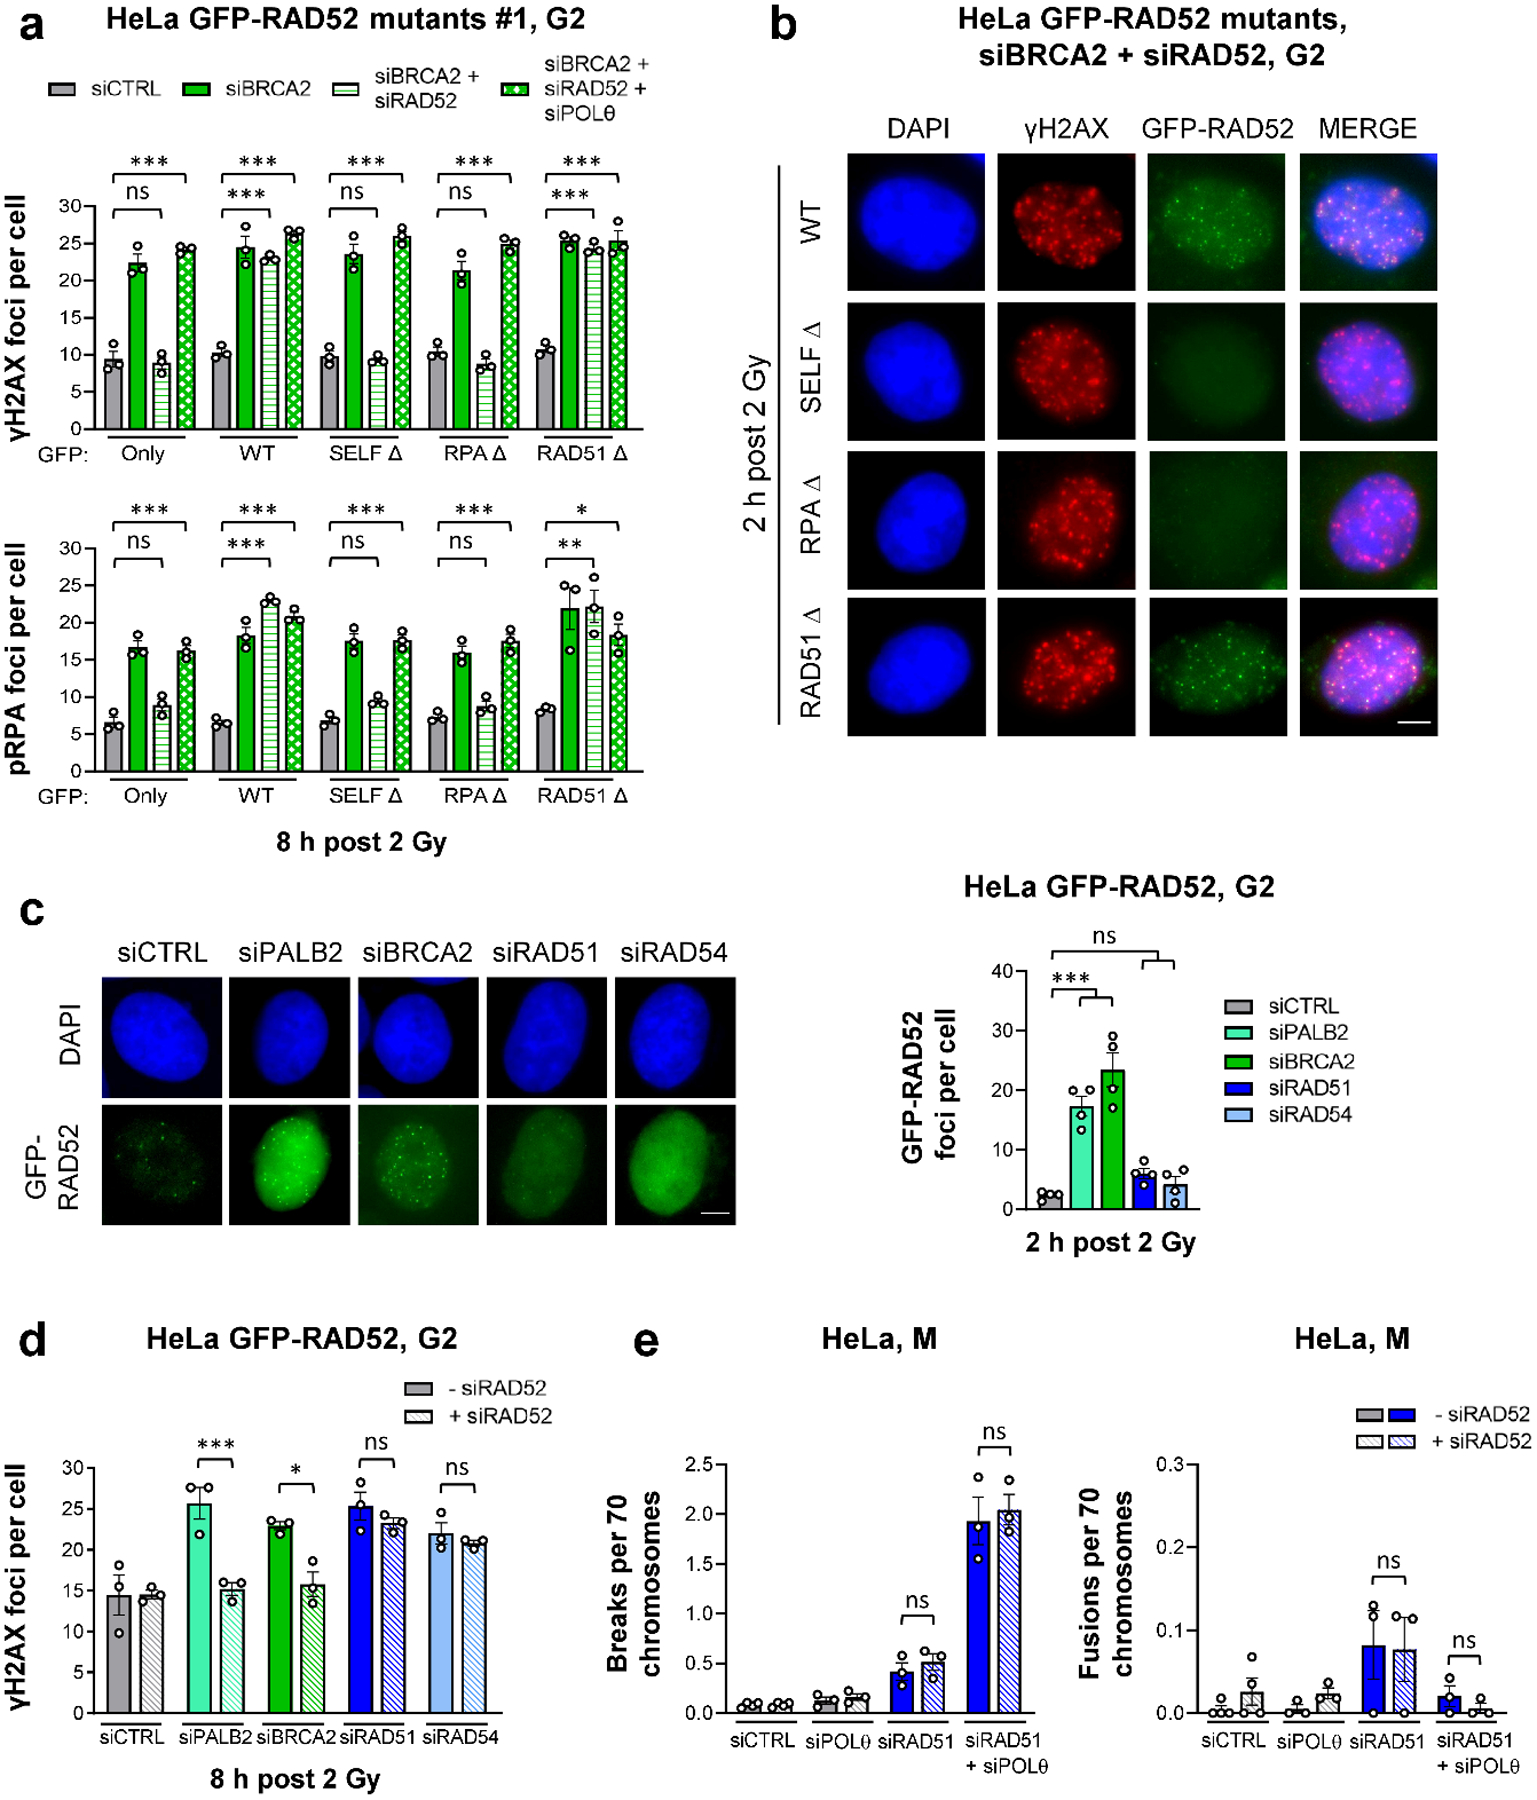
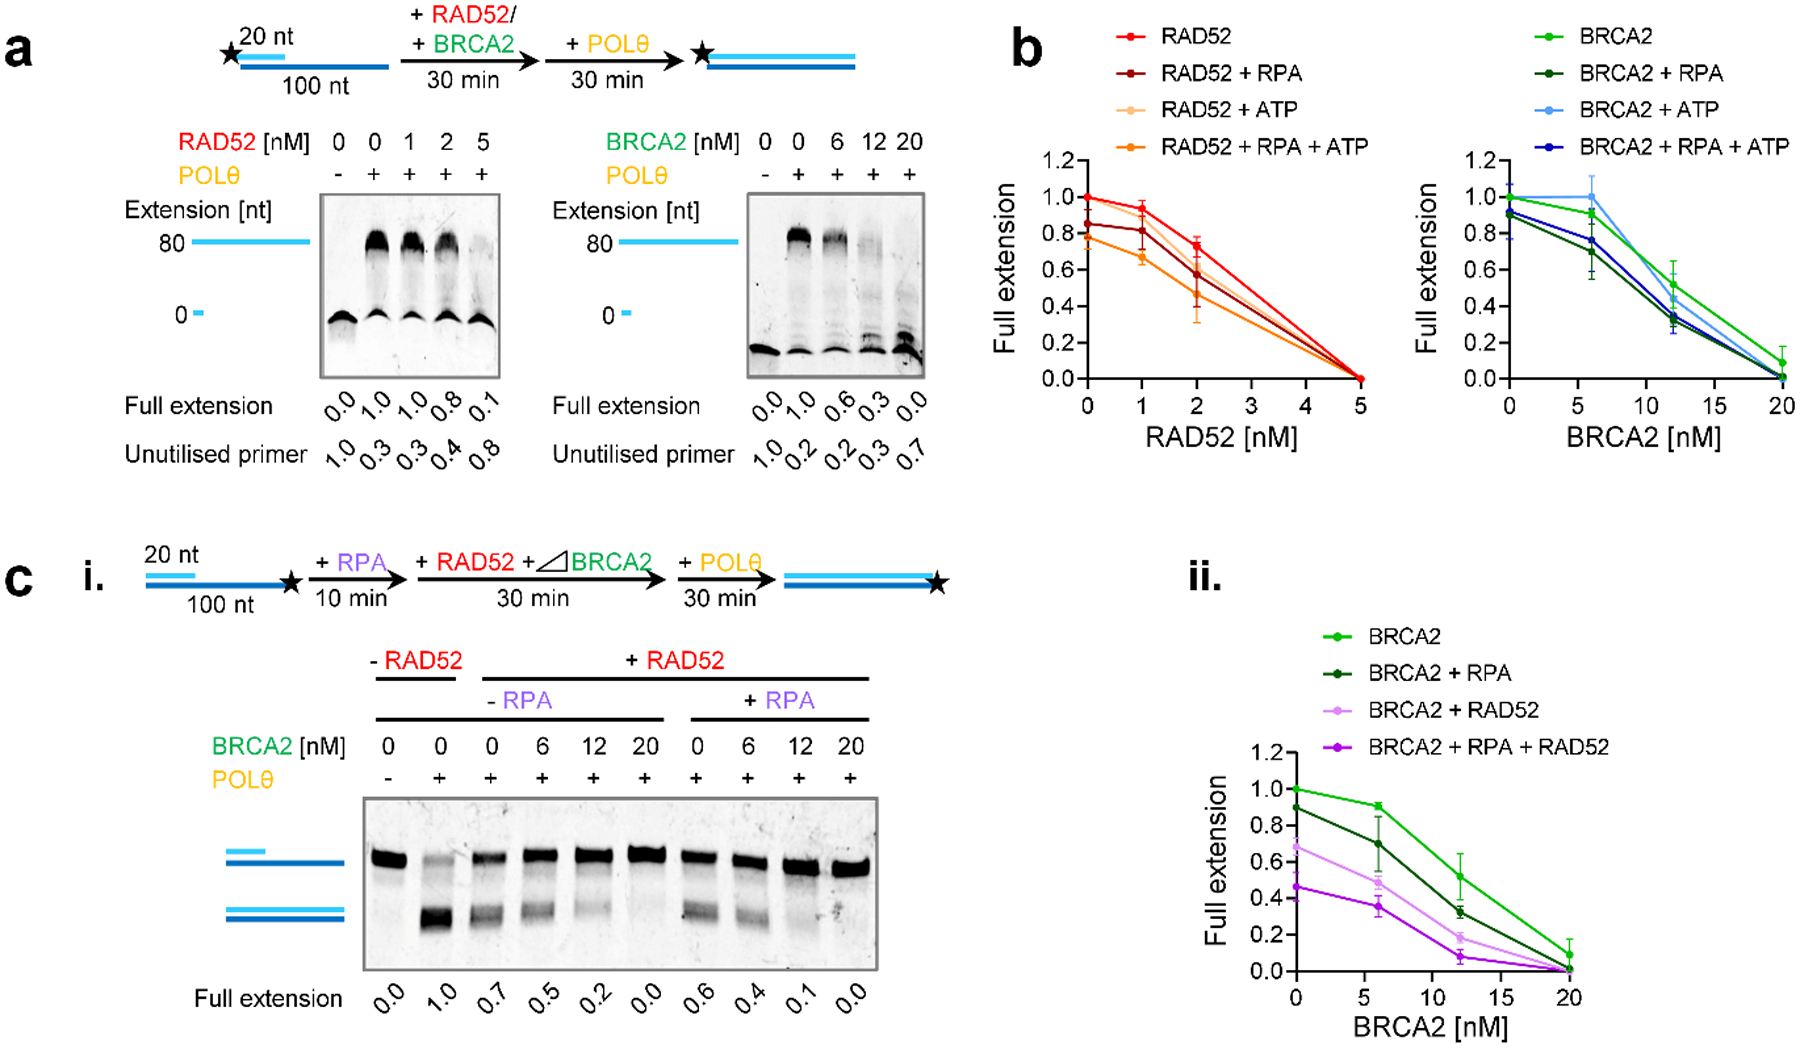
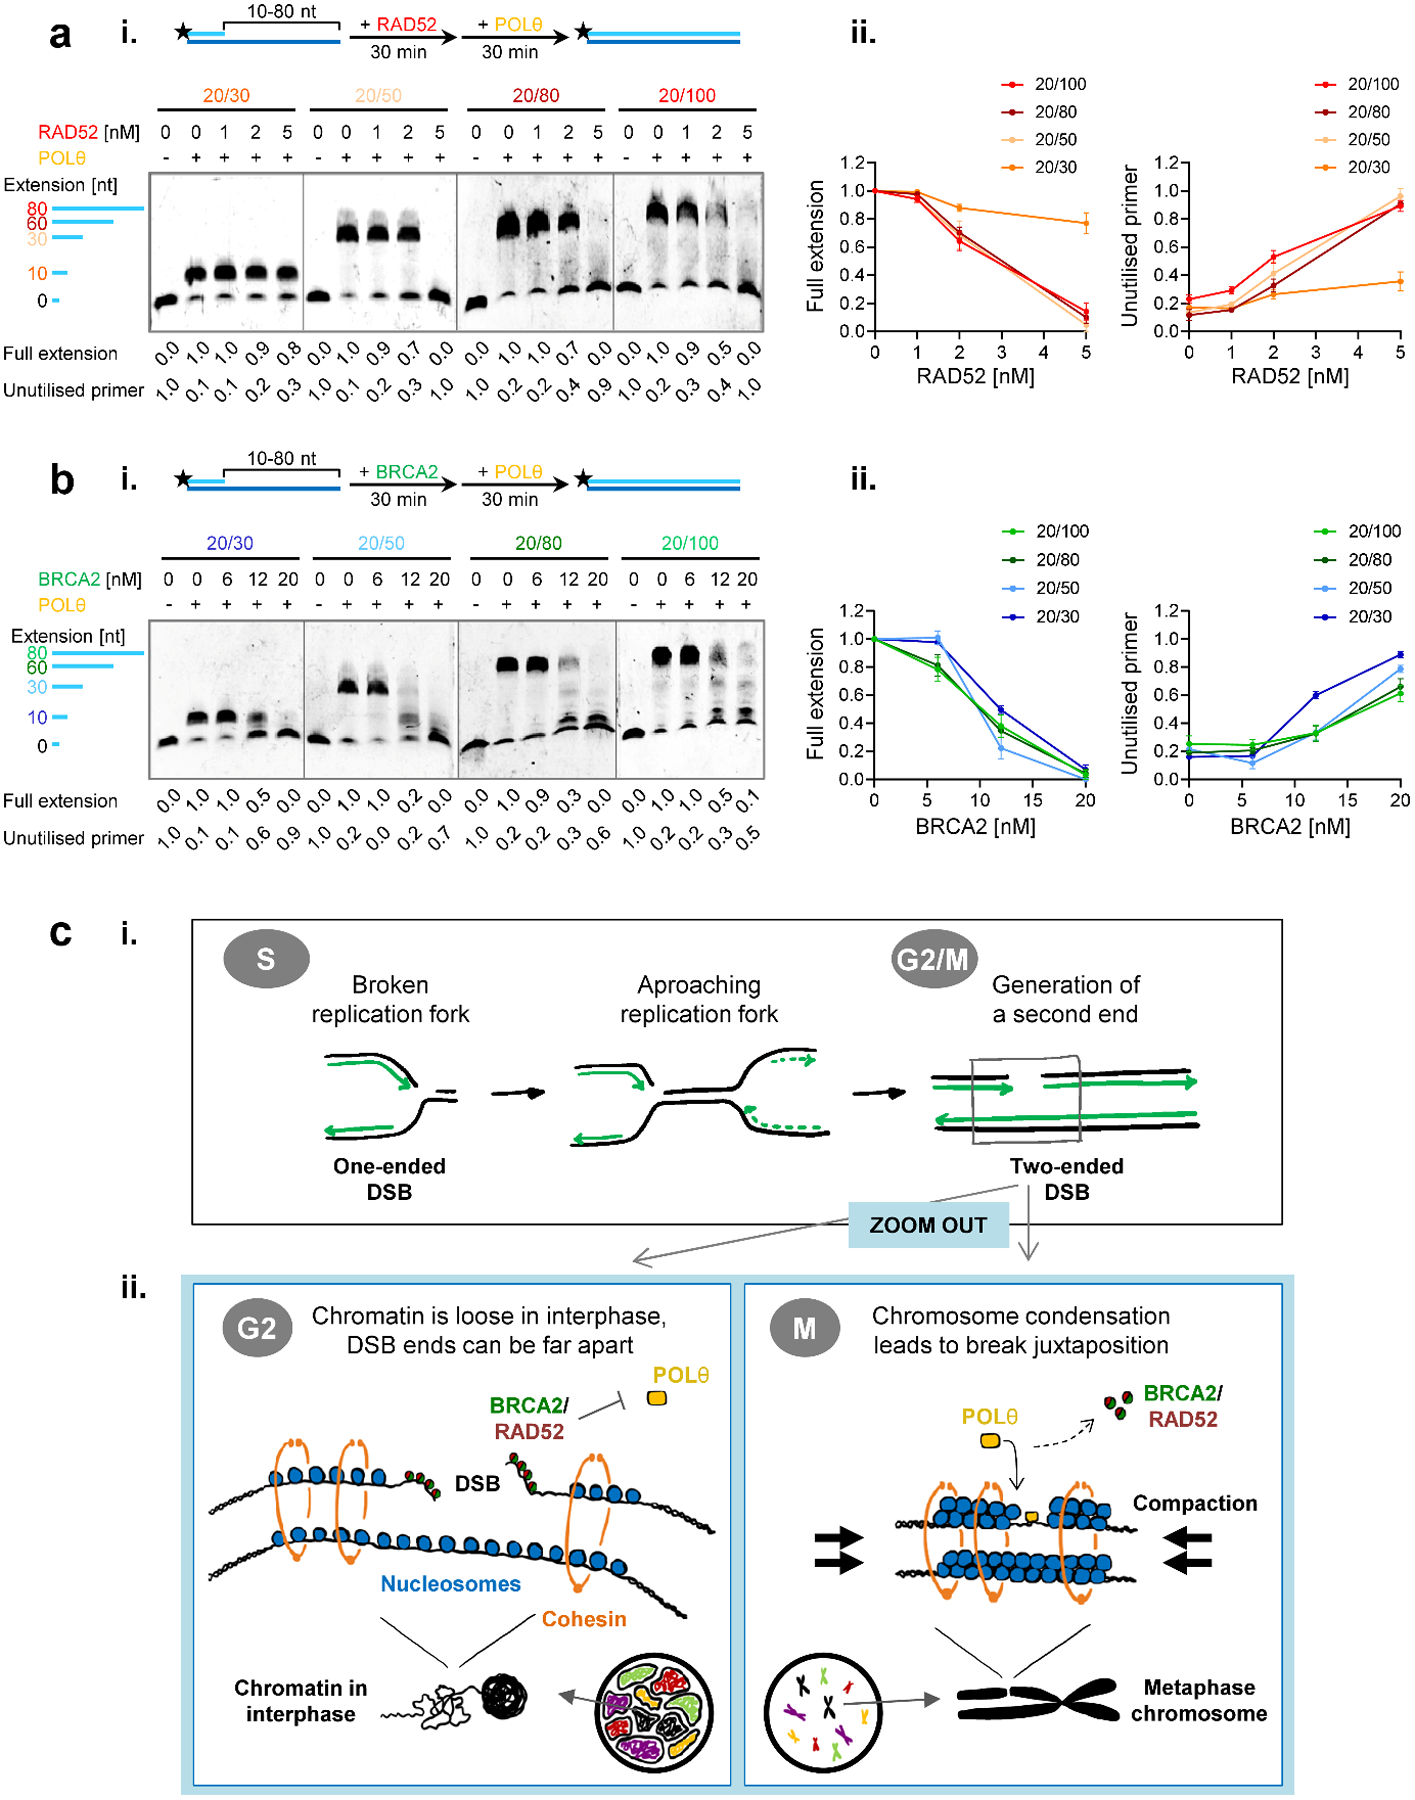
BRCA2-mutant cells are defective in homologous recombination, making them vulnerable to the inactivation of other pathways for the repair of DNA double-strand breaks (DSBs). This concept can be clinically exploited but is currently limited due to insufficient knowledge about how DSBs are repaired in the absence of BRCA2. We show that DNA polymerase θ (POLθ)-mediated end joining (TMEJ) repairs DSBs arising during the S phase in BRCA2-deficient cells only after the onset of the ensuing mitosis. This process is regulated by RAD52, whose loss causes the premature usage of TMEJ and the formation of chromosomal fusions. Purified RAD52 and BRCA2 proteins both block the DNA polymerase function of POLθ, suggesting a mechanism explaining their synthetic lethal relationships. We propose that the delay of TMEJ until mitosis ensures the conversion of originally one-ended DSBs into two-ended DSBs. Mitotic chromatin condensation might further serve to juxtapose correct break ends and limit chromosomal fusions.


Conflict of interest statement

Competing interests

The authors declare no competing interests.

Figures

Figure 1 |
Figure 1 |. The formation and repair of spontaneous DSBs throughout the cell cycle.
a, Schematic showing the strategy to analyse spontaneous γH2AX foci during the cell cycle. Cells were labelled with EdU for 1 h and then with BrdU for 2 h (see example immunofluorescence (IF) images, scale bar, 10 μm). After BrdU removal, EdUBrdU+ cells (indicated by the white arrow) are in early S and move to late S and early G2 7 h later. At 12 h after labelling, EdUBrdU+ cells are in late G2 and early G1. b, Cell cycle progression of HeLa cells. The cells were labelled as in (a) and analysed at the indicated time points. The dot blots, obtained by microscopic scanning, show BrdU versus DAPI intensities, allowing for the discrimination of the different cell cycle phases. At the 0 h time point, S phase cells appear as BrdU+, whilst BrdU G1 and G2 cells can be distinguished according to their DAPI content (low or high, respectively, indicated in blue). In particular, with this labelling strategy, we could follow the progression of EdUBrdU+ cells (indicated in green) from early S (0 h) into late S/G2 (7 h) and G2/G1 phase (12 h). c, Spontanous γH2AX and PCNA kinetics in S/G2 HeLa cells. Cells were labelled as in (a) and EdUBrdU+ cells were analysed at various time points after labelling. Foci numbers (in grey) increase during S and decrease during G2 phase. The transition between S and G2 phase (~7–8 h after labelling) was monitored by chromatin-bound PCNA staining (in black) in parallel experiments (n=3 independent experiments). At later times (>10 h after labelling), cells start entering G1 phaseand these were excluded from the foci analysis. The data show the mean ± SEM. Individual experiments, each derived from 40 cells, are shown as dots. Source data are available online.
Figure 2 |
Figure 2 |. TMEJ in HR-deficient cells is delayed until mitosis.
a, Spontaneous γH2AX foci in S/G2 HeLa cells. Cells were transfected with siRNAs, labelled as in Fig. 1a and EdUBrdU+ cells were analysed in S/G2 (7 h) and G2 (12 h after labelling) (n=3 independent experiments, except siCTRL/siPOLθ/siBRCA2/siBRCA2+siPOLθ at 12 h: n=4 independent experiments). b, Spontaneous γH2AX foci in G1 HeLa cells. Cells were transfected with siRNAs, labelled as in Fig. 1a and EdUBrdU+ cells were analysed in G1 (12 h after labelling) (n=4 independent experiments, except siRAD51/siRAD51+siPOLθ: n=3 independent experiments). c, Alternative representation of the data in (b). The percentage of G1 cells showing 0–9 spontaneous γH2AX foci is represented. Raw data was combined from the experiments in (b) and in total from ≥ 300 individual cells. d, Spontaneous γH2AX foci in mitotic HeLa cells. Cells were transfected with siRNAs. Mitotic stages were identified by the cell morphology seen in the DAPI and phospho-histone H3(S10) (pH3) staining (see example IF images in the left panel, scale bar, 5 μm) (n=4 independent experiments). All data show the mean ± SEM. Individual experiments, each derived from 40 (S/G2 and M) or 100 cells (G1), are shown as dots. **: P < 0.01; ***: P < 0.001, ns: non-significant (One-way ANOVA). The exact P values are provided as source data. Source data are available online.
Figure 3 |
Figure 3 |. RAD52 locates to resected DSBs to prevent their repair in G2-phase BRCA2 mutants.
a, GFP-RAD52 and pRPA foci in G2 HeLa GFP-RAD52 cells. Cells stably expressing GFP-RAD52 (see Extended Data Fig. 3a) were transfected with siRNAs, labelled with EdU, irradiated with 2 Gy X-rays and EdU G2 cells were analysed (see example IF images in the left panel, scale bar, 5 μm) (n=5 independent experiments, except pRPA for siBRCA2 at 8 h: n=4 independent experiments). b, GFP-RAD52 and pRPA foci in mitotic HeLa GFP-RAD52 cells. Experiments were done as in (a). EdU mitotic cells were identified by their morphology seen in the DAPI staining (see example IF images in the left panel obtained from siCTRL-treated samples, scale bar, 5 μm) (n=3 independent experiments). c, Spontaneous γH2AX foci in G2 fibroblasts. 82–6 hTERT (WT) cells were transfected with siRNAs, labelled with EdU for 1 h and foci were immediately analysed after labelling in EdU cells in G2. The specificity of the RAD52 siRNA was shown with siRNA resistant GFP-RAD52 HeLa cells (see Fig. 5a and Extended Data Fig. 7c) (n=3 independent experiments). d, γH2AX foci after CPT treatment in G2 fibroblasts. 82–6 hTERT (WT) and HSC-62 hTERT (BRCA2 mutant: BRCA2*) cells were transfected with siRNAs, treated with EdU and 20 nM CPT for 1 h. EdU+ cells were in S during the CPT treatment and progressed to G2 after 8 h. Foci were analysed in this population (n=3 independent experiments). e, γH2AX foci after IR in G2 fibroblasts. WT and BRCA2* cells were transfected with siRNAs, labelled with EdU and irradiated with 2 Gy X-rays. EdU G2 cells were analysed (n=3 independent experiments). All data show the mean ± SEM. Individual experiments, each derived from 40 (G2) or 20 cells (M), are shown as dots. *: P < 0.05; **: P < 0.01; ***: P < 0.001, ns: non-significant (One-way ANOVA, except for the data in (a,b), where an unpaired two-tailed t-test was used). The exact P values are provided as source data. Source data are available online.
Figure 4 |
Figure 4 |. RAD52 prevents the premature usage of TMEJ in BRCA2 mutants.
a, γH2AX foci after IR in G2 fibroblasts. WT and BRCA2* cells were transfected with siRNAs, labelled with EdU, irradiated with 2 Gy X-rays and EdU G2 cells were analysed (n=3 independent experiments). b, Examples of chromatid breaks (red arrows) and fusions (blue arrows) in BRCA2* cells after IR (scale bar, 5 μm). c, Chromatid breaks and fusions after IR in G2 fibroblasts. WT and BRCA2* cells were transfected with siRNAs and irradiated with 2 Gy X-rays. Chromosome spreads were obtained by premature chromosome condensation (PCC) 8–10 h post IR. Chromatid breaks and fusions were quantified per spread and normalised to 46 chromosomes (n=3 independent experiments). d, Spontaneous chromatid breaks and fusions in mitotic HeLa cells. Cells were transfected with siRNAs and mitotic spreads were prepared and analysed for the presence of aberrations. Chromatid breaks and fusions were quantified per spread and normalised to 70 chromosomes (n=4 independent experiments, except siPOLθ/siPOLθ+siRAD52: n=3 independent experiments). e, Spontaneous lagging chromosomes and anaphase bridges in mitotic U2OS cells. U2OS WT and KO cells were transfected with siRNAs and ana/telophase cells were analysed for the presence of lagging chromosomes and anaphase bridges. Cells were identified by their morphology seen in the DAPI and phospho-histone H3(S10) (pH3) stainings. Examples of lagging chromosomes are shown for the POLθ KO, while examples of anaphase bridges are illustrated for the RAD52 KO, both treated with siBRCA2 (scale bar, 5 μm) (n=3 independent experiments). All data show the mean ± SEM. Individual experiments, each derived from 40 (G2 foci and anaphase bridges), 80 (lagging chromosomes), 30 (G2 spreads) or 60 cells (M spreads), are shown as dots. ***: P < 0.001, ns: non-significant (One-way ANOVA). The exact P values are provided as source data. Source data are available online.
Figure 5 |
Figure 5 |. RAD52 and BRCA2 both suppress TMEJ.
a, γH2AX and pRPA foci in G2 HeLa cells stably expressing different GFP-RAD52 constructs (shown in Extended Data Fig. 7). Two independent clones for each mutant were used: Clone #1 is shown here, while Clone #2 is shown in Extended Data Fig. 7c. Cells were transfected with siRNAs, labelled with EdU, irradiated with 2 Gy X-rays and EdUGFP+ cells in G2 were analysed (n=3 independent experiments). b, Example IF images of γH2AX and GFP-RAD52 foci for G2 HeLa cells carrying different GFP-RAD52 constructs. Cells were transfected with siRNAs, labelled with EdU, irradiated with 2 Gy X-rays and EdUGFP+ G2 cells were analysed (scale bar, 5 μM). c, GFP-RAD52 foci in G2 HeLa GFP-RAD52 cells. Cells were transfected with siRNAs, labelled with EdU, irradiated with 2 Gy X-rays and EdUGFP+ G2 cells were analysed (see example IF images in the left panel, scale bar, 5 μm) (n=4 independent experiments). d, γH2AX foci in G2 HeLa GFP-RAD52 cells. Cells were transfected with siRNAs, labelled with EdU, irradiated with 2 Gy X-rays and EdU G2 cells were analysed (n=3 independent experiments). e, Spontaneous chromatid breaks and fusions in HeLa cells. Cells were transfected with siRNAs and mitotic spreads were prepared and analysed for the presence of aberrations. Chromatid breaks and fusions were quantified per spread and normalised to 70 chromosomes (n=3 independent experiments, except siCTRL/siRAD52: n=4 independent experiments). The data without siRAD51 are taken from Fig. 4d. All data show the mean ± SEM. Individual experiments, each derived from 40 (G2 foci) and 60 cells (M spreads), are shown as dots. *: P < 0.05; **: P < 0.01; ***: P < 0.001, ns: non-significant (One-way ANOVA). The exact P values are provided as source data. Source data are available online.
Figure 6 |
Figure 6 |. RAD52 and BRCA2 inhibit the polymerase function of POLθ.
a, Effect of RAD52 and BRCA2 on POLθ-mediated DNA synthesis. Titrations of RAD52 and BRCA2 in the primer extension reaction using the 80 nucleotide 5’-overhang substrate with the 5’-Cy5-labelled 20-mer analysed in denaturing gels. b, Effect of RAD52 and BRCA2 on POLθ-mediated DNA synthesis in the presence or absence of RPA and ATP. The line graphs show quantification of the representative non-denaturing gels shown in Extended Data Fig. 8e,f and additional gels (n=3 independent experiments). c, Effect of the combination of RAD52, BRCA2 and RPA on the polymerase function of POLθ. Titration of BRCA2 in the primer extension assay using the 80 nucleotide 5’-overhang substrate with the Cy5 labelling on 5’-end of the 100-mer ssDNA strand analysed in non-denaturing gels. BRCA2 was added together with 4 nM RPA and 2 nM RAD52 in the reaction. In (i) a representative gel is shown. (ii) The line graph shows quantification of gel in (i) and additional gels (n=3 independent experiments). The quantification is combined with experiments in (b) in the absence of ATP. All data show the mean ± SEM. The schemes of the reactions are shown in the diagrams at the top. Protein concentrations are indicated. Full extension product and unutilised primer values are normalised as described in the Methods section. Source data are available online.
Figure 7 |
Figure 7 |. RAD52 and BRCA2 inhibit POLθ DNA synthesis by distinct mechanisms.
a, Effect of RAD52 on POLθ-mediated DNA synthesis with varying length DNA substrates. (i) Titration of RAD52 in the primer extension reaction using the Cy5-labelled 5’-overhang substrates analised on denaturing gels. (ii) The line graphs show quantification of gels in (i) and additional gels (n=3 independent experiments). b, Effect of BRCA2 on POLθ-mediated DNA synthesis with varying length DNA substrates. (i) Titration of BRCA2 in the primer extension reaction using the Cy5-labelled 5’-overhang substrates analised on denaturing gels. (ii) The line graphs show quantification of gels in (i) and additional gels (n=3 independent experiments). All data show the mean ± SEM. The schemes of the reactions are shown in the diagrams at the top. Protein concentrations are indicated. Full extension product and unutilised primer values are normalised as described in the Methods section. Source data are available online. c, Model for the timely regulation of TMEJ by RAD52 and BRCA2. (i) In the absence of functional HR, a one-ended DSB arising during replication stays unrepaired and can be converted into a two-ended DSB by an approaching replication fork. Such DSBs can be repaired by an end-joining mechanism although the state of chromatin condensation is likely to influence the fidelity of the rejoining process. (ii) During G2, when chromatin consists of intertwined fibres organised in topologically associated domains, the two resected break ends of a two-ended DSB can be far apart, bearing the risk of chromatid fusion formation by connecting ends from different breaks. At this stage, breaks are protected by BRCA2 and/or RAD52. These proteins block access of POLθ to break ends and, thereby, prevent the toxic premature usage of TMEJ, which would result in cell death. In contrast, in M phase, chromosome condensation juxtaposes the correct DSB ends, preventing fusion formation. At this cell cycle stage, BRCA2 and RAD52 vacate the breaks and POLθ becomes essential to repair these lesions via TMEJ and, therefore, cell survival.

References

    1. Roy R, Chun J & Powell SN BRCA1 and BRCA2: Different roles in a common pathway of genome protection. Nat. Rev. Cancer 12, 68–78 (2012). - PMC - PubMed
    1. Prakash R, Zhang Y, Feng W & Jasin M Homologous recombination and human health: The roles of BRCA1, BRCA2, and associated proteins. Cold Spring Harb. Perspect. Biol 7, a01660 (2015). - PMC - PubMed
    1. Higgins GS & Boulton SJ Beyond PARP-POLθ as an anticancer target. Science 359, 1217–1218 (2018). - PubMed
    1. Ashworth A & Lord CJ Synthetic lethal therapies for cancer: what’s next after PARP inhibitors? Nat. Rev. Clin. Oncol 15, 564–576 (2018). - PubMed
    1. Jensen RB, Carreira A & Kowalczykowski SC Purified human BRCA2 stimulates RAD51-mediated recombination. Nature 467, 678–683 (2010). - PMC - PubMed

Publication types

MeSH terms

Substances