. 2021 Oct;23(10):1073-1084.
doi: 10.1038/s41556-021-00767-x. Epub 2021 Oct 6.

Cargo-specific recruitment in clathrin- and dynamin-independent endocytosis

Affiliations

Cargo-specific recruitment in clathrin- and dynamin-independent endocytosis

Paulina Moreno-Layseca et al. Nat Cell Biol. 2021 Oct.

Erratum in

  • Publisher Correction: Cargo-specific recruitment in clathrin- and dynamin-independent endocytosis.
    Moreno-Layseca P, Jäntti NZ, Godbole R, Sommer C, Jacquemet G, Al-Akhrass H, Conway JRW, Kronqvist P, Kallionpää RE, Oliveira-Ferrer L, Cervero P, Linder S, Aepfelbacher M, Zauber H, Rae J, Parton RG, Disanza A, Scita G, Mayor S, Selbach M, Veltel S, Ivaska J. Moreno-Layseca P, et al. Nat Cell Biol. 2022 Sep;24(9):1445. doi: 10.1038/s41556-022-00952-6. Nat Cell Biol. 2022. PMID: 36038735 Free PMC article. No abstract available.

Abstract

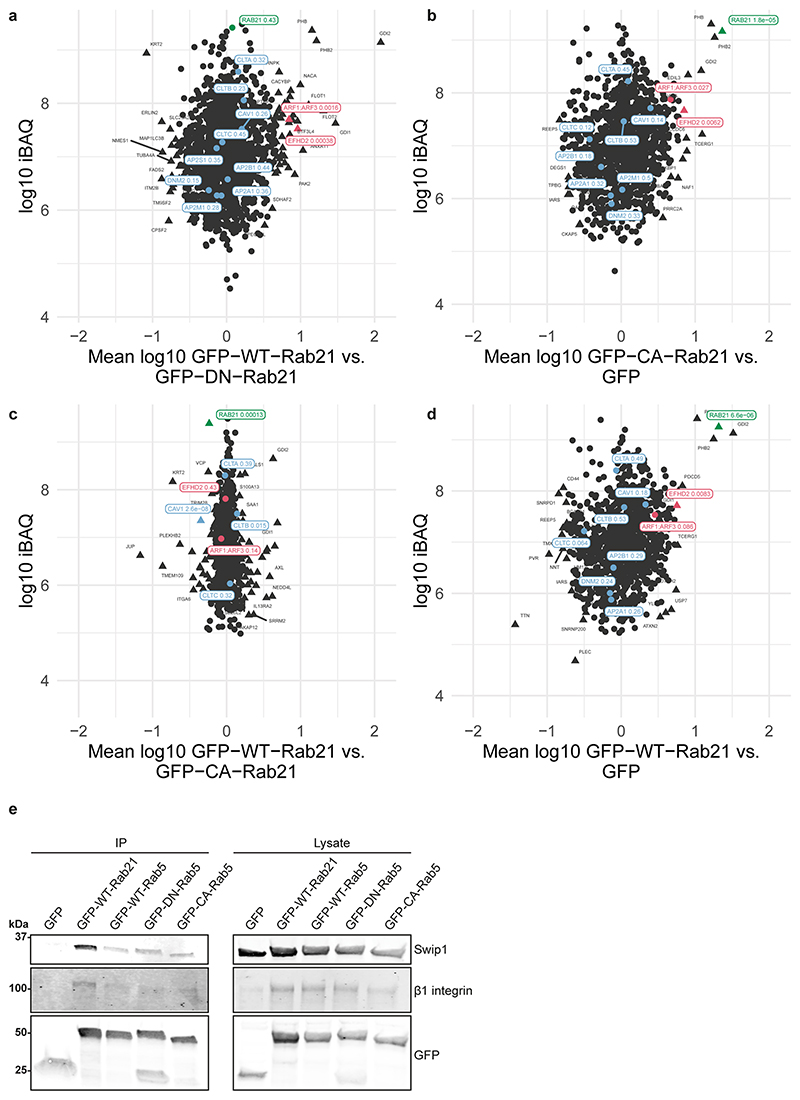
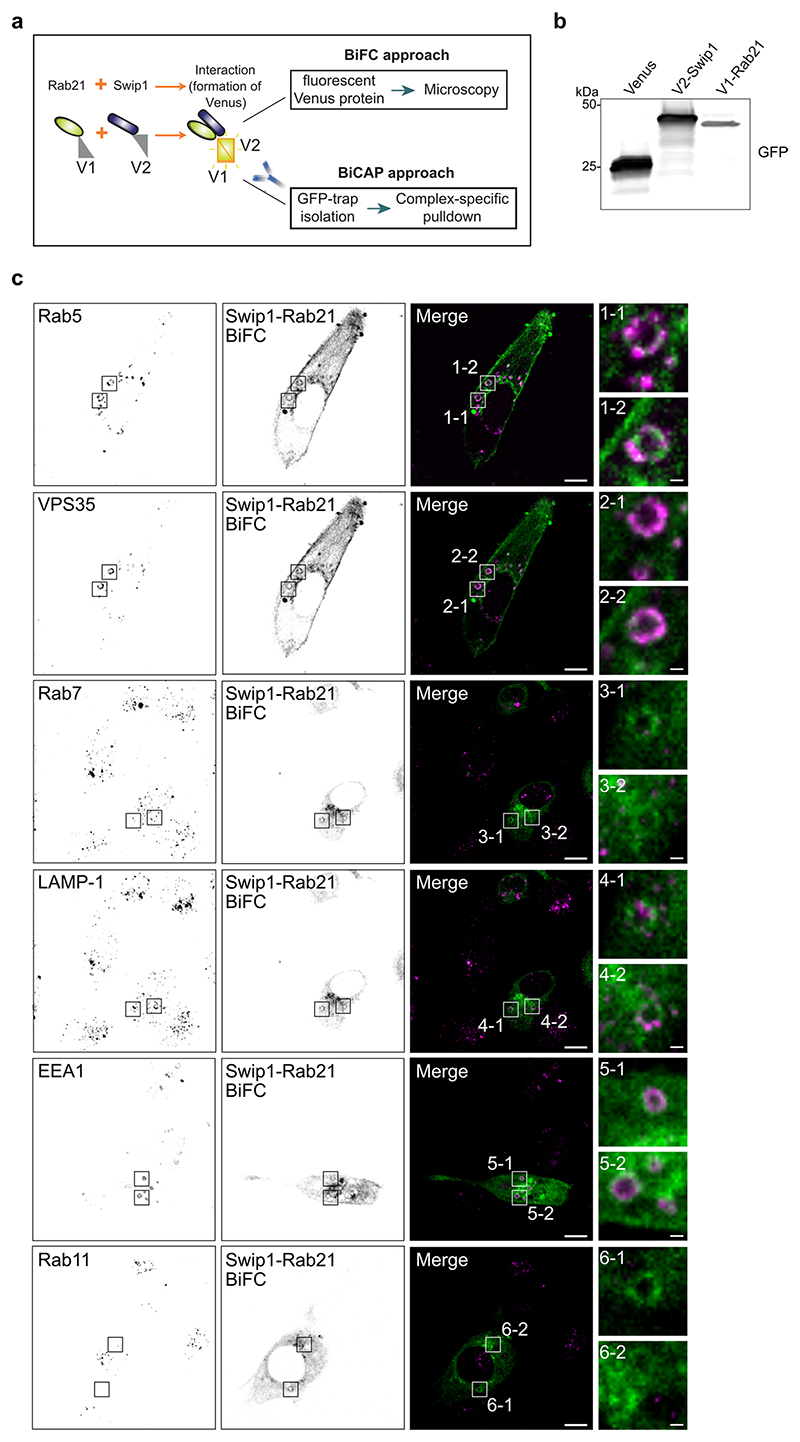
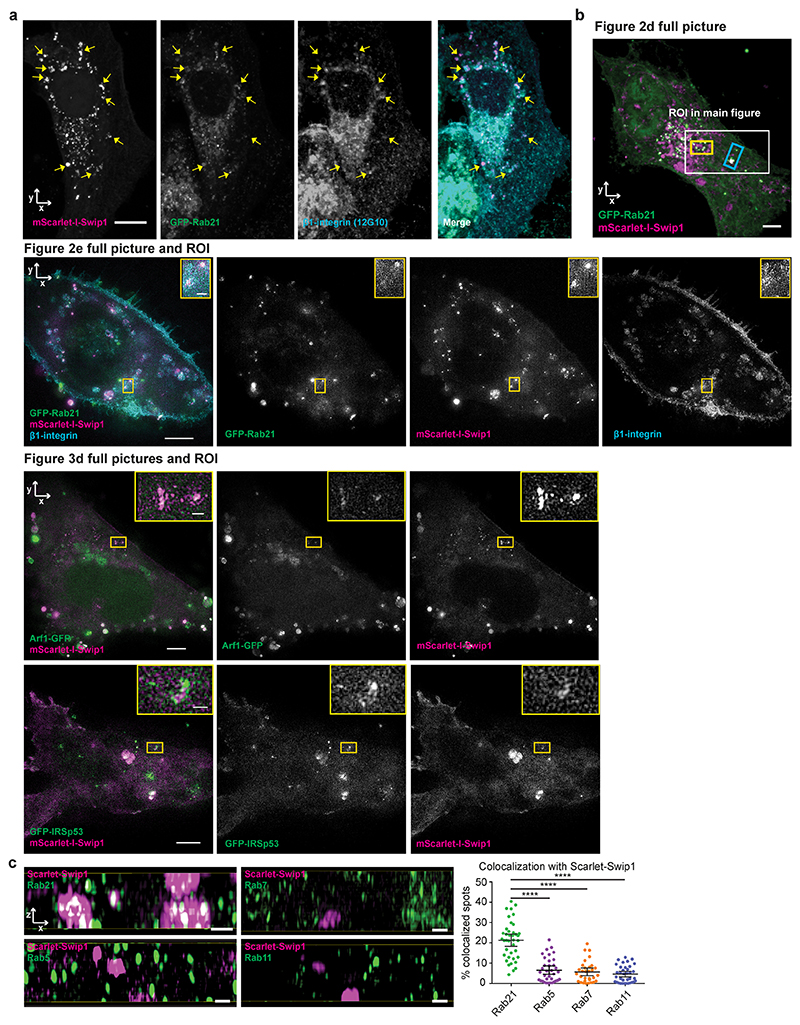
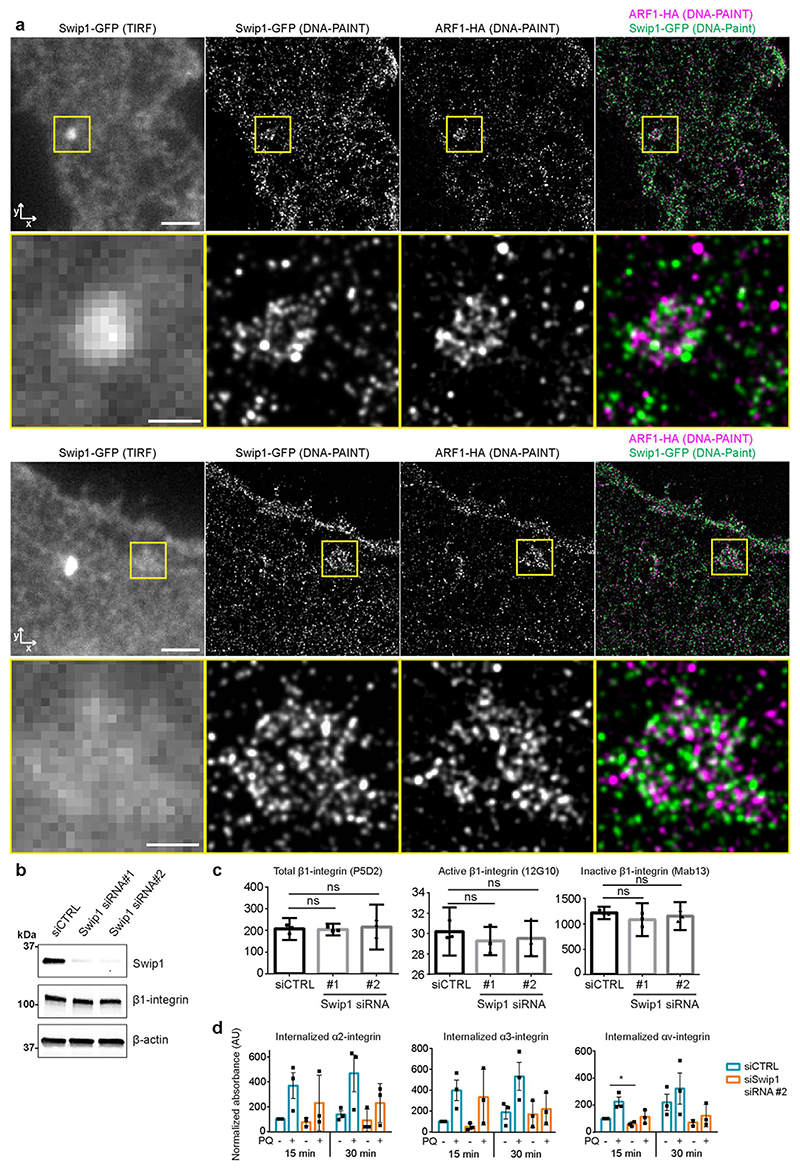
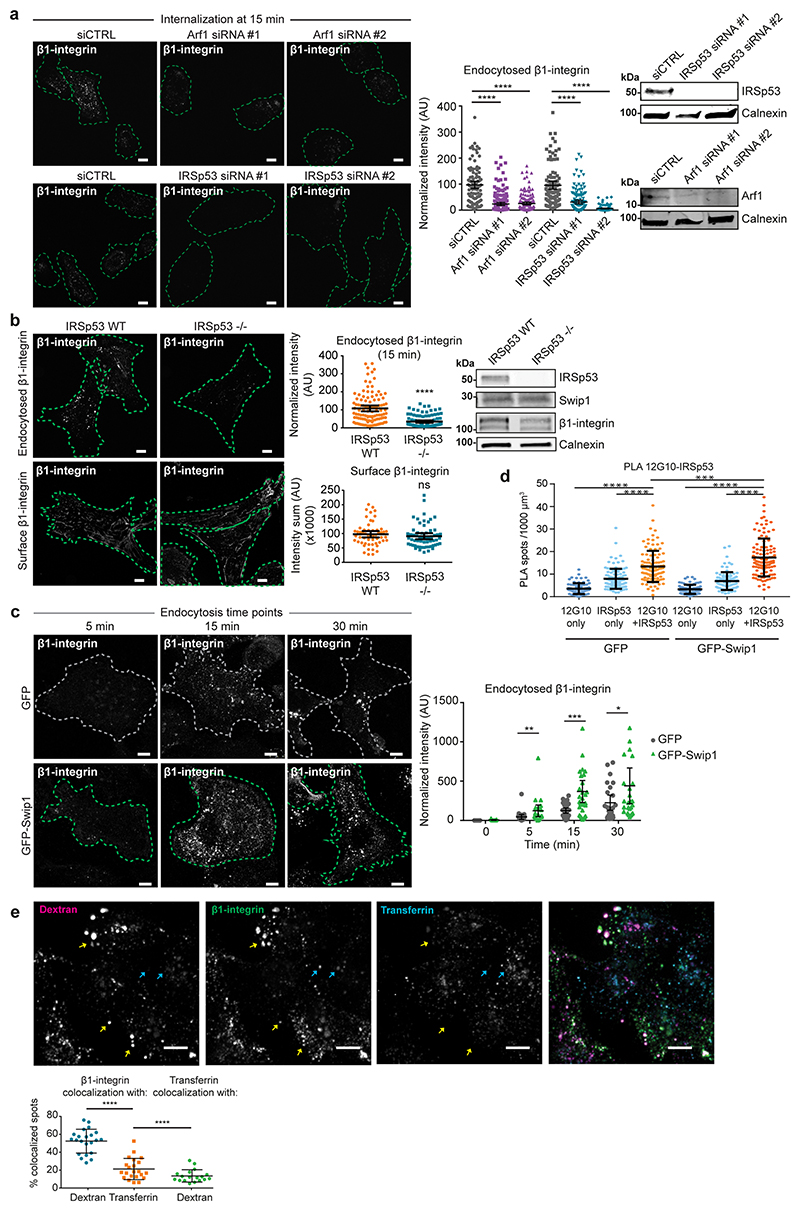
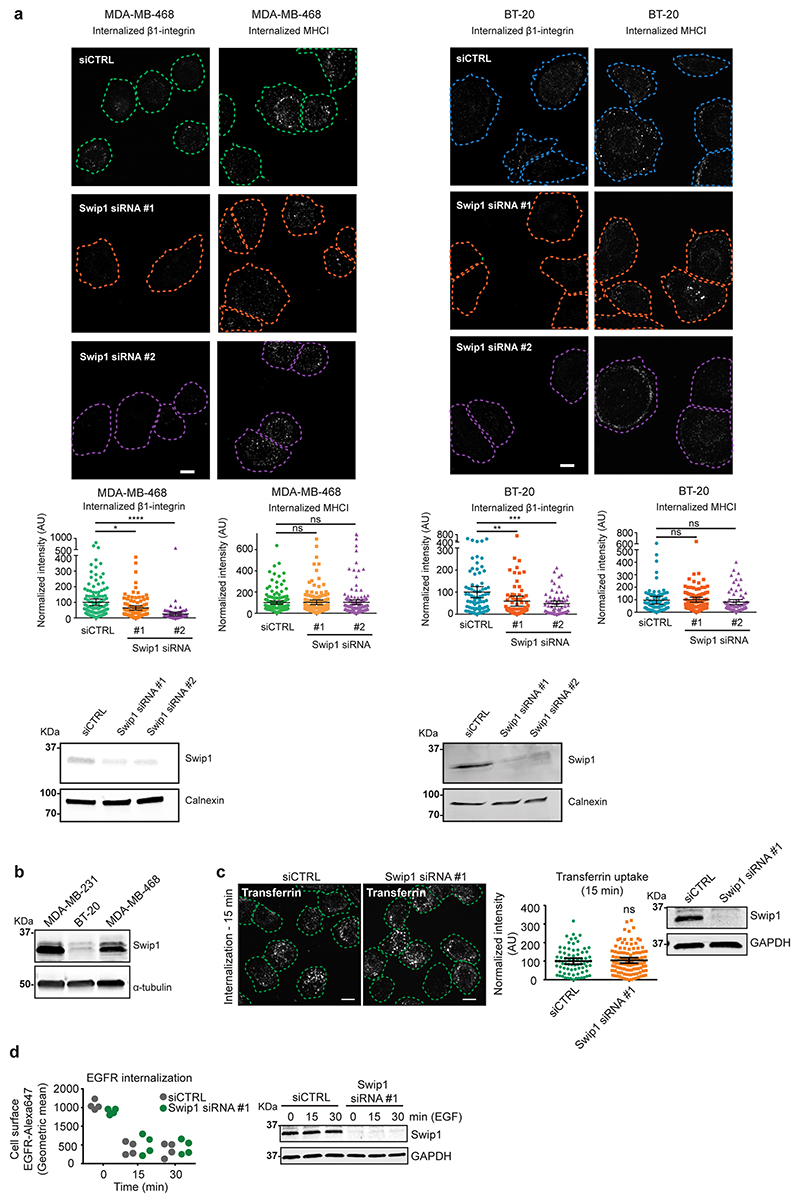
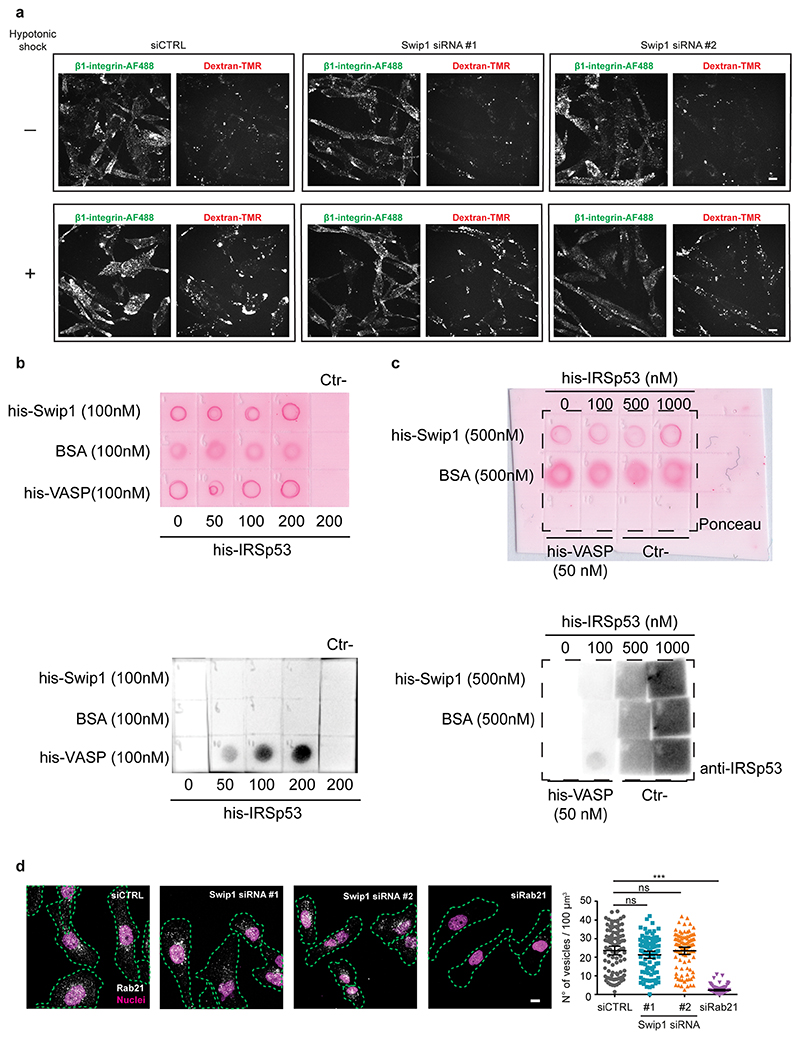
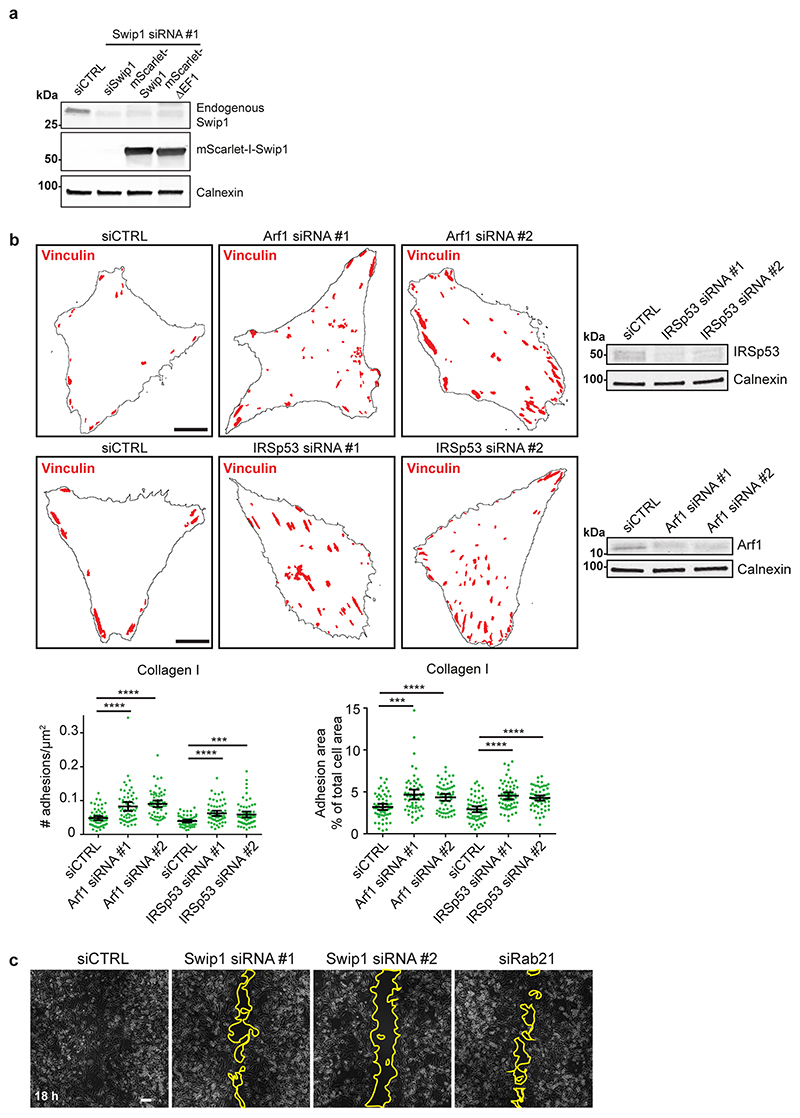
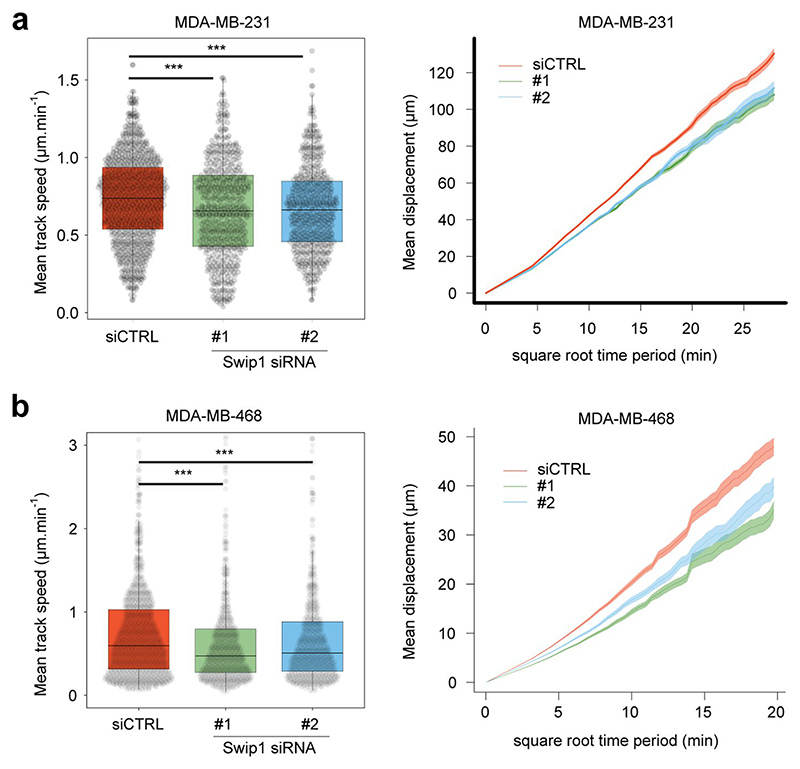
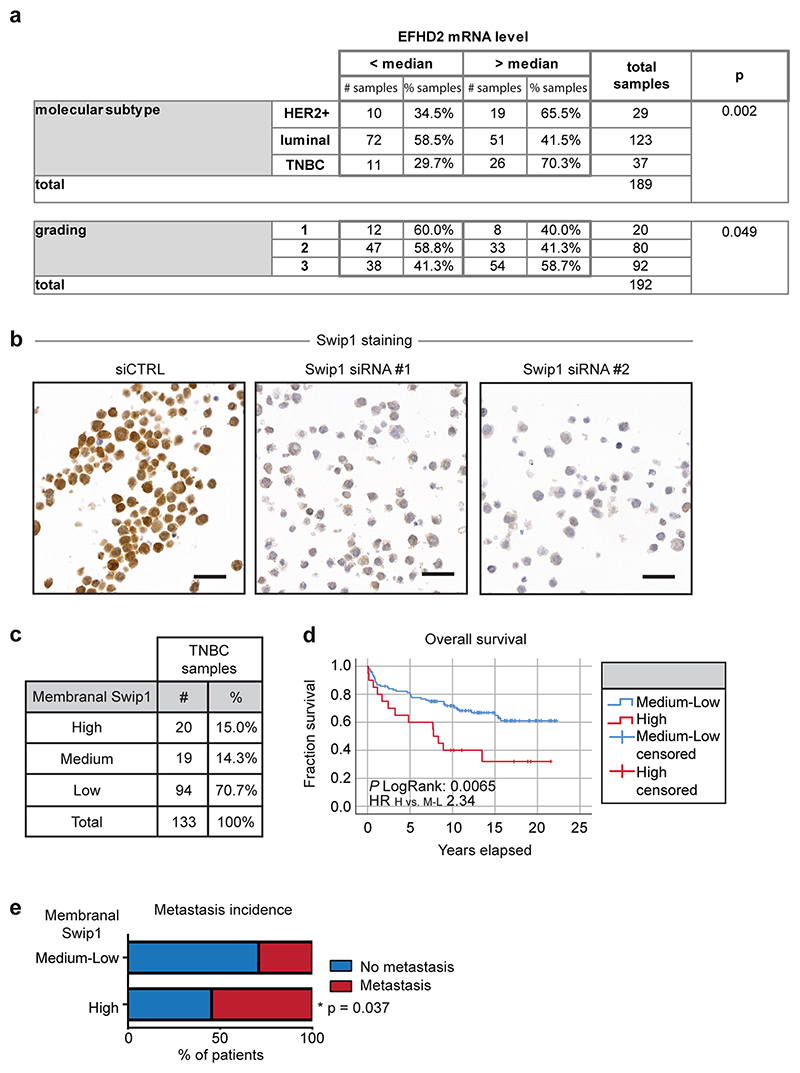
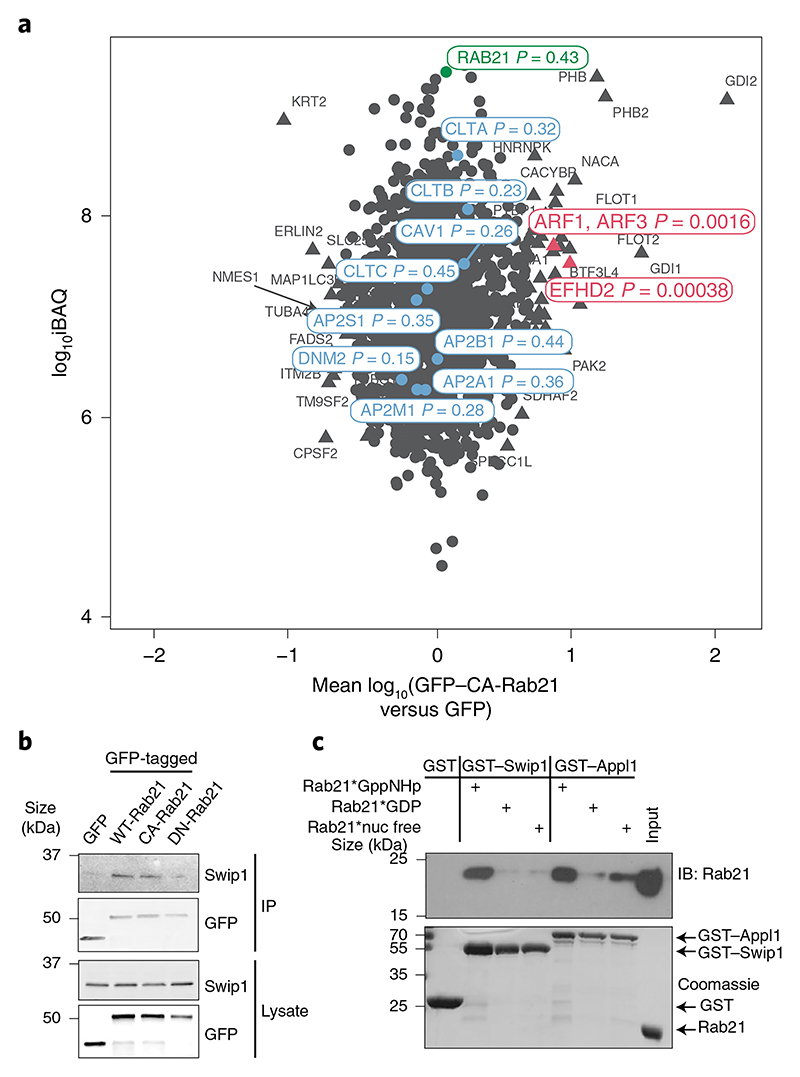
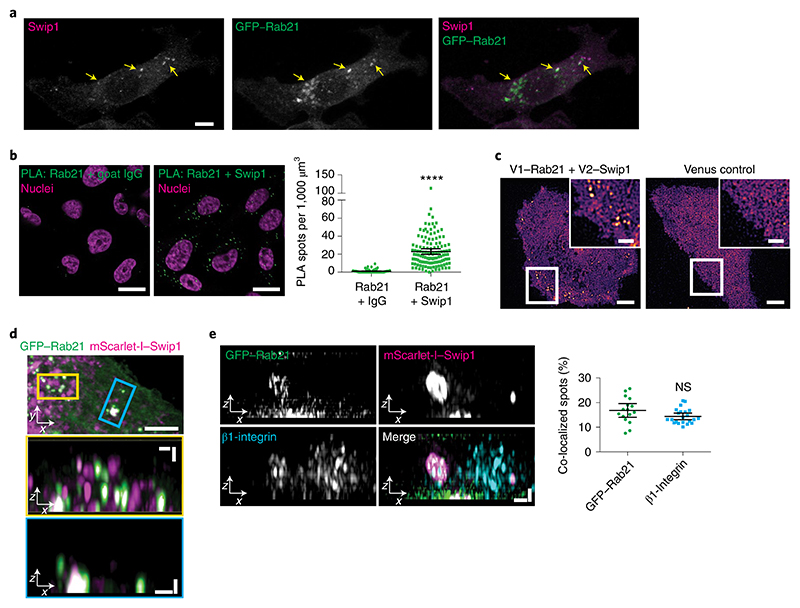
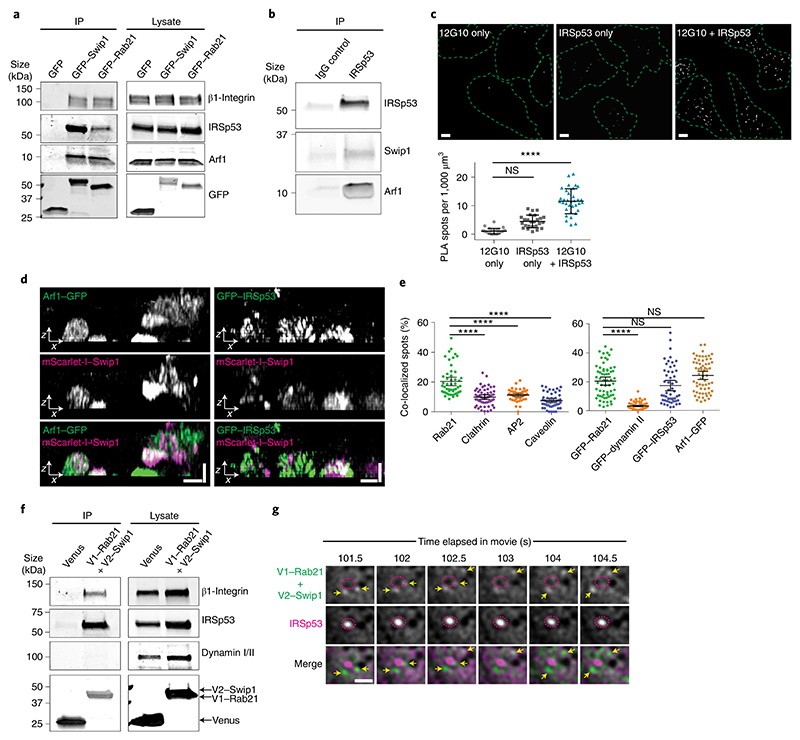
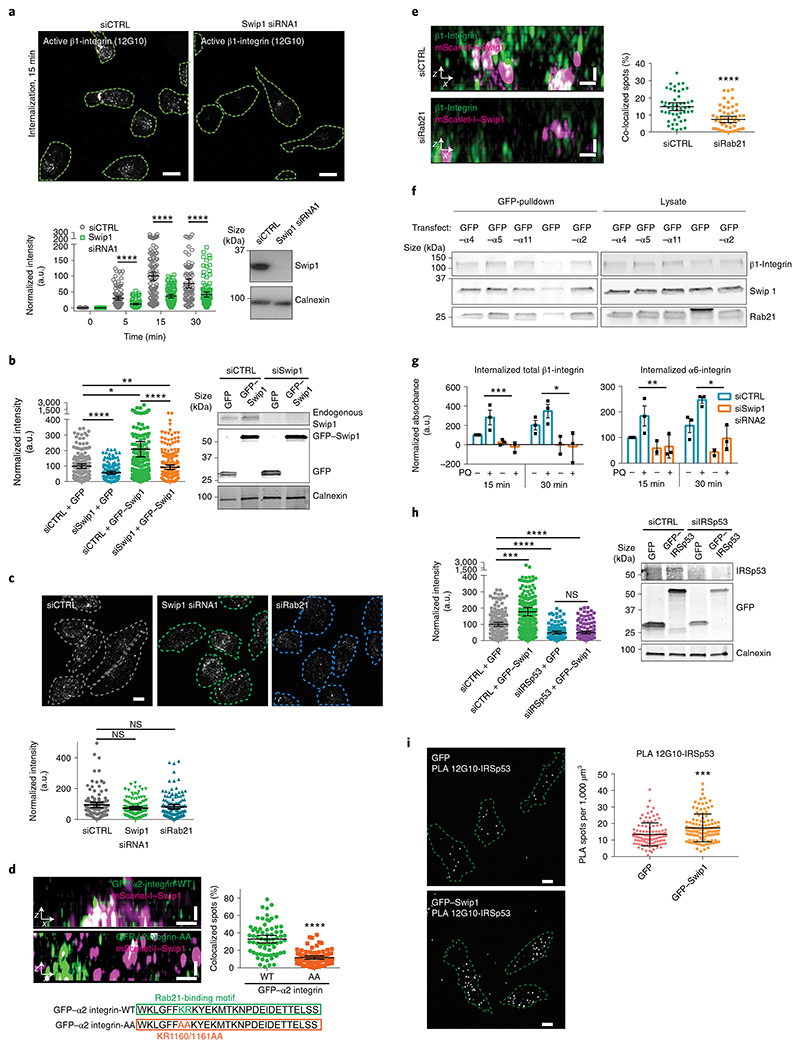
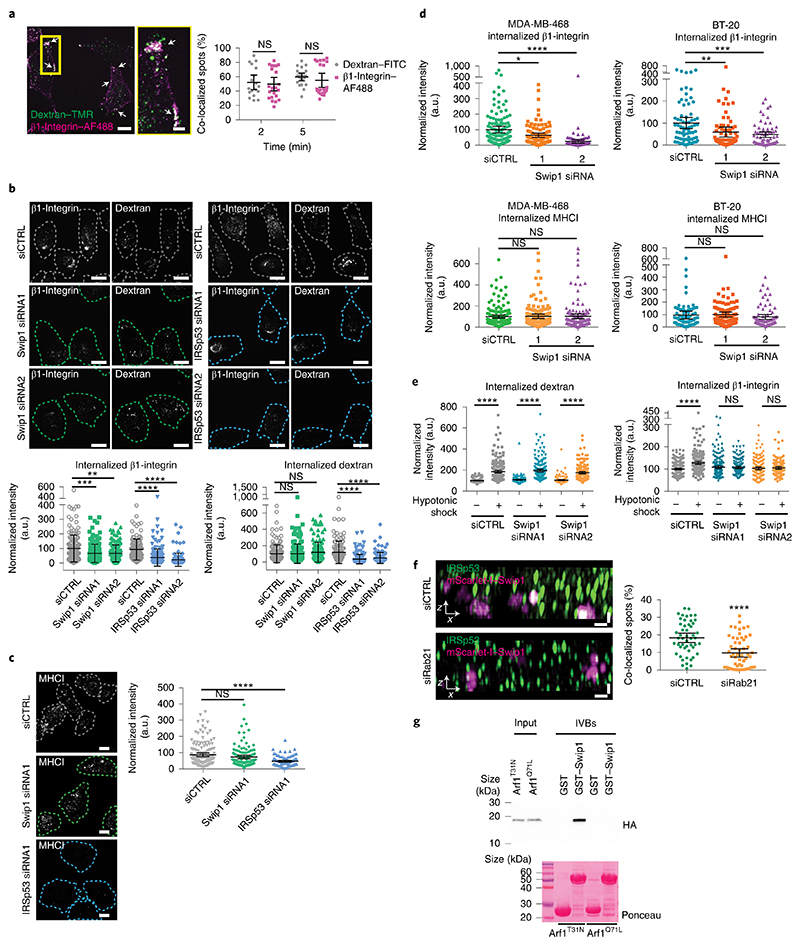
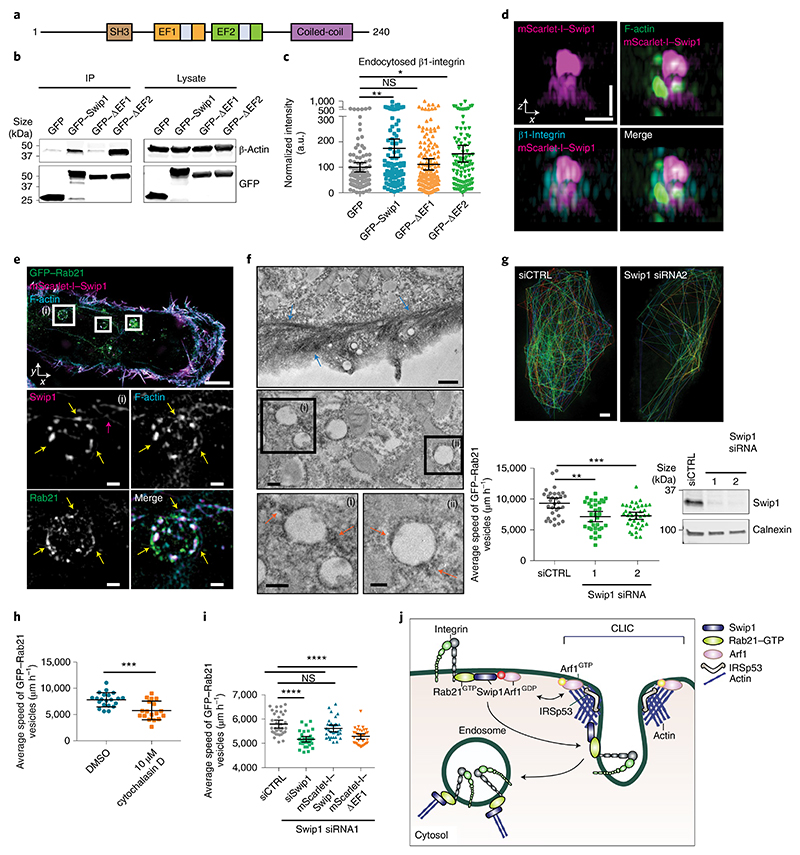
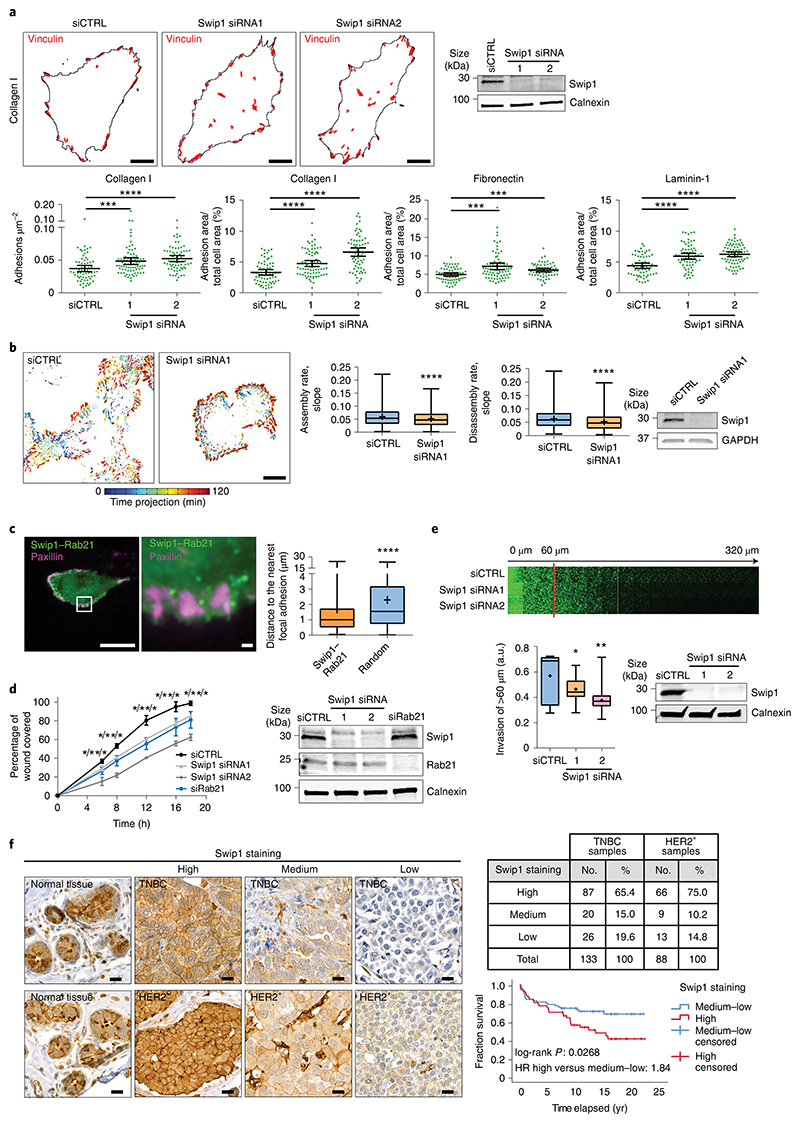
Spatially controlled, cargo-specific endocytosis is essential for development, tissue homeostasis and cancer invasion. Unlike cargo-specific clathrin-mediated endocytosis, the clathrin- and dynamin-independent endocytic pathway (CLIC-GEEC, CG pathway) is considered a bulk internalization route for the fluid phase, glycosylated membrane proteins and lipids. While the core molecular players of CG-endocytosis have been recently defined, evidence of cargo-specific adaptors or selective uptake of proteins for the pathway are lacking. Here we identify the actin-binding protein Swiprosin-1 (Swip1, EFHD2) as a cargo-specific adaptor for CG-endocytosis. Swip1 couples active Rab21-associated integrins with key components of the CG-endocytic machinery-Arf1, IRSp53 and actin-and is critical for integrin endocytosis. Through this function, Swip1 supports integrin-dependent cancer-cell migration and invasion, and is a negative prognostic marker in breast cancer. Our results demonstrate a previously unknown cargo selectivity for the CG pathway and a role for specific adaptors in recruitment into this endocytic route.


Conflict of interest statement

Competing interests

The authors declare no competing interests.

Figures

Extended Data fig. 1
Extended Data fig. 1. Swip1 (EFHD2) is an interactor of Rab21.
SILAC proteomics analysis of GFP-Trap pulldowns in MDA-MB-231 cells expressing GFP-WT-Rab21 vs. GFP–DN-Rab21 (T31N inactive GDP-bound/nucleotide-free mutant) (a); GFP-CA-Rab21 (Q76L constitutively active GTP-bound mutant) vs. GFP (b); GFP-WT-Rab21 vs. GFP (c) or GFP-WT-Rab21 vs. GFP-CA-Rab21 (d). (a-d) Each spot in the plots corresponds to one identified protein by mass spectrometry. Plots are representative of 2 independent experiments, forward and reverse; where every experiment consists of two independent affinity purifications. Plots show mean fold-changes from forward and reverse experiments against absolute protein abundances (intensity-based absolute quantification, iBAQ). Abundance bins were defined by including 1000 proteins in a subsequent order. Log10 fold change of proteins were tested for significance using double-sided significance B tests. No multiple hypothesis correction method was applied, due to the small number of selected proteins for the statistical analysis. Proteins with a P-value < 0.01 are projected as a triangle, while non-significant proteins are shown as circles. P-values are depicted in the figure for a selected set of proteins relevant to the work. Proteins in red are markedly enriched in the CA- or WT-Rab21 fraction and proteins in blue are known endosomal proteins clathrin (CLTA, CLTB, CLTC), AP2 (AP2A1, AP2B1, AP2M1, AP2S1), caveolin (CAV1) and dynamin II (DNM2), which are not specifically enriched. Swip1 was strongly enriched in the GFP-WT-Rab21 vs. GFP–DN-Rab21 (a) and GFP-CA-Rab21 and GFP-WT-Rab21 fractions compared to GFP fractions (b, d), and it was equally enriched in the GFP-CA-Rab21 compared to the GFP-WT-Rab21 fraction (c). Clathrin (CLTA, CLTB, CLTC), AP2 (AP2A1, AP2B1, AP2M1, AP2S1), caveolin (CAV1) and dynamin II (DNM2) are not strongly enriched in any fraction. (e). Representative immunoblots of GFP-Trap pulldowns from MDA-MB-231 cells transfected with GFP, GFP-WT-Rab21, GFP-WT-Rab5, GFP–DN-Rab5 or GFP-CA-Rab5 stained for endogenous swip1 and β1 integrin. Blots are representative of 2 independent experiments. Unprocessed blots are provided in Source data.
Extended Data fig. 2
Extended Data fig. 2. BiFC/BiCAP approaches to assess the interaction between Rab21 and Swip1.
(a) Cartoon of the BiFC/BiCAP approach used to image (BiFC) and biochemically detect (BiCAP) the interactions between Rab21 and Swip1 in live cells and from cell lysate. (b) MDA-MB-231 cells were transfected with the indicated constructs and lysed. Proteins expressed in the transfected cells were detected by immunoblotting. Immunoblot shows the size of the bands detected by a polyclonal anti-GFP antibody. Blots are representative of 2 independent experiments. (c) Representative confocal microscopy BiFC images of MDA-MB-231 cells expressing V1–Rab21 and V2–Swip1 MDA-MB-231 and immunostained for endosomal markers. Insets show BiFC colocalizing with the indicated endosomal markers. Scale bars, 10 μm (main figures) and 1 μm (insets). Representative pictures of 3 independent experiments. Unprocessed blots are provided in Source data.
Extended Data fig. 3
Extended Data fig. 3. SIM images of Swip1 with CG components and Rab proteins.
(a) Confocal micrographs of MDA-MB-231 cells expressing mScarlet-I-Swip1 and GFP–Rab21, and immunostained for β1-integrin (12G10 antibody). Arrows show areas of co-localization in endosomal structures. Representative pictures of n = 3 independent experiments. Scale bar, 10 μm. (b) Full pictures from Fig. 2d, e and 3d. x-y projections of MDA-MB-231 cells expressing mScarlet-I-Swip1 and either GFP–Rab21, Arf1–GFP or GFP–IRSp53 were imaged using structured illumination microscopy (SIM). Blue and yellow squares highlight the regions of interest (ROI) shown as x-z projections in Fig. 2d, e and Figure 3d. Representative pictures of n = 3 independent experiments. Scale bars, 5 μm (2d), 8 μm (2e) and 8 μm (3d); insets, 1 μm. (c) SIM x-z projections of MDA-MB-231 cells expressing mScarlet-I-Swip1 and immunostained for endogenous Rab proteins and quantification of Rab protein co-localization with mScarlet-I-Swip1. Each dot represents the co-localization ratio in one cell. Data are presented as mean values ± 95 % CI. Statistical significance was assessed with two-sided Mann–Whitney tests, where n is the total number of cells pooled from 3 independent experiments. P values calculated compared to Rab21 condition. **** P < 0.0001. Number of cells analysed over 3 independent experiments: n = 39 cells for Rab21, n = 35 for Rab5, n = 31 for Rab7, n = 36 for Rab11. Scale bars, 0.5 μm. Numerical source data are provided in Source data.
Extended Data fig. 4
Extended Data fig. 4. GFP–Swip1 co-localizes with Arf1–HA at the TIRF plane and regulates β1-integrin endocytosis via the CG pathway.
MDA-MB-231 cells were co-transfected with GFP-Swip1 and Arf1-HA constructs, fixed, stained with probes for DNA paint and imaged using SMLM. Examples of the structures formed by GFP-Swip1 at the proximity of the ECM interphase are shown. Representative pictures of n = 2 independent experiments. Scale bars, 2 μm (main images) and 0.5 μm (insets). (b) Representative immunoblots of control- and Swip1-silenced MDA-MB-231 cell lysates blotted as indicated, calnexin is included as a loading control. Blots are representative of n = 3 independent experiments. (c) FACS analyses of cell surface β1-integrin in control- and Swip1-silenced MDA-MB-231 cells using the indicated antibodies. Bar charts show data as geometric mean values of 10,000 cells ± SEM over n = 3 independent experiments. Statistical significance was assessed with two-tailed Wilcoxon matched-pairs signed-rank tests (n = 3 independent experiments), ns = not significant. (d) Quantification of biotinylated α2-, α3- or αv- integrin internalization in Swip1-silenced MDA-MB-231 cells (siRNA #2) after the indicated times determined with ELISA in the presence or absence of 100 μM primaquine. Bar charts show data as mean values ± SEM. Statistical significance was assessed using multiple-comparison t-tests for paired data, with the post-hoc Holm–Sidak method, with alpha = 5.000%. Each row was analysed individually, without assuming a consistent SD.*P = 0.01540; n = 3 biologically independent experiments. Unprocessed blots and numerical source data are provided in Source data.
Extended Data fig. 5
Extended Data fig. 5. Active β1-integrins are endocytosed via the CG pathway and CME.
(a) Representative micrographs and quantification of β1-integrin uptake in control- or IRSp53- or Arf1-silenced MDA-MB-231 cells. Representative immunoblots to validate Swip1 silencing. Scale bars, 10 μm. (b) Representative micrographs and quantification of endocytosed or surface (no endocytosis or acid wash) of murine β1-integrin (9EG7 antibody) in isogenic IRSp53−/− MEFs: IRSp53-KO-pBABE (-/-) and IRSp53-KO-pBABE-IRSp53 (WT) in which the expression of IRSp53 has been restored. Representative immunoblots of cell lysates blotted as indicated. Scale bars, 10 μm. (c) Representative micrographs of β1-integrin uptake in GFP- and GFP-Swip1-expressing cells and quantification of integrin uptake at the indicated times. Scale bars, 10 μm. (d) PLA with the indicated antibodies (from Figure 4i) in MDA-MB-231 cells expressing either GFP or GFP-Swip1. Plot shows the background controls for each. (e) Representative images and quantification of co-localization of β1-integrin-AF488 (12G10) with TMR-10 kDa dextran or AF647-transferrin after 1 min simultaneous uptake in MDA-MB-231 cells. Yellow arrows show regions of co-localization between β1-integrin and TMR-dextran and cyan arrows show regions where β1-integrin co-localizes with AF647-transferrin. Scale bars, 10 μm. For all plots, data are presented as mean values ± 95% CI. Statistical significance was assessed with two-sided Mann–Whitney tests, where n is the total number of cells pooled from 3 independent experiments (a-d) or from 2 independent experiments (e). (a) ****P<0.0001, (b) ****P<0.0001, ns = not significant, (c) *P = 0.0478, **P = 0.0058, (c) ***P = 0.0006, (d) ***P = 0.0001, ****P<0.0001, (e) ****P<0.0001. Number of analysed cells: (a) siCTRL, n = 103 cells, Arf1 siRNA #1, n = 177 cells, Arf1 siRNA #2, n = 157 cells, siCTRL, n = 100, IRSp53 siRNA #1, n = 142 cells, IRSp53 siRNA #2, n = 124 cells. (b) Endocytosed and surface β1-integrin, respectively: IRSp53 WT, n = 108 & n = 55 cells, IRSp53 KO, n = 100 & n = 60 cells. (c) GFP, n = 10, n = 22, n = 30 and n = 24 cells and GFP-Swip1, n = 15, n = 22, n = 32 and n = 26 cells, respectively. (d) For GFP, 12G10 only, n = 75 cells; IRSp53 only, n = 113 cells; 12G10 + IRSp53, n = 106 cells. For GFP-Swip1, 12G10 only, n = 78 cells; IRSp53 only, n = 92 cells; 12G10 + IRSp53, n = 111 cells. (e) β1-integrin-dextran, n = 22 cells; β1-integrin-transferrin, n = 22 cells and transferrin-dextran, n = 18 cells. Unprocessed blots and numerical source data are provided in Source data.
Extended Data fig. 6
Extended Data fig. 6. Swip1 regulates β1-integrin endocytosis via the CG pathway.
(a) Representative micrographs and quantification of β1-integrin and MHCI uptake at the 15 min time point in control or Swip1 (siRNA#1 or #2) silenced MDA-MB-468 and BT-20 cells. Representative immunoblots of cell lysates blotted for Swip1. Calnexin is included as a loading control. Scale bars, 10 μm. (b) Representative immunoblot of MDA-MB-231, BT-20 and MDA-MB-468 cell lysates blotted for Swip1. α-tubulin is included as a loading control. (c) Representative micrographs and quantification of transferrin uptake at the 15 min time point in control- or Swip1-silenced MDA-MB-231 cells. Representative immunoblots of cell lysates blotted as indicated. Calnexin is included as a loading control. Scale bars, 10 μm. (d) Cell-surface labelled EGFR uptake in control and Swip1-silenced MDA-MB-231 cells treated with 10 ng/ml EGF was analysed using flow cytometry in 10 000 non-permeabilized cells per measurement. Plot shows 4 measurements from n = 2 independent experiments. Immunoblot to validate swip1 silencing is representative of 2 independent experiments. GAPDH is included as a loading control. Immunoblots in panels (a-c) and scatter dot-plots (a-c) are representative of 3 independent experiments. Data are presented as mean values ± 95% CI. Statistical significance was assessed with two-sided Mann–Whitney tests, where n is the total number of cells pooled across 3 independent experiments. P values calculated compared to siCTRL condition: *P = 0.0137, **P = 0.0007, ***P = 0.0006, ****P<0.0001, ns = not significant. Number of analysed cells over 3 independent experiments: (a) For BT-20 12G10 and MHCI uptake, respectively, siCTRL, n = 79 & 91 cells; Swip1 siRNA#1, n = 76 & 91 cells; Swip1 siRNA#2, n = 66 & 75 cells. For MDA-MB-468 12G10 and MHCI uptake, respectively, siCTRL, n = 134 & 132 cells; Swip1 siRNA#1, n = 98 & 117 cells; Swip1 siRNA#2, n = 98 & 101 cells. (c) siCTRL, n = 74 cells; Swip1 siRNA#1, n = 103 cells. Unprocessed blots and numerical source data are provided in Source data.
Extended Data fig. 7
Extended Data fig. 7. Swip1 is required for specific entry of β1-integrin via the CG pathway following changes in membrane tension; Swip1 does not directly interact with IRSp53 and it does not affect the number of Rab21-containing vesicles.
(a) Representative images of endocytosed AF488-anti-β1-integrin (12G10 antibody) and TMR-10 kDa dextran in MDA-MB-231 cells after treatment of cells with hypotonic media followed by a shift to isotonic media. Scale bars, 10 μm. Pictures are representative of n = 3 independent experiments. Quantification of these experiments is shown in Figure 5e. (b) Recombinant purified his-Swip1 or his-VASP (positive control) proteins were spotted at the indicated concentrations on nitrocellulose filters. BSA was used as negative control. Nitrocellulose membranes were incubated with recombinant purified IRSp53 at the indicated concentrations and immunoblotted with an anti-IRSp53-specific antibody. (c) Recombinant purified his-Swip1 (500 nM) or his-VASP (50 nM, positive control) proteins were spotted at the indicated concentrations on nitrocellulose filters. BSA was used as negative control. Nitrocellulose membranes were incubated with recombinant purified IRSp53 at the indicated concentrations and immunoblotted with an anti-IRSp53-specific antibody. Pictures are representative of n = 3 independent experiments (a-c). (d) Representative micrographs of MDA-MB-231 cells immunostained for endogenous Rab21 and counterstained with DAPI and WGA-AF647 as a plasma membrane marker to define the cell outlines. The outlines of each cell are indicated in green dashed lines. The number of vesicles in 100 MDA-MB-231 cells per condition was quantified using the IMARIS vesicle detection function. Data are presented as mean values ± 95 % CI. Statistical significance was assessed with two-sided Mann–Whitney tests, where n is the total number of cells pooled across 3 independent experiments (n = 100 cells per condition). P values calculated compared to siCTRL condition: *** P < 0.0001, ns: not significant. Scale bar, 10 μm. Numerical source data are provided in Source data.
Extended Data fig. 8
Extended Data fig. 8. Arf1 and IRSp53 regulate focal adhesion formation and Swip1 and Rab21 regulate cell migration.
(a) Representative immunoblots to validate Swip1 silencing and mScarlet-I-Swip1 or mScarlet-I-ΔEF1 overexpression in the experiments shown in Figure 6i. Blot is representative of 3 independent experiments. (b) Representative masks of vinculin-containing focal adhesions in control-, IRSp53- or Arf1-silenced MDA-MB-231 cells and quantification of adhesion number and total area per cell in cells plated on collagen I. Data are presented as mean values ± 95% CI. Statistical significance was assessed with two-sided Mann–Whitney tests, where n is the total number of cells pooled across 3 independent experiments. P values calculated compared to siCTRL condition: ***P = 0.0003, ****P<0.0001. Number of analysed cells over 3 independent experiments: siCTRL, n = 62 cells; Arf1 siRNA #1, n = 60 cells; Arf1 siRNA #2, n = 61 cells; siCTRL, n = 64 cells, IRSp53 siRNA #1, n = 62 cells and IRSp53 siRNA #2, n = 65 cells. Representative immunoblots of 3 independent experiments to validate IRSp53 and Arf1 silencing are shown. Scale bars, 10 μm. (c) Representative phase contrast pictures of the scratch wound after 18 h. Pictures are representative of 3 independent experiments. Quantification of these experiments is shown in Figure 7d. Scale bar, 100 μm. Unprocessed blots and numerical source data are provided in Source data.
Extended Data fig. 9
Extended Data fig. 9. Swip1 is required for random cell migration.
Random cell migration speed of MDA-MB-231 (a) and MDA-MB-468 (b) cells upon Swip1 silencing. In all cases, cells were labelled using sir-DNA and their migration behaviour recorded over time using a widefield microscope. Cell nuclei were automatically tracked using StarDist and TrackMate. Cell track speed and mean displacement plots are displayed. Boxplots display the median and quartiles of the data. Whiskers display the 2nd percentile and the 98th percentile. Mean displacement plots show mean values ± standard deviation. For all panels, P-values were determined using a randomization test, where n is the total number of cells pooled across 3 independent experiments, ***P = <0.001. Number of cells analysed over 3 independent experiments: MDA-MB-231, siCTRL, n = 869 cells; siSwip1 #1, n = 553 cells; siSwip1 #2, n = 506 cells; MDA-MB-468, siCTRL, n = 331 cells; siSwip1 #1, n = 206 cells; siSwip1 #2, n = 235 cells. Numerical source data are provided in Source data.
Extended Data fig. 10
Extended Data fig. 10. EFHD2 (Swip1) mRNA expression correlates with a more metastatic breast cancer phenotype and Swip1 immunostaining at the plasma membrane correlates with higher death risk and metastasis incidence in TNBC.
(a) Analysis of Swip1 mRNA expression using qPCR in 192 breast tumours. Tumours were categorized into two groups: high EFHD2 expression (higher than the median of the entire collection) or low EFHD2 expression (lower expression than the median). The χ2-test was used for statistical analyses. EFHD2 mRNA levels based on tumour type and tumour grade are shown. (b) Validation of anti-Swip1 antibody specificity in IHC was carried out with agarose-embedded and formalin-fixed paraffin-embedded cell pellets from control- or Swip1-silenced MDA-MB-231 cells (siRNA #1 and #2). Scale bars, 50 μm. (c) Quantification of the percentage of breast cancer tumours from TNBC tissue microarray with high, medium or low Swip1 staining at the plasma membrane. (d) Kaplan–Meier plot shows overall survival of 133 triple negative breast cancer patients with high (H, red) or medium–low (M-L, blue) membranal staining of Swip1 in their tumour centre sample. The hazard ratio of high vs. medium–low Swip1 immuno-positivity was 2.34 (95% CI 1.25 to 4.41). The hazard ratios after adjustment for Ki67, 2.51 (95% CI 1.26 to 5.01); for tumour size, 2.12 (95% CI 1.08 to 4.18); for lymph node metastasis status 2.26 (95% CI 1.19 to 4.31) and for tumour grade 2.44 (95% CI 1.25 to 4.74). (e) Lymph node metastasis incidence in 130 TNBC patients from the same cohort, Fisher’s exact test p = 0.037. A higher proportion of patients with high membranal staining of Swip1 (> = 80%) had lymph node metastasis. Numerical source data are provided in Source data.
Fig. 1
Fig. 1. Swip1 interacts directly with active Rab21.
a, SILAC proteomics analysis of GFP-Trap pulldowns in MDA-MB-231 cells expressing GFP-tagged CA-Rab21 versus GFP alone. The plot is representative of two independent experiments, forward and reverse; the experiments consisted of two independent affinity purifications. The plot shows the mean fold-changes from the forward and reverse experiments against absolute protein abundances (intensity-based absolute quantification, iBAQ). Abundance bins were defined by including 1,000 proteins in a subsequent order. The log10-transformed fold-change values of the proteins were tested for statistical significance using double-sided Significance B tests. No multiple hypothesis correction method was applied due to the small number of selected proteins for the statistical analysis. Proteins with P < 0.01 are represented by a triangle and non-significant proteins are shown as circles. P values are depicted in the figure for a selected set of proteins. The proteins in red are markedly enriched in the CA-Rab21 fraction and proteins in blue are known endosomal proteins—clathrin (CLTA, CLTB and CLTC), AP2 (AP2A1, AP2B1, AP2M1 and AP2S1), caveolin (CAV1) and dynamin II (DNM2)—that are not specifically enriched. b, Representative immunoblots of GFP-Trap pulldowns from MDA-MB-231 cells transfected with the indicated constructs and probed for GFP and endogenous Swip1. Three independent experiments were performed. GFP–DN-Rab21, Rab21T33N dominant negative, GDP-bound/nucleotide-free; IP, immunoprecipitation. c, Coomassie-stained gel and immunoblot (IB) of GST-pulldowns with the indicated GST-tagged proteins and recombinant Rab21 (indicated by asterisks) bound to a non-hydrolysable form of GTP (GppNHP; active Rab21), GDP or no nucleotide after EDTA treatment (nuc free). The Rab21-effector GST–APPL1 was used as a positive control. Three independent experiments were performed. Unprocessed blots are provided.
Fig. 2
Fig. 2. Swip1 interacts with Rab21 and β1-integrin.
a, Representative MDA-MB-231 cell expressing GFP–Rab21 and immunostained for Swip1. The arrows point to regions of overlap between Swip1 and GFP–Rab21. Scale bar, 10 μm. The micrograph is representative of two independent experiments. b, Endogenous Rab21 and Swip1 are in close proximity in MDA-MB-231 cells. A PLA assay using the indicated antibodies (left) is quantified (right). Goat IgG was included as a negative control and nuclei were stained with 4,6-diamidino-2-phenylindole. Scale bars, 20 μm; n = 121 (Rab21–IgG) and 126 (Swip1–Rab21) cells were examined across three independent experiments. c, Representative TIRF microscopy images of live MDA-MB-231 cells expressing the BiFC constructs V1–Rab21 and V2–Swip1 or Venus alone as a control. Scale bars, 5 μm (main images) and 2 μm (insets). Three independent experiments were performed. d, MDA-MB-231 cells expressing mScarlet-I–Swip1 and GFP–Rab21 imaged using SIM. The blue and yellow squares highlight the regions of interest (ROI; top) in the xy plane that are magnified in the xz projections (middle and bottom; magnified views). Scale bars, 5 μm (top) and 1 μm (middle and bottom). Representative images of three independent experiments are shown. e, SIM x–z projections of MDA-MB-231 cells expressing mScarlet-I–Swip1, GFP–Rab21 and immunostained for β1-integrin (left) were quantified for co-localization with mScarlet-I–Swip1 (right). Each dot represents the co-localization fraction in one cell; n = 16 (GFP–Rab21) and 22 (β1-integrin) cells pooled from two independent experiments. Scale bars, 0.5 μm. b,e, Data are presented as the mean ± 95% confidence interval (CI). Statistical significance was assessed using a two-sided Mann–Whitney test; ****P < 0.0001; NS, not significant. Numerical source data are provided.
Fig. 3
Fig. 3. Swip1 interacts with members of the CG pathway.
a, Representative immunoblots of GFP-Trap pulldowns from HEK293 cells transfected as indicated and blotted for GFP, endogenous IRSp53, Arf1 and β1-integrin. b, Representative immunoprecipitation, with control mouse IgG or anti-IRSp53, of MDA-MB-231 cell lysates probed for endogenous Swip1, IRSp53 and Arf1. c, Proximity ligation assay with the indicated antibodies alone (negative controls) and together to assess co-localization. Scale bars, 10 μm; n = 12 (12G10 only), 18 (IRSp53 only) and 28 (12G10 + IRSp53) cells analysed across two independent experiments. d, Representative SIM x–z projections of MDA-MB-231 cells expressing mScarlet-I–Swip1 and GFP–IRSp53 or GFP–Arf1. Scale bars, 0.8 μm. Three independent experiments were performed. e, MDA-MB-231 cells expressing mScarlet-I–Swip1 and immunostained for endocytic adaptor proteins (left) or transfected with the indicated GFP-tagged constructs (right) were imaged with SIM and quantified for co-localization with mScarlet-I–Swip1. Each dot represents the co-localization fraction in one cell; n = 50 (Rab21, AP2 and caveolin), 55 (clathrin), 63 (GFP–Rab21 and GFP–dynamin II), 53 (GFP–IRSp53) and 62 (GFP–Arf1) cells analysed, pooled from three independent experiments. c,e, Data are the mean ± 95% CI. Statistical significance was assessed using a two-sided Mann–Whitney test; ****P < 0.0001. f, Representative immunoblots of bimolecular complementation affinity purification pulldowns from MDA-MB-231 cells transiently transfected as indicated and blotted for GFP/Venus, endogenous IRSp53, dynamin I/II and β1-integrin. The GFP antibody recognizes both V1–Rab21 and V2–Swip1 (see also Extended Data Fig. 2b). a,b,f, Two independent experiments were performed. g, Representative TIRF microscopy BiFC images of live MDA-MB-231 cells expressing V1–Rab21 + V2–Swip1 and mCherry–IRSp53. The yellow arrows point to V1–Rab21 + V2–Swip1 puncta that travel towards mCherry–IRSp53 puncta (pink dashed circles) and then disappear from the TIRF plane. Scale bar, 1 μm. Representative images of two independent experiments are shown. IP, immunoprecipitation. Unprocessed blots and numerical source data are provided.
Fig. 4
Fig. 4. Swip1 mediates the endocytosis of active integrins via the CG pathway.
a, Representative micrographs of active β1-integrin internalization in control (siCTRL)- and Swip1-silenced MDA-MB-231 cells (top; green dashed lines show the outlines of the cells defined by phalloidin labelling), and levels of internalized β1-integrin at the indicated times (bottom left). Representative immunoblot to validate Swip1 silencing (bottom right). Scale bars, 30 μm; siCTRL, n = 86, 101, 110 and 78 cells; Swip1 siRNA1, n = 104, 98, 102 and 106 cells, from left to right. b, Levels of active β1-integrin internalization at 15 min in siCTRL- or Swip1-silenced MDA-MB-231 cells expressing GFP or GFP–Swip1 (left). Representative immunoblots of cell lysates probed as indicated (right); siCTRL + GFP, n = 153 cells; siCTRL + GFP–Swip1, n = 186 cells; siSwip1 + GFP, n = 136 and siSwip1 + GFP–Swip1, n = 196 cells. *P = 0.0275 and **P = 0.0260. c, Representative micrographs (top) and levels of inactive β1-integrin (Mab13) internalization at 15 min in siCTRL-, Swip1- and Rab21-silenced (siRab21) MDA-MB-231 cells. Scale bar, 10 μm; siCTRL, n = 107 cells; Swip1 siRNA1, n = 116 cells; and siRab21, n = 122 cells. d, SIM x–z projections of MDA-MB-231 cells expressing mScarlet-I–Swip1 and GFP-tagged α2-integrin-WT or mutant α2 integrin-AA (top left). The integrin cytoplasmic sequence and mutated residues (red) are depicted (bottom). Levels of co-localization of GFP-tagged proteins with mScarlet-I–Swip1 (right). Mutant α2 integrin-AA, n = 76 cells; and α2 integrin-WT, n = 70. e, SIM x–z projections of siCTRL- or Rab21-silenced MDA-MB-231 cells expressing mScarlet-I–Swip1 and immunostained for β1-integrin (P5D2; left). Levels of co-localization between mScarlet-I–Swip1 and β1 integrin (right). siCTRL, n = 50 cells; and siRab21, n = 56 cells. d,e, Scale bars, 0.5 μm. f, Representative immunoblots of three independent GFP-Trap pulldowns from MDA-MB-231 cells transfected with different GFP-tagged integrin α-subunits and blotted as indicated. g, Levels of cell-surface biotinylated β1-integrin (left) and α6-integrin internalization (right) in Swip1-silenced MDA-MB-231 cells after the indicated times in the presence or absence of 100 μM primaquine (PQ). The bar charts show the mean ± s.e.m. Statistical significance was assessed using multiple-comparison t-tests for paired data, with the post-hoc Holm–Sidak method; α = 5.000%. For β1-integrin (left), ***P = 0.00934 and *P = 0.02015; for α6-integrin, *P = 0.02196 and **P = 0.04683 Three independent experiments were performed. h, Level of β1-integrin internalization in siCTRL- and IRSp53-silenced (siIRSp53) MDA-MB-231 cells expressing GFP or GFP–Swip1 (left). Representative immunoblots of cell lysates probed as indicated (right); siCTRL + GFP, n = 157 cells; siCTRL + GFP–Swip1, n = 289 cells; siIRSp53 + GFP, n = 108 and siIRSp53 + GFP–Swip1, n = 136 cells. ***P = 0.0003. i, Representative micrographs (left) and quantification of PLA with the indicated antibodies in MDA-MB-231 cells expressing GFP or GFP–Swip1. Scale bars, 10 μm; GFP, n = 106 and GFP–Swip1, n = 111 cells. ***P = 0.0001 ae,h,i, The scatter dot plots show data as the mean ± 95% CI. Statistical significance was assessed using two-sided Mann–Whitney tests; n is the total number of cells pooled from three independent experiments. ae,h, ****P < 0.0001; a.u., arbitrary units. Unprocessed blots and numerical source data are provided.
Fig. 5
Fig. 5. Swip1 is a cargo adaptor for the CG pathway.
a, Double uptake (indicated by arrows) of fluorescently labelled 10 kDa dextran–tetramethylrhodamine (TMR) with either fluorescein isothiocyanate (FITC)-conjugated dextran or Alexa Fluor (AF) 488-conjugated anti-β1-integrin antibody (12G10, β1-integrin–AF488) in MDA-MB-231 cells for the indicated times (right). Representative images at 5 min internalization are shown (left). Scale bars, 10 μm (main image) and 3 μm (inset, magnified view of the yellow box in the main image). Dextran–FITC, n = 18 and 21 cells; and β1-integrin–A488, n = 22 and 21 cells. b, Representative micrographs (top), and levels of dextran–TMR (bottom right) and β1-integrin–AF488 (bottom left) internalization in control-, Swip1- and IRSp53-silenced MDA-MB-231 at 15 min. Swip1 siRNA1, n = 157 cells; Swip1 siRNA2 and siCTRL, n = 160 cells; siCTRL, n = 121 cells; IRSp53 siRNA1, n = 177 cells; and IRSp53 siRNA2, n = 121 cells. ***P = 0.0001 and **P = 0.0004. c, Representative micrographs (left) and levels of MHCI internalization in control-, Swip1- and IRSp53-silenced MDA-MB-231 at 15 min (right). Swip1 siRNA1, n = 125 cells; IRSp53 siRNA1, n = 92 cells; and siCTRL, n = 152 cells. b,c, Dashed lines show the outlines of the cells defined by labelling with the plasma membrane marker WGA lectin conjugated to Alexa Fluor 647 (WGA–AF647). Scale bars, 10 μm. d, Levels of β1-integrin (top) and MHCI (bottom) internalization in control- or Swip1-silenced MDA-MB-468 (left) and BT-20 (right) cells at 15 min. For BT-20 12G10 and MHCI uptake, respectively, siCTRL, n = 79 and 91 cells; Swip1 siRNA1, n = 76 and 91 cells; and Swip1 siRNA2, n = 66 and 75 cells. For MDA-MB-468 12G10 and MHCI uptake, respectively, siCTRL, n = 134 and 155 cells; Swip1 siRNA1, n = 98 cells and 156 cells; and Swip1 siRNA2, n = 98 cells and 135 cells. *P = 0.0137, **P = 0.0007 and ***P = 0.0006. e, Levels of β1-integrin–AF488 (right) and 10 kDa dextran–TMR (left) uptake in steady state or after recovery from hypotonic shock in control- and Swip1-silenced MDA-MB-231 cells. For dextran uptake in the absence of (−) or with (+) hypotonic shock, respectively: siCTRL, n = 227 and 220 cells; Swip1 siRNA1, n = 208 and 186 cells; and Swip1 siRNA2, n = 208 and 187 cells. For β1-integrin uptake in the absence of (−) or with (+) hypotonic shock, respectively: siCTRL, n = 195 and 191 cells; Swip1 siRNA1, n = 208 and 181 cells; and Swip1 siRNA2, n = 181 and 139 cells. f, SIM x–z projections of control- and Rab21-silenced (siRab21) MDA-MB-231 cells expressing mScarlet-I–Swip1 and immunostained for IRSp53 (left). Co-localization between mScarlet-I–Swip1 and endogenous IRSp53 was quantified (right); siCTRL, n = 50 cells; and siRab21, n = 56 cells. Scale bars, 0.5 μm. g, Cell lysates from HEK293T cells transfected with HA–Arf1T31N (inactive) or HA–Arf1Q71L (active) were incubated with 2 μM of recombinant purified GST or GST–Swip1. Representative GST pulldowns (IVBs) stained with Ponceau and blotted with the indicated antibody from three independent experiments. af, Data are the mean ± 95% CI; n is the total number of cells pooled from three independent experiments. Statistical significance was assessed using two-sided Mann–Whitney tests; ****P < 0.0001. Unprocessed blots and numerical source data are provided.
Fig. 6
Fig. 6. Swip1–actin binding regulates integrin traffic.
a, Swip1 domains. EF, EF-hand domain containing a calcium-binding site (shown in grey); SH3, SRC homology 3 domain. b, Representative GFP-pulldowns of two independent experiments in HEK293 cells expressing GFP, GFP–Swip1 or truncated versions of Swip1 and blotted as indicated. IP, immunoprecipitation. c, Levels of β1-integrin uptake at 15 min in MDA-MB-231 cells expressing the indicated proteins. **P = 0.0034 and *P = 0.0356; n = 92 (GFP), 94 (GFP–Swip1), 161 (GFP–ΔEF1) and 101 (GFP–ΔEF2) cells. d, Representative SIM x–z projections of MDA-MB-231 cells expressing mScarlet-I–Swip1, immunostained for β1-integrin and labelled with phalloidin. Two independent experiments were performed. Scale bars, 0.7 μm. e, Representative SIM x–y image of MDA-MB-231 cells expressing mScarlet-I–Swip1 and GFP–Rab21 and labelled with phalloidin. The white squares highlight ROIs. The yellow arrows point to Swip1 overlap with actin on Rab21-containing vesicles. The pink arrow indicates actin filaments in close proximity to the vesicle. Scale bars, 5 μm (main image) and 0.5 μm (magnified views of (i); bottom). f, Electron microscopy images of GFP–Swip1 visualized using GBP-APEX. ROI (i) and (ii) are magnified (bottom). The arrows point to Swip1–APEX-positive patches adjacent to filament-like actin structures (blue) or vesicles (orange). Scale bars, 0.5 μm (top), 0.2 μm (middle and bottom left, magnified view of (i)) and 0.1 μm (bottom right, magnified view of (ii)). g, Average speed of Rab21 vesicles for each cell close to the TIRF plane over 2 min (bottom left). Representative tracks of Rab21 vesicles in a control or a Swip1-silenced cell (top) and representative immunoblot validating Swip1 silencing (bottom right). Scale bar, 5 μm; **P = 0.0005 and ***P = 0.0003; n = 31 (siCTRL), 33 (siSwip1 siRNA1) and 39 (siSwip1 siRNA2) cells. h, Average speed of Rab21-vesicle movement for each cell following treatment with cytochalasin D. ***P = 0.0007; n = 21 (DMSO) and 18 (cytochalasin D) cells. i, Average speed of Rab21-vesicle movement for each cell following Swip1 silencing and rescue with mScarlet-I–Swip1 or mScarlet-I–ΔEF1. ****P < 0.0001; n = 33 cells per condition. j, Swip1 directs integrins to CG-endocytosis. c,gi, Data are the mean ± 95% CI; n is the total number of cells pooled from three independent experiments. Statistical significance was assessed using two-sided Mann–Whitney tests. Unprocessed blots and numerical source data are provided.
Fig. 7
Fig. 7. Swip1 regulates adhesion dynamics, cell motility and breast cancer progression.
a, Representative masks of vinculin-containing focal adhesions in control- or Swip1-silenced MDA-MB-231 cells on collagen I (top). Analysis of the number of adhesions and total adhesion area per cell on different ECM components (bottom). Scale bars, 10 μm; data are the mean ± 95% CI. Collagen I, n = 65, 76 and 67 cells; fibronectin, n = 65, 75 and 62 cells; and laminin-1, n = 62, 66 and 73 cells for siCTRL, siSwip1 siRNA1 and siRNA2, respectively. Collagen, ****P < 0.0001 and ***P = 0.0005; fibronectin, ***P = 0.0002 (Swip1 siRNA1) and 0.0007 (siRNA2); laminin-1, ****P < 0.0001. b, Visualization of the GFP–paxillin dynamics in control- and Swip1-silenced cells (left). The colour scale represents the focal adhesion localization over time. The assembly and disassembly rates are shown (middle). Scale bar, 10 μm; siCTRL, n = 861 and 764 adhesions; and siSwip1, n = 1,014 and 1,024 adhesions for assembly and disassembly, respectively; n = 18 cells were analysed per condition. c, Representative TIRF microscopy BiFC images of live MDA-MB-231 cells expressing V1–Rab21, V2–Swip1 and mKate2–paxillin (left). Distance between Swip1–Rab21 puncta or randomly distributed puncta and the closest paxillin-positive focal adhesions (right). Scale bars, 25 μm (main image) and 1 μm (magnified view of the white box); n = 697 (BiFC) and 1,364 (randomly distributed) puncta; n = 20 cells per condition. b,c, ****P < 0.0001. d, Migration of control-, Swip1- or Rab21-silenced MDA-MB-231 cells. Wound-area coverage over time (left). Data are the mean ± s.e.m. Statistical significance was assessed using multiple-comparison t-tests with the post-hoc Holm–Sidak method; siSwip1 siRNA1, *P = 0.022118, 0.00148533, 0.00320197, 0.00598189 and 0.00156902; siSwip1 siRNA2, **P = 0.00161506, 8.929064 × 10⁻⁵, 0.000190115, 0.000316543 and 0.000100846; and siRab21, *P = 0.0158582, 0.0101405, 0.00574356, 0.0240206 and 0.0286109 for 8, 12, 16 and 18 h, respectively, for comparisons with the siCTRL condition. e, Representative micrographs of control- and Swip1-silenced MDA-MB-231 cells that invaded through fibrillar collagen I (top). The relative invasion through fibrillar collagen I over 60 μm was quantified (bottom left). Representative immunoblot validating Swip1 silencing is shown (bottom right). *P = 0.0418 and **P = 0.0055. d,e, Three independent experiments were performed. f, Representative images of Swip1 staining in samples of HER2+ and TNBC breast cancer tissue microarrays (left) and the percentage of tumours with high, medium or low Swip1 (top right). Overall survival of 133 patients with TNBC with high (red) or medium and low (blue) staining of Swip1 (bottom right). The hazard ratio (HR) was 1.84 (95% CI, 1.05–3.23). Scale bars, 20 μm. b,c,e, Boxplots display the median and quartiles of the data and the whiskers display the maxima and minima. The mean of the data are indicated with a + symbol. a,b,d,e, Representative immunoblots validating silencing are shown. ac,e, Statistical significance was assessed using two-sided Mann–Whitney tests; n is the number of analysed cells (a), adhesions (b) or puncta (c) pooled from three independent experiments. Unprocessed blots and numerical source data are provided.

Comment in

References

    1. Kaksonen M, Roux A. Mechanisms of clathrin-mediated endocytosis. Nat Rev Mol Cell Biol. 2018;19:313–326. - PubMed
    1. Mettlen M, Chen P-H, Srinivasan S, Danuser G, Schmid SL. Regulation of clathrin-mediated endocytosis. Annu Rev Biochem. 2018;87:871–896. doi: 10.1146/annurev-biochem-062917-012644. - DOI - PMC - PubMed
    1. Sanger A, Hirst J, Davies AK, Robinson MS. Adaptor protein complexes and disease at a glance. J Cell Sci. 2019;132:jcs222992. - PubMed
    1. Mayor S, Parton RG, Donaldson JG. Clathrin-independent pathways of endocytosis. Cold Spring Harb Perspect Biol. 2014;6:a016758. doi: 10.1101/cshperspect.a016758. - DOI - PMC - PubMed
    1. Maldonado-Báez L, Williamson C, Donaldson JG. Clathrin-independent endocytosis: a cargo-centric view. Exp Cell Res. 2013;319:2759–2769. doi: 10.1016/j.yexcr.2013.08.008. - DOI - PMC - PubMed

Publication types

MeSH terms