. 2021 Nov;599(7883):102-107.
doi: 10.1038/s41586-021-03960-y. Epub 2021 Oct 6.

Neurotoxic reactive astrocytes induce cell death via saturated lipids

Affiliations

Neurotoxic reactive astrocytes induce cell death via saturated lipids

Kevin A Guttenplan et al. Nature. 2021 Nov.

Abstract

Astrocytes regulate the response of the central nervous system to disease and injury and have been hypothesized to actively kill neurons in neurodegenerative disease1-6. Here we report an approach to isolate one component of the long-sought astrocyte-derived toxic factor5,6. Notably, instead of a protein, saturated lipids contained in APOE and APOJ lipoparticles mediate astrocyte-induced toxicity. Eliminating the formation of long-chain saturated lipids by astrocyte-specific knockout of the saturated lipid synthesis enzyme ELOVL1 mitigates astrocyte-mediated toxicity in vitro as well as in a model of acute axonal injury in vivo. These results suggest a mechanism by which astrocytes kill cells in the central nervous system.


Figures

Extended Data Figure 1:
Extended Data Figure 1:. Principal components analysis of protein mass spectrometry data.
a) Number of significant proteins and PCA variation based on number of replicates of protein mass spectrometry that were required to have a non-zero spectral count to be considered for analysis. 3660 total unique proteins detected in astrocytes and 183 total unique proteins detected in ACM. 4 of 10 (4x) was chosen for final analysis. b) PCA plots of cellular and ACM protein mass spectrometry of all proteins detected in at least 4 of 10 astrocytes samples see shows clear separation of the proteome and secretome of reactive versus control astrocytes. c) Quantification of differentially regulated proteins in reactive astrocytes and ACM (FDR < 0.1). d) 10 most upregulated and downregulated proteins in reactive vs control astrocytes (bold = known reactivity markers)
Extended Data Figure 2:
Extended Data Figure 2:. Testing toxicity of various candidate toxic proteins.
a) Oligodendrocytes were treated with various doses of candidate toxic proteins found in our proteomics analysis or from previous literature but were not found to be toxic in our culture conditions. b) Reactive ACM, but not Lcn2, Lgals1, or complement component C3 family members, is toxic to retinal ganglion cell (RGC) neuron cultures. (all data represents N=3/4 independent samples from 2 separate primary cell isolations; presented as mean ± SEM).
Extended Data Figure 3:
Extended Data Figure 3:. Toxic Factor Enrichment.
a) Diagram of sequential toxic factor enrichment via various biochemical purification columns. b) Validation that sequentially enriched reactive ACM is more toxic than sequentially enriched control ACM. (data represents 3 independent samples from 3 separate primary cell isolations)
Extended Data Figure 4:
Extended Data Figure 4:. Astrocyte lipoparticle analysis.
a) Example control and reactive protein abundance traces for HPLC size exclusion column. b) ELISA shows an increase in ApoJ concentration within fractions associated with astrocyte HDL. (individual data points represent independent samples from a single primary cell isolation; presented as mean ± SEM) c) ELISA on concentrated control vs reactive HPLC fractions associated with HDL shows more ApoE in reactive vs control. Control and reactive HDL fractions were combined and concentrated to achieve sufficient signal for ApoE ELISA so only one sample for control vs reactive was analyzed.
Extended Data Figure 5:
Extended Data Figure 5:. Reconstituted HDL incorporation into cells.
Example images of fluorescently labeled reconstituted HDL incorporation into oligodendrocyte, microglia, endothelial cells, oligodendrocyte precursor cells (OPCs), retinal ganglion cell neurons (RGCs), and astrocytes in vitro. Note that all cells incorporate reconstituted lipoparticles except for endothelial cells. (experiment performed on 2 separate primary cell isolations for each cell type; scale bar = 100 μm).
Extended Data Figure 6:
Extended Data Figure 6:. Astrocyte metabolomics and lipidomics.
a) Reactive (red) vs control (gray) astrocytes and ACM are somewhat separable in PCA space based on their metabolome, but less so than by their lipidome (Figure 2). b) Distribution of MRM transitions selected for screening lipids. A total of 1547 transitions (used to ID lipid species) were organized into 11 MRM-based mass spectrometry methods (for lipid classes). c) Quantification of differentially regulated lipids and metabolites in reactive astrocytes and ACM (FDR < 0.1). d) Scatterplot of differentially regulated lipids in reactive vs control astrocytes and ACM highlights the overall abundance of differentially regulated lipids.
Extended Data Figure 7:
Extended Data Figure 7:. Saturated free fatty acids and phosphatidylcholines are toxic to oligodendrocytes.
a) Cultured oligodendrocytes (phase) incorporate fluorescent C16:0 FFAs (green) upon treatment (0.5 μM; scale bar = 150 μm). b) Dose curve of oligodendrocyte survival following treatment with C16:0 and C18:0 saturated FFAs shows that saturated FFAs are toxic to oligodendrocytes with longer chain lengths leading to greater toxicity (curve fits performed using one-phase decay model). c) Long-chain saturated phosphatidylcholines (20:0) are toxic to oligodendrocytes in a dose-dependent fashion. (data, including representative image in subpanel a, represents N=4 independent samples from 3 separate primary cell isolations; presented as mean ± SEM)
Extended Data Figure 8:
Extended Data Figure 8:. Further analysis of mechanism of toxic factor induced cell death.
a) Various doses of ethoxyquin in DMSO was added to oligodendrocytes with or without 30 μg/ml reactive ACM. Simple linear regression analysis on increasing doses of ethoxyquin without reactive ACM (Slope = −0.0000025, P value [slope ≠ 0] = 0.1932) and with reactive ACM (Slope = −0.000001788, P value [slope ≠ 0] = 0.4194) failed to show a significant relationship between ethoxyquin concentration and survival, suggesting that the free radical scavenger did not impact cell survival when treated in isolation and did not impact the toxicity of reactive ACM. This data, in addition to the data that Ferrostatin-1 has no effect on astrocyte toxicity, suggests that lipid peroxidation may not mediate the ACM toxicity. b) siRNAs potently knock down the lipoapoptosis sensitivity modulated genes Scd1 and Insig1 in oligodendrocytes in vitro. c) Knockdown of SCD and INSIG1, which bidirectionally modulate sensitivity to lipoapoptosis, bidirectionally modulate sensitivity of oligodendrocytes to toxic ACM. (data represents n=3 independent samples from 2 separate primary cell isolations; presented as mean ± SEM)
Extended Data Figure 9:
Extended Data Figure 9:. Elovl1 cKO validation.
a) GFP expression (green) from NuTrap mice crossed to Gfap-Cre line used in this study shows efficient recombination in Slc1a3+ astrocytes (red, as identified by RNAscope in situ hybridization) of the ganglion cell layer (GCL, identified by DAPI staining of nuclei, blue; ONL, outer nuclear layer; OPL, outer plexiform layer; INL, inner nuclear layer; IPL, inner plexiform layer). b) DNA gel following PCR amplification of Elovl1 and Gfap in the retina and optic nerve shows a decrease in Elovl1 expression relative to Gfap expression in the Elovl1 cKO mouse visual system. (white numbers indicate molecular weight markers) c) Quantification of the decrease in Elovl1 expression relative to Gfap expression in the Elovl1 cKO retina (top) and optic nerve (bottom) N=4 animals per group, bars represent s.e.m., two-tailed Student's t-test). d) Targeted lipidomics of Elovl1 cKO ACM shows dampened upregulation of the long-chain saturated lipids normally upregulated in WT reactive ACM. (black line indicates equal upregulation; red dots indicate lipids less upregulated in Elovl1 cKO vs WT ACM; black dot indicates a lipid less upregulated in WT ACM vs Elovl1 cKO ACM) e) Separation of Elovl1 cKO and WT cell and ACM lipidomes in PCA space.
Extended Data Figure 10:
Extended Data Figure 10:. Elovl1 cKo vs WT ACM toxicity over time.
Toxicity of oligodendrocytes in response to Elvol1 cKO vs wt control, reactive, and concentrated reactive ACM over 96 hours (data represents mean ± SEM of 6 experimental replicates each from 3 independent samples from 3 separate primary cell isolations; presented as mean ± SEM).
Figure 1:
Figure 1:. Proteins upregulated in reactive astrocyte conditioned media.
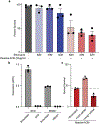
a) Phase-contrast images of oligodendrocytes treated with quiescent or reactive astrocyte conditioned media (ACM; scale bar = 100μm). b) Quantification of oligodendrocyte survival. c) Proteomics pipeline. d) Proteins detected in quiescent vs reactive astrocytes (complete proteomics at http://gliaomics.com/). e) Proteins in quiescent vs reactive ACM (red – reactivity markers; purple – lipoproteins, black – classical secreted protein). f) Toxicity of fractions from biochemical purifications of reactive ACM. Arrowheads indicate fraction used for subsequent purification. g) Proteins detected in quiescent vs reactive ACM purified by the columns in f (Supplementary Table 2). h) ELISA quantification of ApoE and ApoJ in quiescent vs reactive ACM. i) Example HPLC trace (black – control, red - reactive, plotted against Absorbance at 280nm - Extended Data Figure 4) of protein abundance in size exclusion HPLC. Traces show Elisa quantification of ApoE (green) and ApoJ (blue) in fractions associated with astrocytic HDLs. (For all: * P<0.05; data represented as mean±s.e.m.; see Supplementary Table 3 for statistics and data reporting).
Figure 2:
Figure 2:. Differentially regulated lipids in reactive astrocytes.
a) Antibody pulldown of ApoE and ApoJ (ApoE/J), but not IgG control, reduces reactive ACM toxicity. b) ACM from reactive astrocytes isolated from WT, ApoE−/−, ApoJ−/−, and ApoE−/−ApoJ−/− mice are similarly toxic. c) Toxic ACM stripped of lipids by a Lipidex 3000 column are not toxic. Reactive ACM lipids eluted from the Lipidex 3000 column, but not HEK conditioned media lipids, are toxic. d) Membranes isolated from reactive astrocytes, but not quiescent astrocytes or HEK cells, are toxic. e) Example image of oligodendrocytes incorporating reconstituted lipoparticles (rHDL) composed of recombinant ApoE/J, ACM lipids, and fluoro-phosphatidylcholine. (scale bar = 100μm). f) rHDL composed of reactive ACM lipids are more toxic than those containing quiescent ACM lipids. g) Pipeline for unbiased lipidomics and metabolomics. h) Reactive (red) and control (black) astrocytes and ACM separate in PCA space by their lipidome. i) Heatmap of differentially-regulated lipids shows saturated, long-chain phospholipids are upregulated in reactive astrocytes and saturated, long-chain FFAs are upregulated in reactive ACM. (For all: * P<0.05; data represented as mean±s.e.m.; see Supplementary Table 3 for statistics and data reporting).
Figure 3:
Figure 3:. Mechanism of cell death from reactive astrocyte conditioned media.
a) Lipoapoptotic cell death pathway. b) Oligodendrocytes treated with toxic ACM undergo lipoapoptosis. c) Western blots quantified in b. d) Example images of oligodendrocytes from PUMA−/− or WT mice treated with toxic ACM demonstrates resistance of PUMA−/− oligodendrocytes to astrocyte-mediated toxicity (scale bar = 100μm). e) Survival quantification of oligodendrocytes isolated from WT, CHOP−/−, and PUMA−/− mice. (For all: * P<0.05; data represented as mean±s.e.m.; see Supplementary Table 3 for statistics and data reporting).
Figure 4:
Figure 4:. Conditional knockout of long-chain saturated lipid synthesis gene Elovl1 reduces reactive astrocyte toxicity.
a) Experimental design for Elovl1 cKO mice. b) Targeted lipidomics showing decrease in long-chain saturated lipids (red) in Elovl1 cKO vs WT reactive astrocytes. c) Example images of oligodendrocytes treated with Elovl1 cKO vs WT ACM (Calcein AM - live cells, ethidium homodimer (Ethd) - dead cells; scale bar = 100μm). d) Quantification of oligodendrocyte survival shows decreased toxicity of Elvol1 cKO vs WT reactive ACM, including when concentrated 10x. e) Reactive ACM and reactive ACM lipid-bearing reconstituted lipoparticles are toxic to retinal ganglion cells (RGCs) in vitro. f) Example images of RGCs (RBPMS) in WT and Elovl1 cKO retinas after optic nerve crush (ONC; scale bar = 50μm). g) Quantification of RBPMS+ RGC number in Elovl1 cKO vs WT retinas after ONC shows astrocyte Elovl1 cKO is neuroprotective. For all: * P<0.05; data represented as mean±s.e.m.; see. Supplementary Table 3 for statistics and data reporting).

References

    1. Liddelow SA & Barres BA Reactive Astrocytes: Production, Function, and Therapeutic Potential. Immunity 46, 957–967 (2017). - PubMed
    1. Liddelow SA et al. Neurotoxic reactive astrocytes are induced by activated microglia. Nature 541, 481–487 (2017). - PMC - PubMed
    1. Guttenplan KA et al. Neurotoxic Reactive Astrocytes Drive Neuronal Death after Retinal Injury. Cell Reports 31, 107776 (2020). - PMC - PubMed
    1. Guttenplan KA et al. Knockout of reactive astrocyte activating factors slows disease progression in an ALS mouse model. Nat Commun 11, 3753 (2020). - PMC - PubMed
    1. Nagai M. et al. Astrocytes expressing ALS-linked mutated SOD1 release factors selectively toxic to motor neurons. Nature neuroscience 10, 615–22 (2007). - PMC - PubMed

METHODS REFERENCES:

    1. Foo LC et al. Development of a Method for the Purification and Culture of Rodent Astrocytes. Neuron 71, 799–811 (2011). - PMC - PubMed
    1. Dugas JC & Emery B Purification of Oligodendrocyte Precursor Cells from Rat Cortices by Immunopanning. Cold Spring Harbor Protocols 2013, pdb.prot070862 (2013). - PubMed
    1. Ullian EM, Sapperstein SK, Christopherson KS & Barres BA Control of Synapse Number by Glia. Science 291, 657–661 (2001). - PubMed
    1. Hedrick VE, LaLand MN, Nakayasu ES & Paul LN Digestion, Purification, and Enrichment of Protein Samples for Mass Spectrometry. Curr Protoc Chem Biology 7, 201–222 (2015). - PubMed
    1. Barabas AJ, Aryal UK & Gaskill BN Proteome characterization of used nesting material and potential protein sources from group housed male mice, Mus musculus. Sci Rep-uk 9, 17524 (2019). - PMC - PubMed

Publication types

MeSH terms

LinkOut - more resources