. 2021 Nov;599(7883):147-151.
doi: 10.1038/s41586-021-03992-4. Epub 2021 Oct 6.

An open-access volume electron microscopy atlas of whole cells and tissues

Affiliations

An open-access volume electron microscopy atlas of whole cells and tissues

C Shan Xu et al. Nature. 2021 Nov.

Erratum in

Abstract

Understanding cellular architecture is essential for understanding biology. Electron microscopy (EM) uniquely visualizes cellular structures with nanometre resolution. However, traditional methods, such as thin-section EM or EM tomography, have limitations in that they visualize only a single slice or a relatively small volume of the cell, respectively. Focused ion beam-scanning electron microscopy (FIB-SEM) has demonstrated the ability to image small volumes of cellular samples with 4-nm isotropic voxels1. Owing to advances in the precision and stability of FIB milling, together with enhanced signal detection and faster SEM scanning, we have increased the volume that can be imaged with 4-nm voxels by two orders of magnitude. Here we present a volume EM atlas at such resolution comprising ten three-dimensional datasets for whole cells and tissues, including cancer cells, immune cells, mouse pancreatic islets and Drosophila neural tissues. These open access data (via OpenOrganelle2) represent the foundation of a field of high-resolution whole-cell volume EM and subsequent analyses, and we invite researchers to explore this atlas and pose questions.


Conflict of interest statement

Competing interests

Portions of the technology described herein are covered by U.S. Patent 10,600,615 titled “Enhanced FIB-SEM systems for large-volume 3D imaging”, which was issued to C.S.X., K.J.H., and H.F.H., and assigned to Howard Hughes Medical Institute on March 24, 2020. The other authors declare no competing interests.

Figures

Extended Data Fig. 1
Extended Data Fig. 1. Isotropic voxel (representing the minimal voxel size dictated by the worst-case axial resolution) vs. volume for comparing different volume EM methods.
The light green space represents the Resolution-Volume regime accessible with enhanced FIB-SEM technology through long term imaging. The present work of whole cell volumes colored in yellow matches the resolutions at 4-nm isotropic voxels shown in Fig. 1b, compared to the prior work of smaller volumes colored in red. Adopted from Xu et al., 2017 with modifications.
Extended Data Fig. 2
Extended Data Fig. 2. Murine CTL engaging an ovarian cancer cell.
Zooms on regions showing different immunological synapse topology features. a, Interdigitation, b, Flat apposition, and c, Filopodia caught between cells. Scale bars, 0.5 μm.
Extended Data Fig. 3
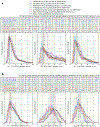
Extended Data Fig. 3. Edge transition distributions determined from ribosomes in cultured cells datasets.
a, Distributions of 37%–63% transition distances in X-, Y- (left), Ztop-(center), and Zbot- (right) directions. b, Distributions of 20%–80% transition distances in X-, Y- (left), Ztop-(center), and Zbot- (right) directions.
Extended Data Fig. 4
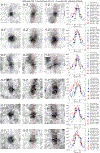
Extended Data Fig. 4. Cross-sections of the example of ribosomes from the dataset Interphase HeLa Cell 2017-06-21 and the profiles with the transition analysis.
The top three rows are the brightest ribosomes and the bottom three rows are the dimmest ribosomes.
Extended Data Fig. 5
Extended Data Fig. 5. Cross-sections of the example of ribosomes from the dataset Interphase HeLa Cell 2017-08-09 and the profiles with the transition analysis.
The top three rows are the brightest ribosomes and the bottom three rows are the dimmest ribosomes.
Extended Data Fig. 6
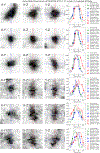
Extended Data Fig. 6. Cross-sections of the example of ribosomes from the dataset Wild-type THP-1 Macrophage 2018-11-11 and the profiles with the transition analysis.
The top three rows are the brightest ribosomes and the bottom three rows are the dimmest ribosomes.
Extended Data Fig. 7
Extended Data Fig. 7. Cross-sections of the example of ribosomes from the dataset Immortalized T-cells (Jurkat) 2018-08-10 and the profiles with the transition analysis.
The top three rows are the brightest ribosomes and the bottom three rows are the dimmest ribosomes.
Extended Data Fig. 8
Extended Data Fig. 8. Cross-sections of the example of ribosomes from the dataset Immortalized breast cancer cell (SUM159) 2017-11-21 and the profiles with the transition analysis.
The top three rows are the brightest ribosomes and the bottom three rows are the dimmest ribosomes.
Extended Data Fig. 9
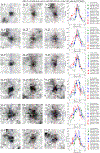
Extended Data Fig. 9. Cross-sections of the example of ribosomes from the dataset Killer T-cell attacking cancer cell 2020-02-04 on Cancer Cell and the profiles with the transition analysis.
The top three rows are the brightest ribosomes and the bottom three rows are the dimmest ribosomes.
Fig. 1
Fig. 1. Enhanced FIB-SEM configuration, operation, and resolution.
a, Sketch of FIB milling and SEM imaging. The two operations iterate alternately to generate 3D whole cell image stacks, b, Resolution characterization using transitions at the edges of gold nanoparticles on a carbon substrate and ribosomes in cultured cells. The vertical dash lines indicate the edge transitions of gold nanoparticles, the round dots indicate the edge transitions of ribosomes along x-y and z axes. Each dot represents the average value from more than 3000 ribosomes in one of the seven cultured cell samples. c–k, Comparison of lower current/higher resolution 4-nm sampling and 8-nm sampling. Left column shows images acquired at 4-nm sampling that matches the resolutions shown in b. The middle column shows the emulated 8-nm images (details in Methods Section), while the right column shows the real 8-nm sampling images. c, Nucleus of the interphase HeLa cell from Fig. 2d shows fine details of chromatin (Ch), nuclear membrane (NM), and nuclear pore (NP). Nucleosomes are less resolved in d, the emulated 8-nm sampling image, and in e, the real 8-nm sampling image of an interphase HeLa cell. f, Golgi (G) cisternae of the interphase HeLa cell from Fig. 2c are better resolved at 4-nm sampling compared to the emulated 8-nm sampling image shown in g and the interphase HeLa cell imaged at 8-nm sampling shown in h. i, Drosophila brain sample from Supplementary Video 1 shows well-resolved hollow core of a microtubule (MT) and the close contact between endoplasmic reticulum (ER) and mitochondria (Mito), which are not distinguishable in j, the emulated 8-nm sampling image. k, The real 8-nm sampling image of blurry microtubules of a Drosophila brain sample with higher shot noise and less resolved microtubules compared to those shown in j. Scale bar, 500 nm in all images.
Fig. 2
Fig. 2. Interphase HeLa cell.
a, FIB-SEM overview with cutaway, and manually segmented interior features (mitochondria, green; centrosomes, red; one cistern of a Golgi stack, magenta; a segment of nuclear membrane, blue, polyribosome chains, yellow). Zoomed in cross-sections of three select areas containing: b, Centrosomes, c, Golgi stack, and d, Nucleus, polyribosomes indicated by arrows, and nuclear pores indicated by asterisks. Scale bars, 1 μm.
Fig. 3
Fig. 3. Murine CTL engaging an ovarian cancer cell.
a, FIB-SEM overview with cutaway, and manually segmented membranes of CTL (green surface and red contour) and cancer cell (cyan surface and blue contour). Zoomed in cross-sections highlight the signatures of a productive immunological synapse: b, CTL cell “cupping” the target cancer cell, c, Polarized centrosome, and d, Lytic granule showing unique ultrastructure. Scale bars, 1 μm.
Fig. 4
Fig. 4. Tissue sample datasets.
a, Pancreatic islets treated with 16.7 mM glucose containing several complete beta cells with detailed structures shown in b, A primary cilium with axoneme (arrow) and centrioles (asterisk), c, Intermingled microvilli (arrow), d, Ultrastructural diversity among insulin SGs containing rod-shaped (arrow) or spherical crystals (asterisk), e, Contacts of ER and insulin SGs (arrow), f, Microtubules (arrow), Golgi apparatus (asterisks) and ribosomes. g, Drosophila fan-shaped body with detailed structures shown in h, Dense-core vesicles of different sizes (arrows), i, Multiple synaptic sites viewed from the side (arrows), j, A presynaptic T-bar viewed from the top (arrow), k, A longitudinal-section view of microtubules (arrows), l, A cross-section view of microtubule arrays (arrows). Scale bars, 1 μm in a, 500 nm in bf, 5 μm in g, and 200 nm in hl.

Comment in

References

    1. Xu CS et al. Enhanced FIB-SEM systems for large-volume 3D imaging. eLife 6:e25916 (2017). 10.7554/eLife.25916 - DOI - PMC - PubMed
    1. Heinrich L et al. Automatic whole cell organelle segmentation in volumetric electron microscopy. bioRxiv 2020.11.14.382143 (2020). 10.1101/2020.11.13.382143 - DOI
    1. Lodish H et al. Molecular Cell Biology (W. H. Freeman, New York, 2016).
    1. Porter KR, Claude A, & Fullam EF A study of tissue culture cells by electron microscopy: methods and preliminary observations. The Journal of experimental medicine, 81(3), 233–246 (1945). 10.1084/jem.81.3.233 - DOI - PMC - PubMed
    1. Denk W, & Horstmann H Serial block-face scanning electron microscopy to reconstruct three-dimensional tissue nanostructure. PLoS Biol 2004, 2:e329 (2004). 10.1371/journal.pbio.0020329 - DOI - PMC - PubMed

Publication types

MeSH terms

LinkOut - more resources