. 2021 Oct;598(7879):167-173.
doi: 10.1038/s41586-021-03223-w. Epub 2021 Oct 6.

Epigenomic diversity of cortical projection neurons in the mouse brain

Affiliations

Epigenomic diversity of cortical projection neurons in the mouse brain

Zhuzhu Zhang et al. Nature. 2021 Oct.

Abstract

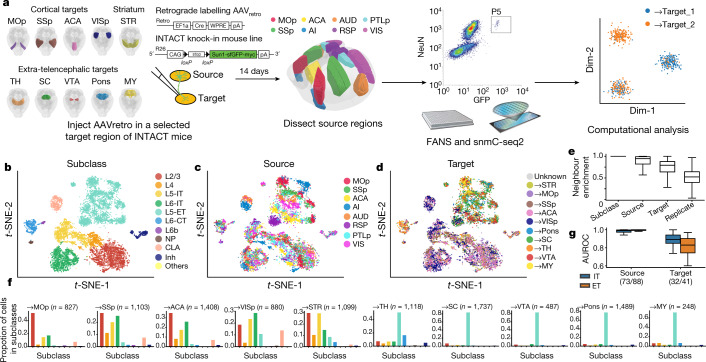
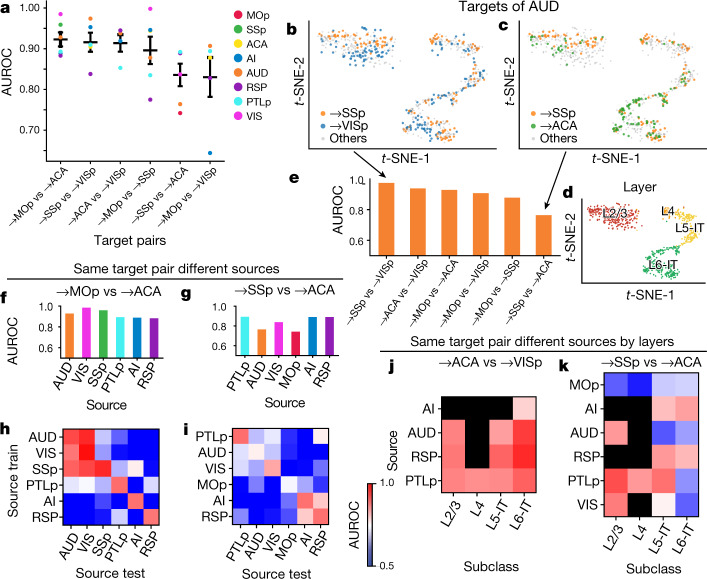
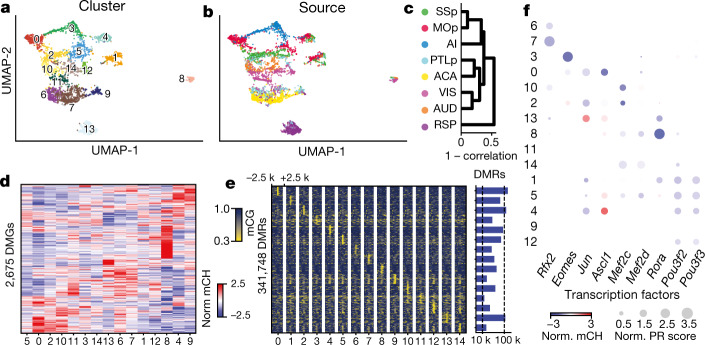
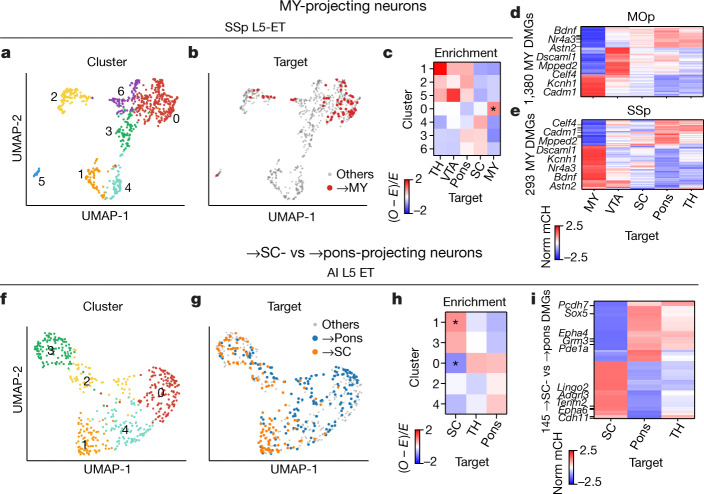
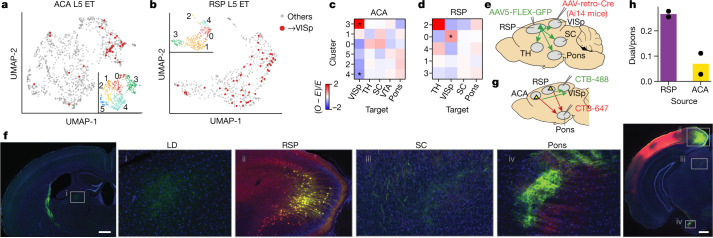
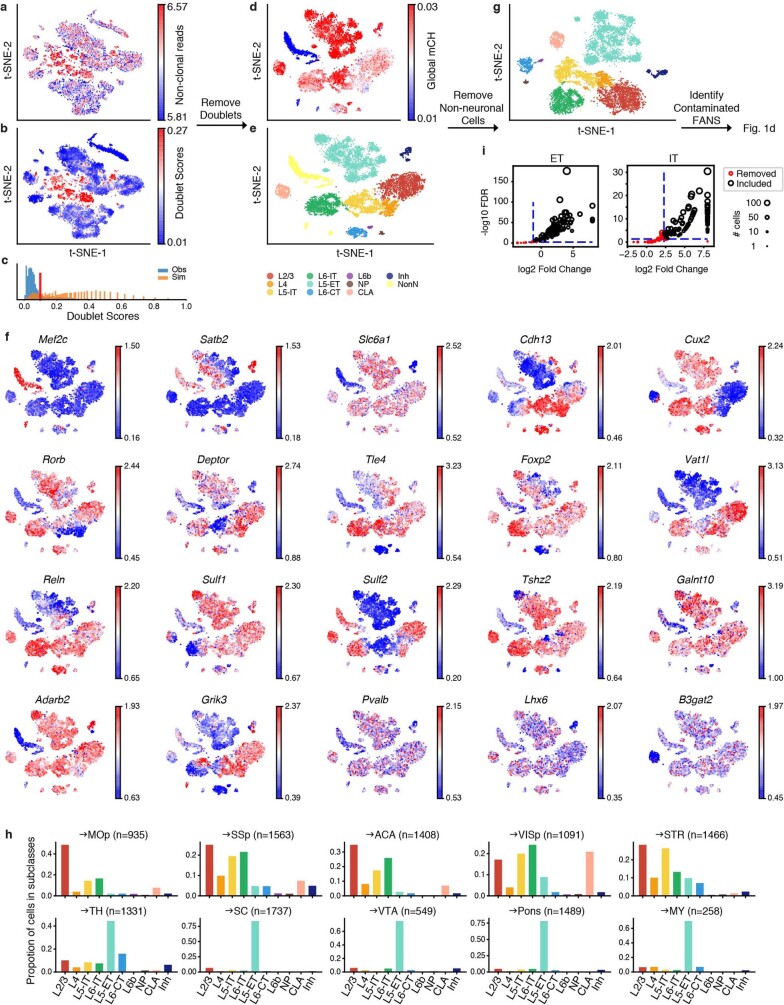
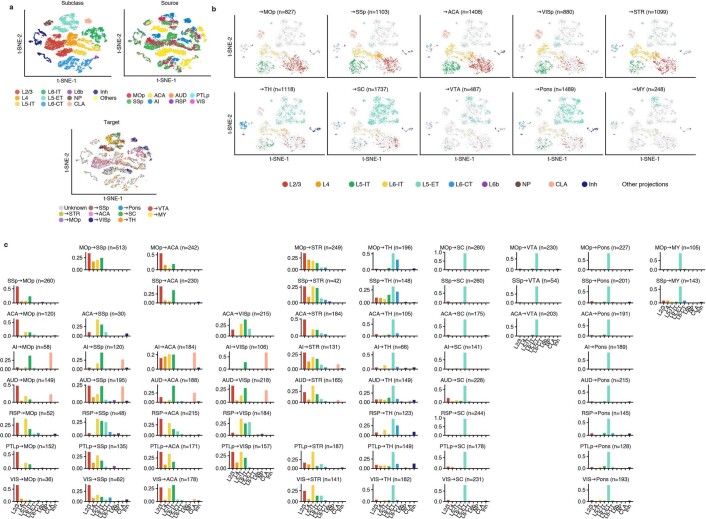
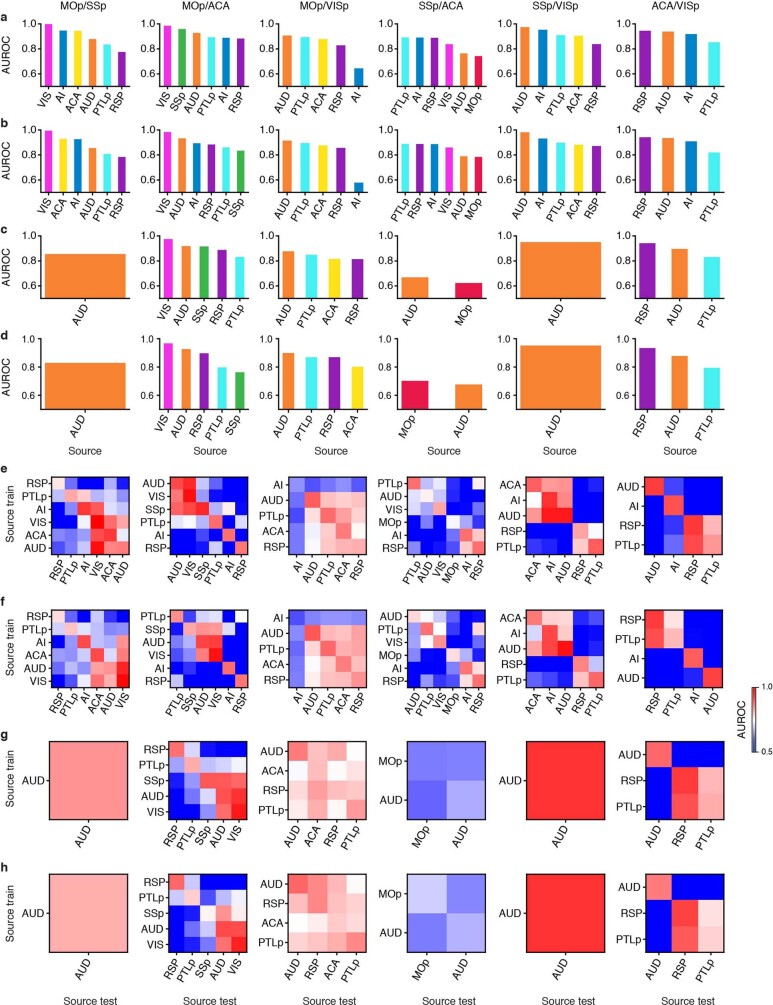
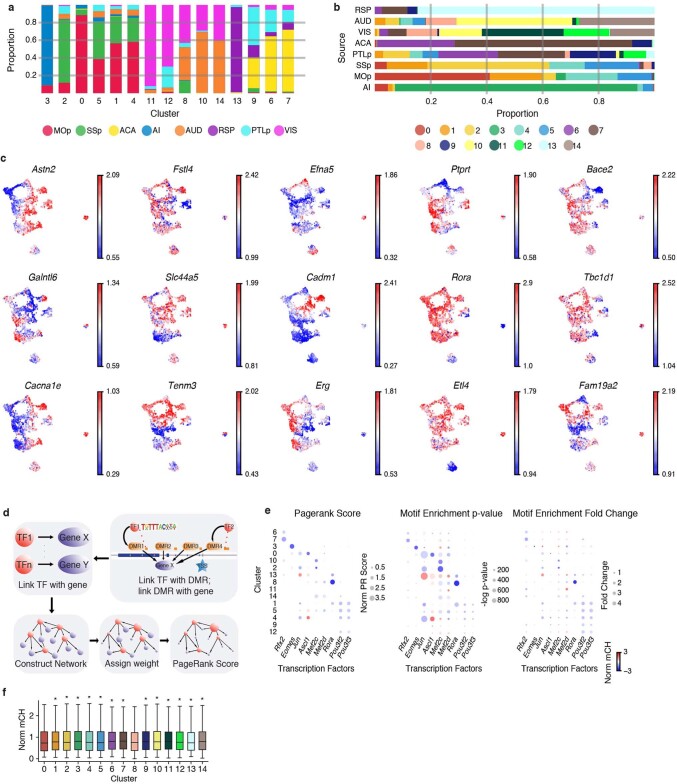
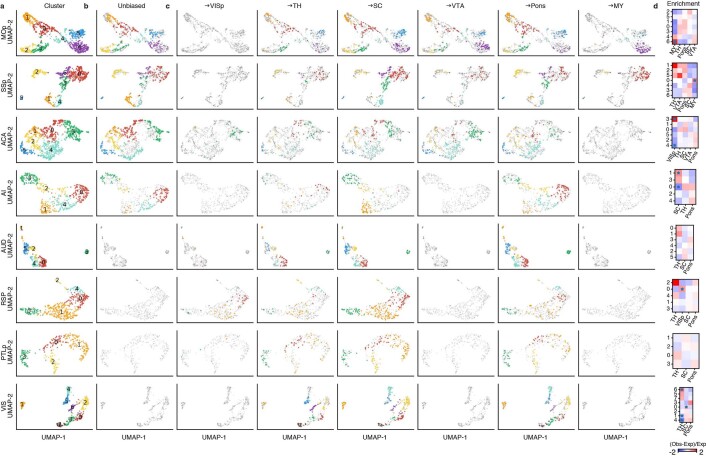
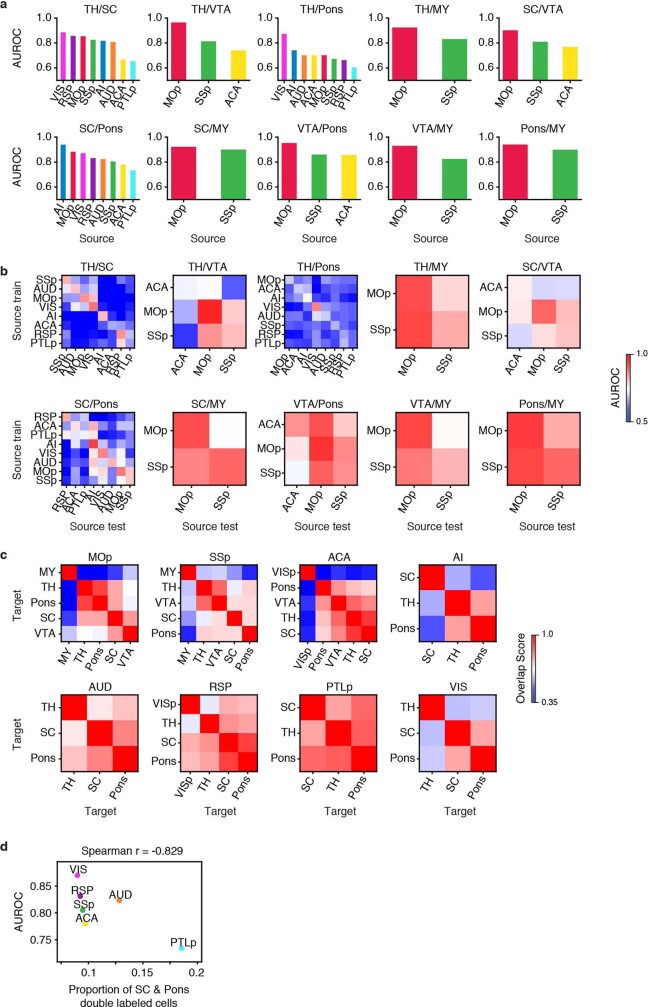
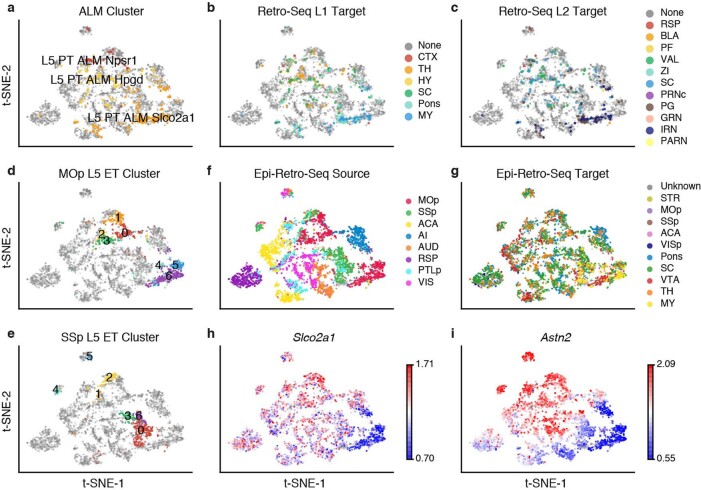
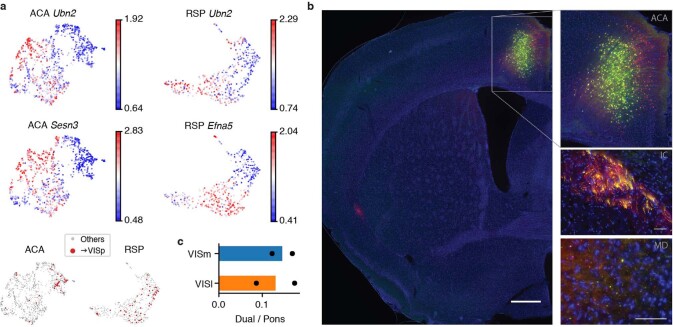
Neuronal cell types are classically defined by their molecular properties, anatomy and functions. Although recent advances in single-cell genomics have led to high-resolution molecular characterization of cell type diversity in the brain1, neuronal cell types are often studied out of the context of their anatomical properties. To improve our understanding of the relationship between molecular and anatomical features that define cortical neurons, here we combined retrograde labelling with single-nucleus DNA methylation sequencing to link neural epigenomic properties to projections. We examined 11,827 single neocortical neurons from 63 cortico-cortical and cortico-subcortical long-distance projections. Our results showed unique epigenetic signatures of projection neurons that correspond to their laminar and regional location and projection patterns. On the basis of their epigenomes, intra-telencephalic cells that project to different cortical targets could be further distinguished, and some layer 5 neurons that project to extra-telencephalic targets (L5 ET) formed separate clusters that aligned with their axonal projections. Such separation varied between cortical areas, which suggests that there are area-specific differences in L5 ET subtypes, which were further validated by anatomical studies. Notably, a population of cortico-cortical projection neurons clustered with L5 ET rather than intra-telencephalic neurons, which suggests that a population of L5 ET cortical neurons projects to both targets. We verified the existence of these neurons by dual retrograde labelling and anterograde tracing of cortico-cortical projection neurons, which revealed axon terminals in extra-telencephalic targets including the thalamus, superior colliculus and pons. These findings highlight the power of single-cell epigenomic approaches to connect the molecular properties of neurons with their anatomical and projection properties.


Conflict of interest statement

J.R.E. serves on the scientific advisory board of Zymo Research Inc.

Figures

Fig. 1
Fig. 1. The epigenomic landscape of cortical projection neurons.
a, Schematics of the epi-retro-seq workflow. SC, superior colliculus; MY, medulla; STR, striatum; TH, thalamus. All brain atlas images were created based on Wang et al. and ©2017 Allen Institute for Brain Science. Allen Brain Reference Atlas. Available from: http://atlas.brain-map.org. bd, Two-dimensional t-SNE of 11,827 cortical neuron nuclei on the basis of mCH levels in 100-kb genomic bins, coloured by subclass (b), the source of neurons (c), or their projection target (d). Inh, inhibitory; NP, near-projecting; CLA, claustrum. e, Neighbour enrichment scores of cells categorized by subclass (n = 11,827), source (n = 11,827), target (n = 10,396) and replicate (n = 11,638). f, The distribution across cell subclasses of neurons that projected to each IT (left) or ET (right) target. g, AUROC of distinguishing between source pairs or target pairs computed for IT and ET neurons on the basis of gene body mCH (n = 73, 88, 32 and 41; from left to right). For all box plots, centre line denotes the median; box limits denote first and third quartiles; and whiskers denote 1.5 × the interquartile range.
Fig. 2
Fig. 2. Epigenetic differences between IT neurons projecting to different targets.
a, AUROC to distinguish cortical neurons projecting to one cortical target versus another. Data are mean ± s.e.m. (n = 6, 5, 4, 6, 6 and 5 sources; left to right). bd, t-SNE of AUD neurons in the IT subclasses (n = 737) coloured by projections (b, c) and subclasses (d). e, AUROC to distinguish AUD neurons projecting to each target pair. f, g, The AUROC for comparisons between MOp and ACA-projecting neurons (f), and between SSp and ACA-projecting neurons (g) from different sources. h, i, Heat maps of AUROC from prediction models that were trained on one source (row) and tested on another source (column) to distinguish between neurons projecting to MOp and ACA (h), or between neurons projecting to SSp and ACA (i). j, k, Heat maps of AUROC from prediction models that were trained and tested on neurons from each cortical layer (column) in each source (row), to distinguish between ACA and VISp-projecting neurons (j), or between SSp and ACA-projecting neurons (k).
Fig. 3
Fig. 3. Epigenetic diversity of L5 ET neurons.
a, b, Fifteen clusters of L5 ET neurons (n = 4,176) shown on the UMAP plot, coloured by cluster (a), or the source of neurons (b). c, Dendrogram shows the correlations between mCH profiles of L5 ET neurons from different sources. d, Gene body mCH levels in each cluster of 2,675 CH-DMGs that were identified in pairwise comparisons between L5 ET clusters. e, A total of 341,748 CG-DMRs were identified across the 15 L5 ET clusters. Left, the mCG levels at CG-DMRs and their 2.5-kb flanking genomic regions in each cluster were visualized in the heat map. Right, the numbers of CG-DMRs hypomethylated in each cluster were plotted in the bar chart. f, Examples of some predicted key regulator transcription factors. The size of each dot represents the normalized PageRank (PR) score of the transcription factor. The colour of the dot represents the gene body mCH of the transcription factor in the corresponding L5 ET cluster.
Fig. 4
Fig. 4. Epigenetic differences between L5 ET neurons projecting to different targets.
a, b, f, g, UMAP of SSp (a, n = 884) or AI (f, n = 531) L5 ET neurons by 100 kb-bin mCH are coloured by clusters (a, f) or projection targets (b, g). c, h, The enrichment of SSp (c) or AI (h) neurons projecting to each target in each cluster (asterisk represents FDR < 0.05). E, expected; O, observed. d, e, i, Gene body mCH levels of the CH-DMGs in the MOp (d) or SSp (e) between neurons projecting to the medulla and other ET targets, or in AI between neurons projecting to the superior colliculus and pons (i). Values are Z-score normalized by rows. Examples of CH-DMGs hypomethylated in both MOp–medulla and SSp–medulla neurons are labelled in d and e.
Fig. 5
Fig. 5. A L5 ET neuron type that projects to both ET and cortical targets.
a, b, UMAP embedding of ACA (a) or RSP (b) L5 ET neurons (n = 1,131 or 516) using mCH in 100-kb bins, coloured by projection targets (ACA–VISp or RSP–VISp in red, n = 36 or 51) or clusters (inset). c, ACA–VISp neurons were enriched in ACA L5 ET cluster 3 and depleted from cluster 4. d, RSP–VISp neurons were enriched in RSP L5 ET cluster 0. Asterisks in c and d indicate FDR < 0.05. e, Illustration of the anatomical experiment to validate the existence of the L5 ET + CC cell type. f, VISp neurons at the AAV-retro-Cre injection site were labelled by tdTomato (red). RSP–VISp neurons were labelled with GFP (green), and RSP–VISp neurons at the AAV5-FLEX-GFP injection site were labelled with both tdTomato and GFP (yellow; inset ‘ii’). Scale bars, 500 μm (low magnification). LD, laterodorsal thalamic nucleus. g, Illustration of injections of dual retrograde tracers (CTB-488 and CTB-647) into the pons and VISp. h, Proportion of double-labelled neurons (projecting to both pons and VISp) among all neurons projecting to the pons in different sources. n = 2 biological replicates are shown as individual points.
Extended Data Fig. 1
Extended Data Fig. 1. Source region dissection maps.
The posterior views of dissected slices are shown. The slices correspond to Allen Reference Atlas level 33–39 (slice 3), 39–45 (slice 4), 45–51 (slice 5), 51–57 (slice 6), 57–63 (slice 7), 69–75 (slice 9), 75–81 (slice 10), 81–87 (slice 11) and 87–93 (slice 12), respectively. All brain atlas images were created based on Wang et al. and © 2017 Allen Institute for Brain Science. Allen Brain Reference Atlas. Available from: http://www.atlas.brain-map.org.
Extended Data Fig. 2
Extended Data Fig. 2. Removing potential doublets and non-neuronal cells.
a, b, t-SNE of cells after quality control (n = 16,971) coloured by number of non-clonal reads (a) and predicted doublet scores (b). c, Distribution of doublet scores for real cells (blue) and simulated doublets (orange). df, t-SNE of cells after removing doublets (n = 13,414), coloured by global mCH (d), subclass (e), or normalized gene-body mCH level of known cell type gene markers (f). Cells with low global mCH level are usually non-neuronal cells. g, t-SNE of single neurons (n = 11,827) coloured by subclass. h, Proportion of single neurons in each subclass for each projection. i, The scatter plots for filtering FANS runs with high contamination. Each dot represents a single run (n = 101 left, 115 right), and the size of the dot represents the number of on-target cells selected by the run.
Extended Data Fig. 3
Extended Data Fig. 3. Cell type composition of all projections.
a, Joint t-SNE of neurons profiled by epi-retro-seq (n = 6,362) and unbiased snmC-seq2 (n = 15,782, without enrichment of projections) from MOp, SSp, ACA and AI, coloured by subclass (top left), source region (top right), and projection targets in epi-retro-seq (bottom). b, t-SNE of neurons (n = 11,827) projecting to each IT target (top) and ET target (bottom). The cells projecting to the target were coloured by subclass and cells that project to all other targets or whose target was not confidently assigned were greyed. c, The proportion of cells projecting from each source (row) to each target (column) in all subclasses.
Extended Data Fig. 4
Extended Data Fig. 4. AUROC of cortical target pairs within and across sources.
ah, AUROC scores of models trained and tested in the same source (ad), or of models tested in all sources after being trained in each one of them (eh). Gene body (a, c, e, g) or 100-kb bin (b, d, f, h) mCH was used as a feature. The training and testing sets were randomly split (a, b, e, f) or split based on biological replicates (c, d, g, h). The values in ad correspond to the diagonals of eh but ordered decreasingly.
Extended Data Fig. 5
Extended Data Fig. 5. AUROC of cortical target pairs within and across layers.
a, d, Demonstration of training and testing data for within layer prediction (a) and cross layer prediction (d). In a, the models were trained and tested in the same layer with different cells. In d, the testing sets were as in a, but the models were trained in all other layers. b, c, e, f, AUROC of within-layer prediction (b, c) or cross-layer prediction (e, f). The training and testing sets were randomly split (b, e) or split based on biological replicates (c, f). Gene level mCH were used for all the predictions. g, Box plots of example CH-DMGs between MOp versus SSp-projecting neurons (left), or between ACA versus VISp-projecting neurons (right). The sample sizes are shown below the x axis. *FDR < 0.1, **FDR < 0.01. Box plots are as in Fig. 1.
Extended Data Fig. 6
Extended Data Fig. 6. Signature genes and transcription factors of L5 ET clusters.
a, Proportion of cells from all sources in each cluster. b, Proportion of cells in all clusters from each source. c, t-SNE of L5 ET cells (n = 4,176) coloured by the normalized gene-body mCH level of cluster gene markers. d, Workflow of the PageRank algorithm to infer crucial transcription factors. e, Gene body mCH (colour) against PageRank score (size, left), motif enrichment P value (size, middle), and motif enrichment fold-change (size, right) for the example transcription factors in all L5 ET clusters. P values were computed by Homer using one-sided binomial tests. f, Gene body mCH in all clusters of Rora target genes identified in cluster 8 (n = 3,299). Significances were determined by comparing cluster 8 with each of the other clusters (two-sided Wilcoxon signed-rank test, Benjamini–Hochberg FDR). *FDR < 1 × 10−2. FDR for all boxes are: 0.60, 1.95 × 10−25, 3.56 × 10−12, 5.24 × 10−29, 1.57 × 10−10, 8.44 × 10−9, 2.94 × 10−32, 3.56 × 10−41, 1.0, 1.16 × 10−35, 5.85 × 10−29, 2.28 × 10−42, 1.47 × 10−28, 6.42 × 10−3 and 1.50 × 10−26 (left to right). Box plots are as in Fig. 1.
Extended Data Fig. 7
Extended Data Fig. 7. Enrichment of different projections in L5 ET clusters.
ac, t-SNE of L5 ET cells from each source coloured by clusters. The coloured cells are all cells (a), unbiased snmC-seq cells (b), and cells projecting to each target (c). Other cells were greyed. d, The enrichment of each projection in each L5 ET cluster in each source. *FDR < 0.05.
Extended Data Fig. 8
Extended Data Fig. 8. AUROC of ET target pairs within and across sources.
a, b, AUROC of models trained and tested in the same source (a) or models tested in all source regions after being trained in each one of them (b) using 100-kb bin mCH as features. Training and testing sets were randomly split. c, Overlap score between each pair of targets in each source. d, The proportion of double-labelled cells versus the AUROC score to distinguish superior colliculus versus pons neurons across sources.
Extended Data Fig. 9
Extended Data Fig. 9. Integration of L5 ET cells from epi-retro-seq and retro-seq.
ac, L5 ET ALM cells in SMART-Seq (n = 365) coloured by clusters (a), major target regions (b), and detailed target regions (c). Epi-retro-seq cells were greyed. di, L5 ET cells in epi-retro-seq from all source regions (n = 4,176) coloured by MOp clusters (d), SSp clusters (e), sources (f), targets (g), and gene body mCH of Slco2a1 (h) and Astn2 (i).
Extended Data Fig. 10
Extended Data Fig. 10. Validation of L5 ET + CC neurons.
a, UMAP of ACA (n = 1,131) and RSP (n = 516) L5 ET cells, coloured by gene body mCH of example genes. Ubn2 shows hypomethylation in the cluster enriching neurons projecting to the VISp in both ACA and RSP, whereas Sesn3 and Efna5 are hypomethylated in the cluster only in ACA or RSP, respectively. VISp-projecting cells are shown in red at the bottom. b, By injecting AAV-retro-Cre in the VISp and AAV-FLEX-GFP in the ACA, the axon terminals of ACA–VISp neurons were also observed in the internal capsule (IC) and mediodorsal nucleus of thalamus (MD). Scale bars, 500 μm (left) and 50 μm (right in IC and MD). c, The proportion of double-labelled neurons that project to both VISp and pons, out of neurons projecting to pons in medial and lateral visual cortex (VISm and VISl, respectively). n = 2 biological replicates are shown as individual points.

References

    1. Mukamel EA, Ngai J. Perspectives on defining cell types in the brain. Curr. Opin. Neurobiol. 2019;56:61–68. doi: 10.1016/j.conb.2018.11.007. - DOI - PMC - PubMed
    1. Economo MN, et al. Distinct descending motor cortex pathways and their roles in movement. Nature. 2018;563:79–84. doi: 10.1038/s41586-018-0642-9. - DOI - PubMed
    1. Chen X, et al. High-throughput mapping of long-range neuronal projection using in situ sequencing. Cell. 2019;179:772–786.e19. doi: 10.1016/j.cell.2019.09.023. - DOI - PMC - PubMed
    1. Klingler, E., Prados, J., Kebschull, J. M., Dayer, A. & Zador, A. M. Single-cell molecular connectomics of intracortically-projecting neurons. Preprint at 10.1101/378760 (2018).
    1. Kim D-W, et al. Multimodal analysis of cell types in a hypothalamic node controlling social behavior. Cell. 2019;179:713–728.e17. doi: 10.1016/j.cell.2019.09.020. - DOI - PMC - PubMed

Publication types