. 2021 Oct;598(7879):103-110.
doi: 10.1038/s41586-021-03500-8. Epub 2021 Oct 6.

A transcriptomic and epigenomic cell atlas of the mouse primary motor cortex

Zizhen Yao #  1 Hanqing Liu #  2 Fangming Xie #  3 Stephan Fischer #  4 Ricky S Adkins  5 Andrew I Aldridge  2 Seth A Ament  5 Anna Bartlett  2 M Margarita Behrens  6 Koen Van den Berge  7   8 Darren Bertagnolli  1 Hector Roux de Bézieux  9 Tommaso Biancalani  10 A Sina Booeshaghi  11 Héctor Corrada Bravo  12 Tamara Casper  1 Carlo Colantuoni  13   14   15 Jonathan Crabtree  5 Heather Creasy  5 Kirsten Crichton  1 Megan Crow  4 Nick Dee  1 Elizabeth L Dougherty  10 Wayne I Doyle  16 Sandrine Dudoit  7 Rongxin Fang  17 Victor Felix  5 Olivia Fong  1 Michelle Giglio  5 Jeff Goldy  1 Mike Hawrylycz  1 Brian R Herb  5 Ronna Hertzano  5   18 Xiaomeng Hou  19 Qiwen Hu  20 Jayaram Kancherla  12 Matthew Kroll  1 Kanan Lathia  1 Yang Eric Li  21 Jacinta D Lucero  6 Chongyuan Luo  2   22   23 Anup Mahurkar  5 Delissa McMillen  1 Naeem M Nadaf  10 Joseph R Nery  2 Thuc Nghi Nguyen  1 Sheng-Yong Niu  2 Vasilis Ntranos  24 Joshua Orvis  5 Julia K Osteen  6 Thanh Pham  1 Antonio Pinto-Duarte  6 Olivier Poirion  19 Sebastian Preissl  19 Elizabeth Purdom  7 Christine Rimorin  1 Davide Risso  25 Angeline C Rivkin  23 Kimberly Smith  1 Kelly Street  26 Josef Sulc  1 Valentine Svensson  11 Michael Tieu  1 Amy Torkelson  1 Herman Tung  1 Eeshit Dhaval Vaishnav  10 Charles R Vanderburg  10 Cindy van Velthoven  1 Xinxin Wang  19   27 Owen R White  5 Z Josh Huang  28 Peter V Kharchenko  20 Lior Pachter  11 John Ngai  29 Aviv Regev  10   30 Bosiljka Tasic  1 Joshua D Welch  31 Jesse Gillis  4 Evan Z Macosko  10 Bing Ren  19   21 Joseph R Ecker  2   23 Hongkui Zeng  32 Eran A Mukamel  33
Affiliations

A transcriptomic and epigenomic cell atlas of the mouse primary motor cortex

Zizhen Yao et al. Nature. 2021 Oct.

Abstract

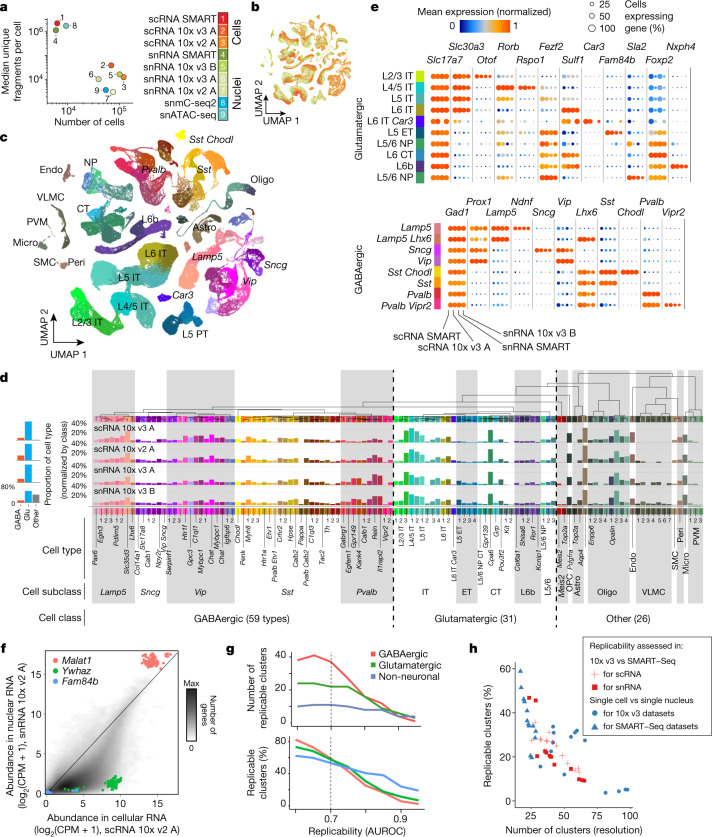
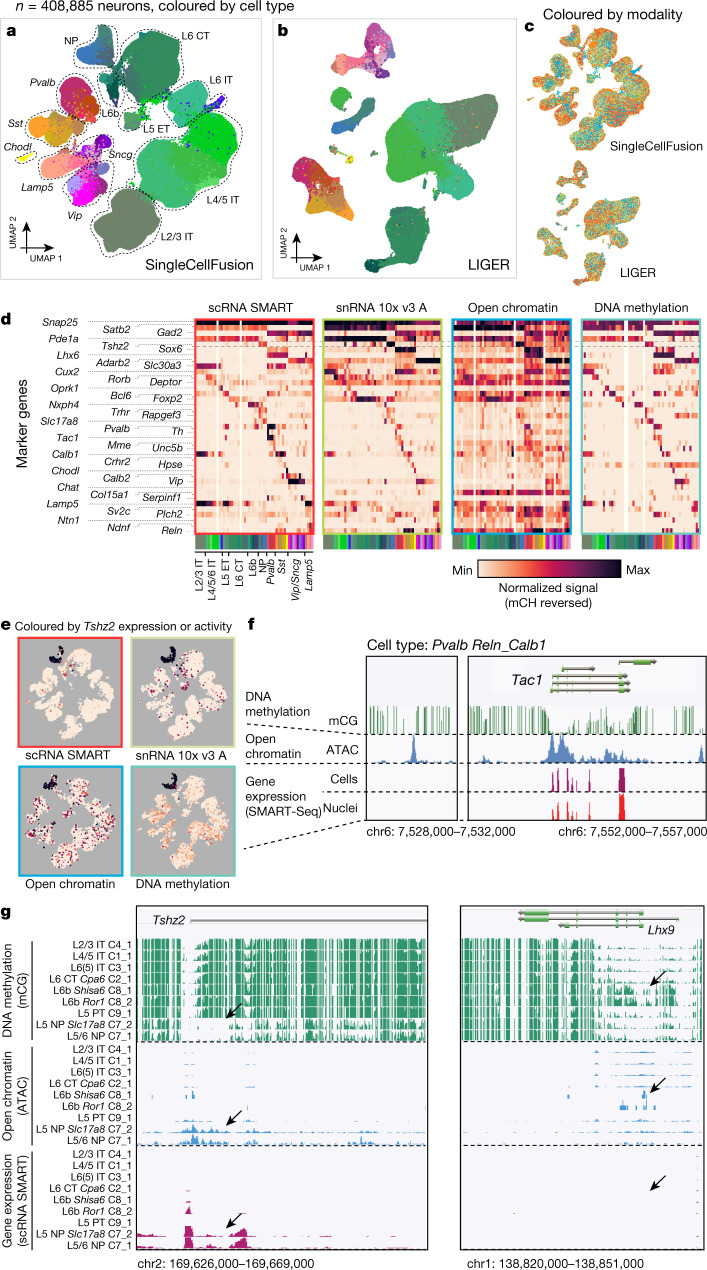
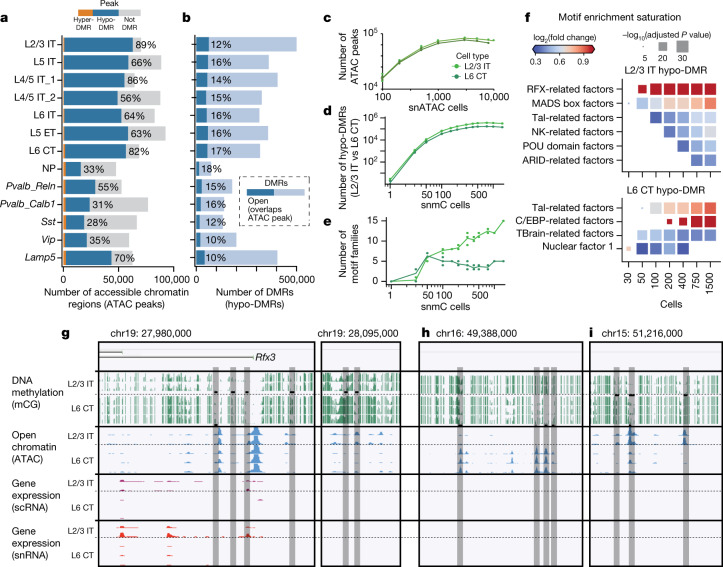
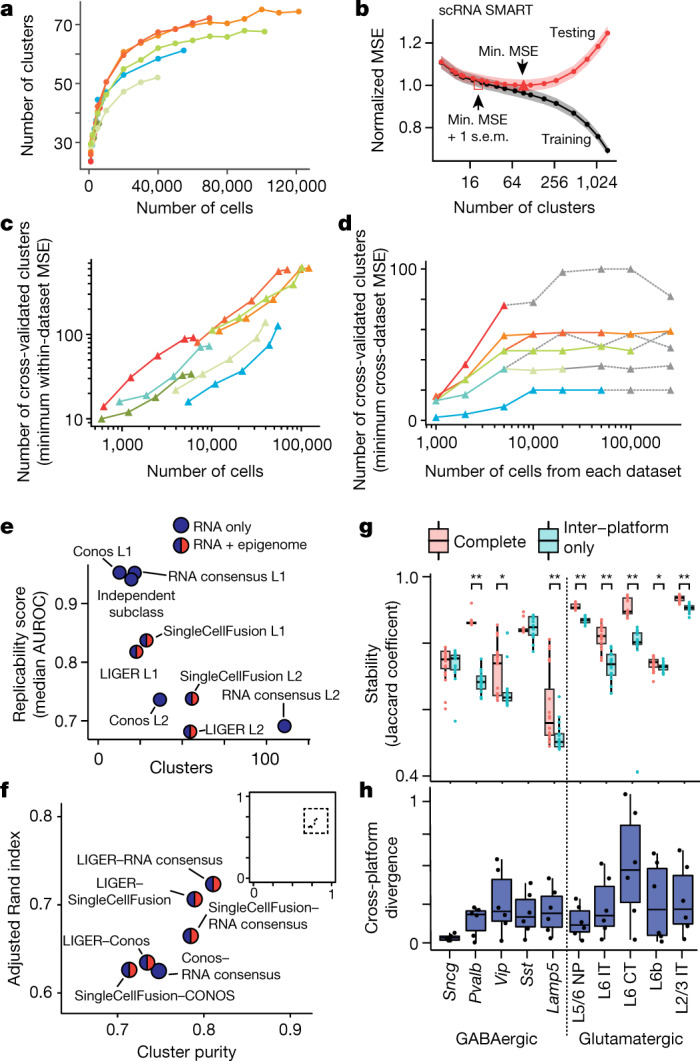
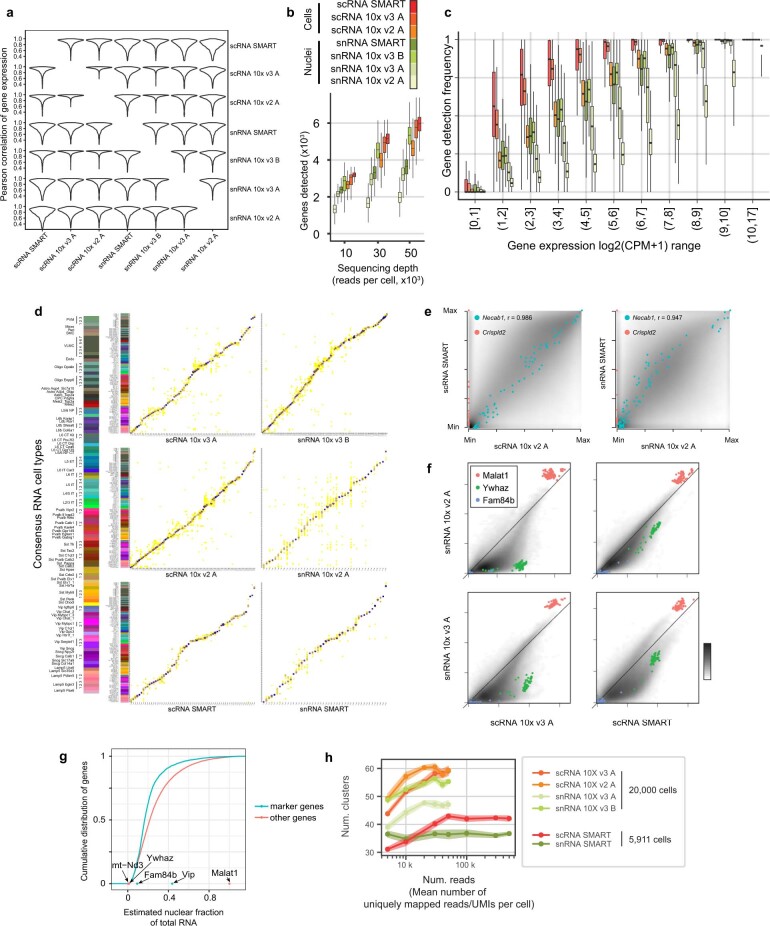
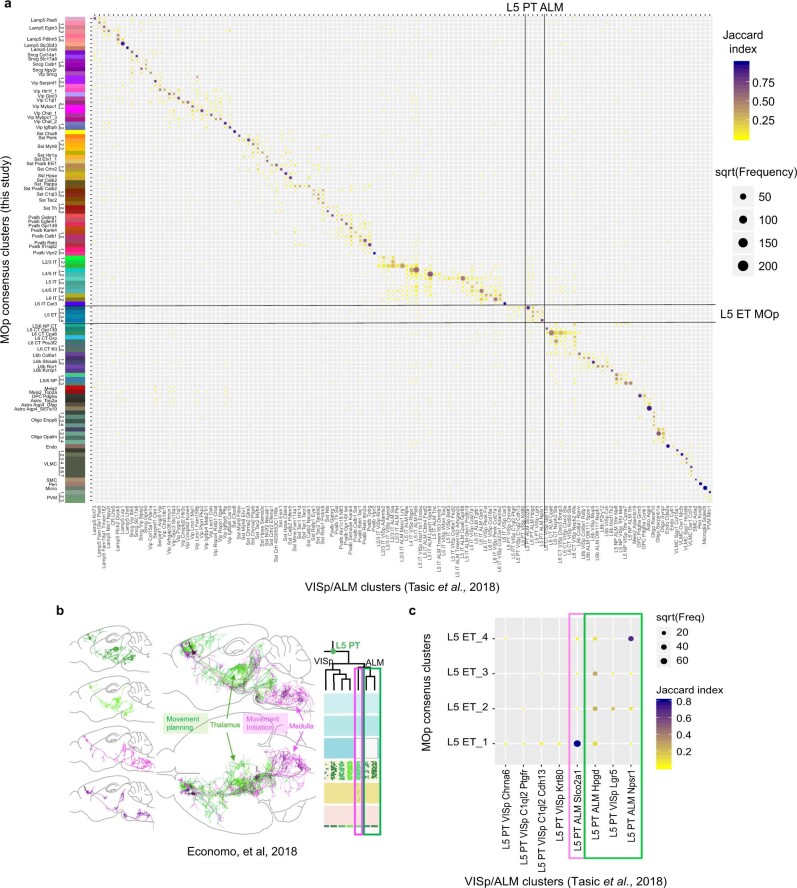
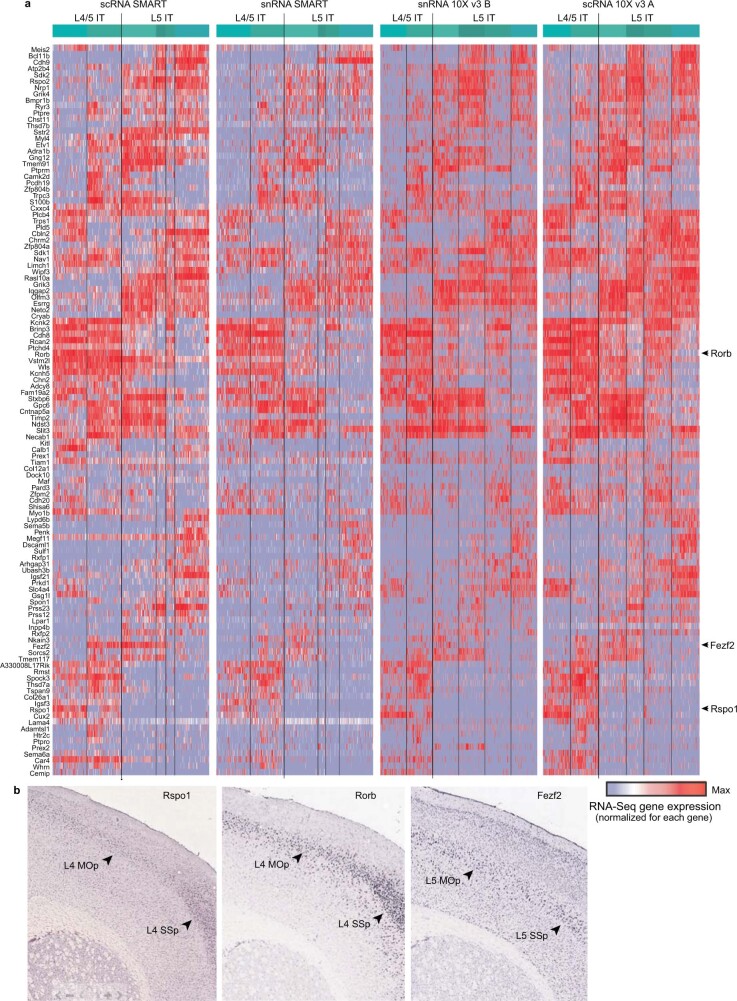
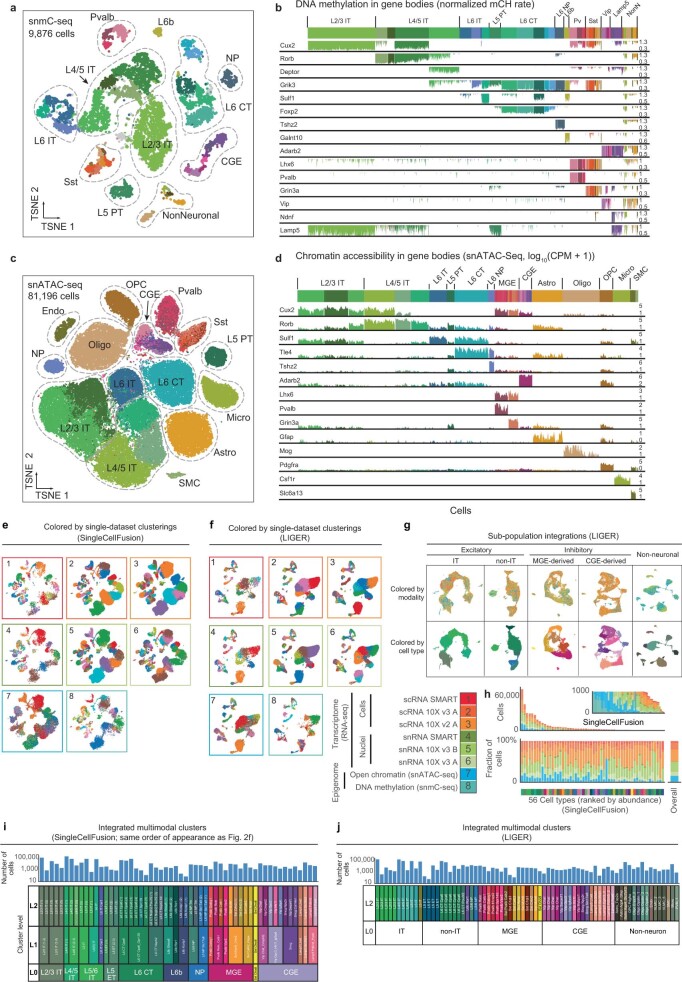
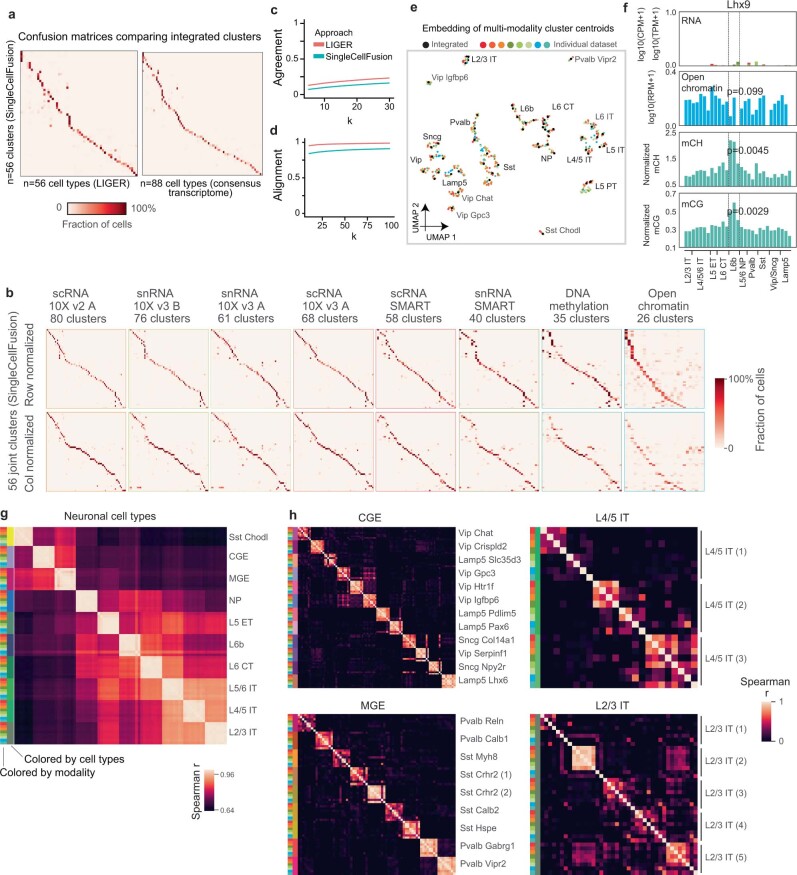
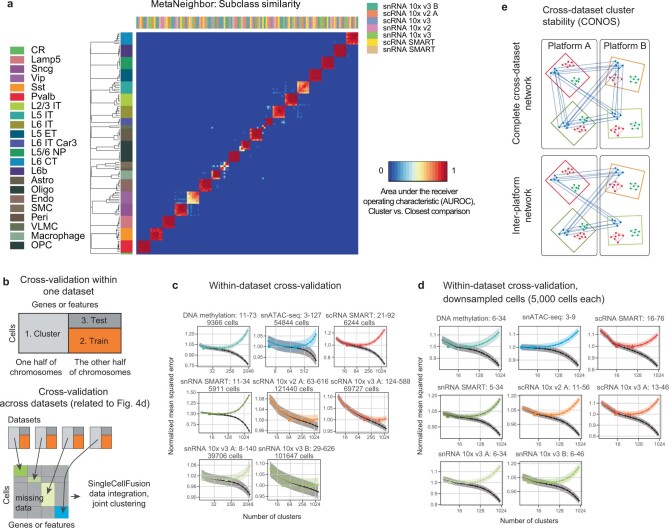
Single-cell transcriptomics can provide quantitative molecular signatures for large, unbiased samples of the diverse cell types in the brain1-3. With the proliferation of multi-omics datasets, a major challenge is to validate and integrate results into a biological understanding of cell-type organization. Here we generated transcriptomes and epigenomes from more than 500,000 individual cells in the mouse primary motor cortex, a structure that has an evolutionarily conserved role in locomotion. We developed computational and statistical methods to integrate multimodal data and quantitatively validate cell-type reproducibility. The resulting reference atlas-containing over 56 neuronal cell types that are highly replicable across analysis methods, sequencing technologies and modalities-is a comprehensive molecular and genomic account of the diverse neuronal and non-neuronal cell types in the mouse primary motor cortex. The atlas includes a population of excitatory neurons that resemble pyramidal cells in layer 4 in other cortical regions4. We further discovered thousands of concordant marker genes and gene regulatory elements for these cell types. Our results highlight the complex molecular regulation of cell types in the brain and will directly enable the design of reagents to target specific cell types in the mouse primary motor cortex for functional analysis.


Conflict of interest statement

B.R. is a shareholder of Arima Genomics, Inc. P.V.K. serves on the Scientific Advisory Board to Celsius Therapeutics, Inc. A.R. is an equity holder and founder of Celsius Therapeutics, an equity holder in Immunitas, and a Scientific Advisory Board member to Syros Pharmaceuticals, Neogene Therapeutics, Asimov and Thermo Fisher Scientific.

Figures

Fig. 1
Fig. 1. Multi-platform transcriptomic taxonomy of the cell types in the MOp.
a, Key attributes of nine single-cell transcriptomic and epigenomic datasets from the mouse MOp. b, c, Two-dimensional projection (uniform manifold approximation and projection (UMAP)) of cells and nuclei based on integrated analysis of seven transcriptomic (scRNA-seq and snRNA-seq) datasets. Cells and nuclei are coloured by dataset (b) using the colours shown in a, or by cell type (c). Non-neuronal cell types are depleted owing to the sampling strategy, which enriched neurons in all datasets except snRNA 10x v3 B. d, Dendrogram showing a hierarchical relationship among the consensus transcriptomic cell types and a proportion of cells of each type per dataset, normalized within major classes. Glu, glutamatergic. e, Expression of selected marker genes for excitatory (top) and inhibitory (bottom) cell classes, across four platforms. f, Differential enrichment of transcripts in single cells versus single nuclei. The long non-coding RNA Malat1 is enriched in nuclei. CPM, counts per million reads mapped. g, The number of replicable clusters across at least two of the seven scRNA-seq and snRNA-seq datasets as a function of the minimal MetaNeighbor score (AUROC). h, The trade-off between the number of clusters and replicability (the per cent of clusters with minimal MetaNeighbor replicability score). The major inhibitory neuron subclasses are Lamp5, Sncg, Vip, Sst and Pvalb. Astro, astrocyte; CT, corticothalamic; endo, endothelial; ET, extratelencephalically projecting; IT, intratelencephalically projecting; micro, microglial cell; NP, near-projecting; oligo, oligodendrocyte; OPC, oligodendrocyte precursor cell; peri, pericyte; PVM, perivascular macrophage; SMC, smooth muscle cell; VLMC, vascular leptomeningeal cell.
Fig. 2
Fig. 2. Integration of epigenomes and transcriptomes.
a, b, Two-dimensional projection (UMAP) of more than 400,000 individual cells and nuclei from eight transcriptomic and epigenomic datasets (excluding snRNA 10x v2 A), integrated using SingleCellFusion (a) or LIGER (b). Cells are coloured by joint clustering assignments from the respective integration method. c, UMAP projection with cells coloured by dataset (colour scheme as in Fig. 1a). d, Selected marker genes across data modalities. The grey dashed box highlights the gene Tshz2. e, UMAP embeddings coloured by the level of mRNA expression, accessibility or DNA methylation at Tshz2. f, Browser view of the Tac1 locus comparing four datasets with base-resolution transcriptomic and epigenomic information for one cell type: Pvalb Reln_Calb1. See https://bit.ly/2Hhb0VY. Chr6, chromosome 6. g, Browser showing excitatory cell-type tracks. Tshz2 consistently marks L5 NP cell types across data modalities, while Lhx9 has a unique epigenetic signature in L6b cell types in DNA methylation only. The black arrows show cell-type-specific demethylation, open chromatin or gene expression. See https:bit.ly/3bABMX2 for Tshz2 and https://bit.ly/2HioFMv for Lhx9.
Fig. 3
Fig. 3. Epigenomic signatures of regulatory elements in the MOp.
a, b, Regulatory regions were identified in each cell type using DMRs (n = 1,302,403) (a) and open chromatin regions (ATAC peaks; n = 316,788) (b) in multimodal integrated clusters. c, d, Saturation analysis for two excitatory subclasses shows the number of regulatory regions detected as a function of sampled cells. e, Saturation analysis of the number of transcription factor DNA-binding sequence motifs enriched in DMRs of each cell type. f, Enrichment of motifs for selected transcription factor families as a function of the number of cells sampled. g, Browser views of loci containing cell-type-specific regulatory elements (grey highlighted regions). The Rfx3 gene is differentially expressed in L2/3 neurons and has an enhancer specific to L2/3 located approximately 15 kb upstream of the promoter region. h, i, Examples of intergenic regions with accessibility and demethylation specific to L6 CT (h) or L2/3 (i) neurons. The black bars indicate predicted regulatory regions.
Fig. 4
Fig. 4. Robustness and reproducibility of cell types within and across datasets.
a, The number of clusters estimated for each dataset after sampling a fraction of the total cells (Leiden clustering, resolution r = 6; colour scheme as in Fig. 1a). b, Mean squared error (MSE) as a function of the number of clusters for scRNA SMART-Seq. The minimum MSE and the minimum MSE + 1 s.e.m. define a range of optimal cluster resolutions. The shaded region shows the s.e.m. derived from cross-validation with n = 5 random data partitions. c, d, The number of clusters estimated by within-dataset (c) or across-dataset (d) cross-validation (n = 5 data partitions) (colour scheme as in Fig. 1a). For cross-dataset comparison (d), the number of clusters is based on the minimum test MSE for one dataset after joint multimodal clustering. The grey dotted lines are shown when the number of cells (x axis) exceeds the dataset size, in which case all of the cells from the corresponding modality were used. e, The trade-off between the number of clusters and replicability (median MetaNeighbor AUROC) of consensus clustering methods applied at various resolutions. f, Agreement between consensus clustering results using different computational procedures. Inset: zoomed-out view showing that all methods have high cluster purity and adjusted Rand index. g, Transcriptomic platform consistency is assessed by cross-dataset cluster stability analysis (Conos) using complete networks, and using inter-platform edges only. Glutamatergic and Pvalb subclasses have reduced stability in inter-platform comparison. Data points show n = 20 independent random samples, each containing 95% of the total cells. h, Cross-platform expression divergence (Jensen–Shannon) for major cell subclasses. The box-and-whisker plots (g, h) show the median, the interquartile range (25–75th percentile), and the smaller of the data range (minimum to maximum) or the 1.5 times the interquartile range. *False discovery rate (FDR) ≤ 0.05, **FDR ≤ 0.0001, Wilcoxon rank-sum test, Benjamini–Hochberg correction.
Extended Data Fig. 1
Extended Data Fig. 1. A multimodal molecular cell-type atlas of the MOp.
a, Anatomical location of the mouse MOp in the Allen Mouse Brain Common Coordinate Framework (CCFv3) in 3D and in representative sagittal and coronal sections. bd, Documentation of MOp samples collected at the Allen Institute (b), the Broad Institute (c) and the Salk Institute (d). Each panel shows a diagram of coronal brain slices and dissected regions for transcriptomic (scRNA-seq and snRNA-seq) and epigenomic (snATAC and snmC-seq2) data samples based on the Allen Mouse Brain Common Coordinate Framework (CCF). Nissl-stained images in d show the posterior face of tissue slices (600 μm thickness). e, Number of cells and median number of unique sequenced DNA or RNA fragments per cell in each of the nine single-cell transcriptomic and epigenomic datasets. The squares show the extrapolated total library size based on the sequence duplication rate. f, Number of cells in each of the major cell classes (glutamatergic excitatory, GABAergic inhibitory neurons and non-neurons) of each dataset. Differences in cell-type sampling strategy, including the use of cell sorting to enrich neurons, affect the relative number of neurons and non-neuronal cells. Datasets include cells from the following numbers of mice (Supplementary Table 1): scRNA SMART: n = 28 male, 17 female; scRNA 10x v3 A: n = 3 male, 3 female; scRNA 10x v2 A: n = 3 male; snRNA SMART: n = 8 male, 2 female; snRNA 10x v3 B: n = 5 male, 6 female; snRNA 10x v2: n = 2 male, 1 female; snRNA 10x v3 A: n = 1 female; snmC-seq2 and snATAC-seq: n = 2 replicates, each pooled from 6 to 30 male mice. g, NeMO Analytics (nemoanalytics.org) visualization and analysis environment for the BICCN mouse molecular mini-atlas. Screenshot of NeMO Analytics showing multi-omic results for glutamate decarboxylase 2 (Gad2), a marker gene in inhibitory neurons. The web portal has the following features: (1) search box for gene names; (2) indicator of the gene viewed; (3) expandable species-specific functional annotation; (4) link-outs to additional resources for the selected gene; (5–7) interactive visualizations of each BICCN dataset, displayed in a ‘standalone’ box showing gene expression and cell clustering on integrated UMAP coordinates. Additional data exploration options for each of the datasets are available via the drop-down menu at the upper right corner of the NeMO Analytics dataset titles. (8) An embedded Epiviz interactive workspace to visualize scATAC-seq and sncMethyl-seq datasets in a linear browser view (8a), here showing the average ATAC and % CG methylation at the Gad2 locus (8c, 8d) as well as in each major cluster of glutamatergic and GABAergic neurons (8b, 8e, 8f). Epigenomic data are also available at http://epiviz.nemoanalytics.org/biccn_mop, and instructions for setting up and extending the Epiviz workspaces are available at http://github.com/epiviz/miniatlas. h, Brainome epigenomics portal (https://brainome.ucsd.edu/BICCN_MOp). The portal shows single-base resolution epigenomic and transcriptomic data (snmC-seq2, snATAC-seq, scRNA-seq and snRNA-seq) using the AnnoJ browser. Drop-down menus allow the user to select groups of cells (for example, excitatory, inhibitory and MGE-derived, among others), modalities (mCG, mCA, ATAC, scRNA, snRNA and enhancers) and display options. A Cell Browser allows visualization of scatter plots and heat maps of groups of genes across data modalities.
Extended Data Fig. 2
Extended Data Fig. 2. Cluster membership and gene expression consistency across scRNA-seq and snRNA-seq datasets.
a, Pearson correlation of gene expression of 3,792 cell-type-specific marker genes across cell types between every pair of datasets. Each violin plot shows the distribution of correlation values for all genes between a pair of datasets. Most genes have highly conserved gene expression patterns at the cell-type level among all datasets (average correlation of 0.856 across all pairs of comparisons). The most consistent datasets are scRNA 10x v2 and v3 (average correlation of 0.95), while snRNA 10x v3 B is also highly similar to both scRNA 10x v2 and v3 datasets. Overall, we found the differences between single-cell and single-nucleus datasets to be more significant than SMART-Seq versus 10x platform differences. b, Number of genes detected per cell or nucleus by each transcriptomic assay as a function of sequencing depth, as determined by downsampling analysis (n = 79 independent biological samples; see Supplementary Table 1). c, Gene detection frequency (sensitivity) at each gene expression range for each dataset (n = 79 independent biological samples; see Supplementary Table 1). Expression of all genes in each cell type was binned based on the average logCPM in scRNA 10x v2 and snRNA 10x v3 B datasets. Single-cell datasets overall have higher sensitivity for gene expression than single-nucleus datasets, with the exception of the snRNA 10x v3 B dataset, which was more sensitive than the scRNA 10x v2 A dataset. For weakly expressed genes, the gene detection frequency can vary dramatically between datasets. For these genes, scRNA SMART was the most sensitive, followed by 10x v3 datasets, all of which showed very robust gene detection. Note that sequencing depth was not considered for this analysis. For b, c, box-and-whisker plots show the median, the interquartile range (IQR) (25–75th percentile), and the whiskers show the smaller of the data range (minimum to maximum) or 1.5 times the IQR. d, Comparisons between clustering analysis of individual datasets with the consensus clusters derived from seven transcriptomic datasets. The size of the dot indicates the number of overlapping cells, and the colour of the dot indicates the Jaccard index (number of cells in intersection/number of cells in union) between the independent and joint clusters. e, Comparison of the relative gene expression of marker genes across all cell types between corresponding SMART-Seq and 10x v2 datasets. To compare gene expression directly between SMART-Seq and 10x datasets, which differ in experimental platforms, gene expression quantification software and gene annotation reference, for each gene, we normalized the average log2(CPM + 1) values at the cluster level in the range [0,1] by subtracting the minimum value and then dividing by the maximum value for that gene. The smooth scatter plot corresponds to the normalized gene expression for all marker genes across all types in two datasets, with their overall Pearson correlation (across all marker genes and cell types) highlighted. f, Differential enrichment of transcripts in single cells (x axis) versus single nuclei (y axis) across four platforms. Non-coding RNAs such as Malat1 are enriched in nuclei. g, Distribution of the estimated nuclear localization fraction for all mRNAs based on comparison of the snRNA and scRNA 10x v2 datasets. To calibrate the differences among cell types, we sampled the same number of cells in each cluster for both datasets, and aggregated all the cells for estimation. We plot the empirical cumulative density function for the marker genes and all other genes separately. The fraction of nuclear mRNAs for five selected genes are shown along the x axis. As expected, mitochondrial genes such as mt-Nd3 have almost no nuclear localization, whereas Vip is significantly enriched in the nucleus. A selected set of 3,792 cell-type-specific marker genes (see Methods section ‘Marker gene selection’) have a lower nuclear fraction relative to the other genes (median 16.6%, compared with 21.9% for non-marker genes). h, Cluster resolution analysis, showing the number of clusters identified in each transcriptomic dataset with a fixed cluster procedure and resolution (r = 6) as a function of the number of sequenced reads, and using the same number of cells for each of the 10x or SMART-Seq datasets. The shaded region shows the s.e.m. from cross-validation with n = 5 independent data partitions.
Extended Data Fig. 3
Extended Data Fig. 3. Correspondence between the MOp consensus RNA-seq cell-type taxonomy and previously published VISp/ALM cell-type taxonomy.
a, Cells from all scRNA and snRNA MOp datasets were mapped to the most correlated VISp/ALM cell types based on VISp/ALM cell-type markers. The size of the dots indicates the number of overlapping cells, and the colour indicates the Jaccard index (number of cells in intersection/number of cells in union). MOp L5 ET types are mapped predominantly to L5 pyramidal tract (PT) ALM types in the VISp/ALM study. Note that we have adopted the nomenclature ‘extratelencephalically projecting (ET)’ for these neurons, instead of the previously used ‘pyramidal tract (PT)’, owing to the fact that not all of these neurons project to the pyramidal tract leading to the spinal cord. b, Three L5 PT ALM types can be divided into two groups with distinct projection patterns. Cells in the pink group project to the medulla and have been functionally associated with movement initiation, while the cells in the green group project to the thalamus, associated with movement planning. Adapted from Economo et al. (2018). c, Enlarged view of the correspondence between MOp L5 ET types and VISp/ALM L5 PT types. Two subsets of medulla-projecting (pink) and thalamus-projecting (green) L5 PT cells are highlighted.
Extended Data Fig. 4
Extended Data Fig. 4. Marker genes for L5 ET cell types.
a, Heat map showing expression of a combination of marker genes of L5 PT ALM types in a previously published dataset, and marker genes for MOp L5 ET types. The coloured bars on the top indicate the cell type and projection class. b, Heat map for MOp L5 ET types in multiple scRNA and snRNA datasets using the same marker genes in the same order as in a. Cell types are divided into pink and green groups based on correspondence in Extended Data Fig. 3c.
Extended Data Fig. 5
Extended Data Fig. 5. Marker genes for L4/5 IT and L5 IT cell types.
a, Heat map of marker genes for MOp L4/5 IT and L5 IT types in multiple scRNA and snRNA datasets. b, In situ hybridization (ISH) showing validation of L4 marker genes (Rspo1 and Rorb) and L5 (Fezf2) in the mouse MOp. Note that Rorb labels both L4 and a subset of L5 neurons.
Extended Data Fig. 6
Extended Data Fig. 6. Epigenomic cell types and multimodal integration.
a, Cell-type clusters from single-nucleus methyl-C-Seq (snmC-seq2 (refs. ,)) for 9,876 MOp nuclei are represented in a two-dimensional projection. Labels indicate broad cell types; the colours show finest cluster resolution. b, Non-CG DNA methylation level (normalized mCH) for each cell at gene bodies of markers of major cell types. Actively expressed genes have low mCH, indicated by the coloured bars extending downward. Highly methylated (repressed) genes appear white in this plot. c, Two-dimensional projection of cell-type clusters from snATAC-seq profiles for 81,196 cells. d, Gene body chromatin accessibility (total snATAC-seq read density, log(CPM + 1)) for marker genes. For b and d, each bar represents one cell. The abbreviations of cell type are as in Fig. 2. CGE/MGE, caudal/medial ganglionic eminence-derived inhibitory cells. e, f, Integrated, multimodal UMAP embeddings (SingleCellFusion (e); LIGER (f)) coloured by the clusters assigned in separate analysis of each dataset. Each panel shows the cells from a single dataset. g, Integrated analysis of major cell classes by LIGER. Cells in each of the five cell classes are separately integrated, illustrating fine-grained resolution of integrated data. h, Number of cells in each of 56 multimodality cell types (SingleCellFusion; L2), ranked by cluster size. i, j, Number of cells for 56 integrated clusters (SingleCellFusion L2 (i); LIGER L2 (j)), as well as the corresponding coarser clusters (L1, L0). Cluster order and colour scheme are as shown in Fig. 2.
Extended Data Fig. 7
Extended Data Fig. 7. Validation of multimodal integration of transcriptomic and epigenomic data.
a, Confusion matrices comparing integrated clusters generated by SingleCellFusion versus clusters generated by LIGER (left), and comparing SingleCellFusion versus consensus transcriptomic taxonomy (right). b, Confusion matrix comparing integrated clusters (SingleCellFusion L2) with single-modality clustering for every dataset. c, d, Agreement and alignment metrics characterize the fidelity of the joint low-dimensional embedding for LIGER and SingleCellFusion. Agreement measures the fraction of KNNs for each dataset that are still nearest neighbours in the low-dimensional embedding. A high value of the agreement metric thus indicates preservation of each dataset’s internal structure in the joint embedding. Alignment measures the mixing of datasets in the joint low-dimensional space, and is a normalized measure of the mean number of KNNs that come from each of the datasets. e, Embedding of multimodality cluster centroids. The black dots are cluster centroids of integrated clusters (SingleCellFusion); coloured dots are cluster centroids of individual datasets. f, Molecular signatures at the gene body of Lhx9, a developmentally expressed transcription factor, across cell types (n = 29; SingleCellFusion L1). We found enrichment of mCG and mCH in L6b neurons with no corresponding RNA or ATAC-seq signal. g, Spearman correlation matrix for cluster centroid gene expression (measured or imputed) across major cell subclasses for each dataset (SingleCellFusion L0). h, Correlation for subsets of inhibitory (CGE and MGE) and excitatory (L4/5 IT and L2/3 IT) neuron types using fine-grained integrated clusters (SingleCellFusion L2).
Extended Data Fig. 8
Extended Data Fig. 8. MetaNeighbor and cross-validation analysis of cluster reproducibility.
a, Heat map showing replicability scores (MetaNeighbor AUROC) at the subclass level of the independent clusterings of seven RNA-seq datasets. High AUROC indicates that the cell-type labels in one dataset can be reliably predicted based on the nearest neighbours of those cells in another dataset, together with the independent cluster analysis of that dataset. b, Scheme for within-dataset and across-dataset cross-validation. c, d Within-dataset cross-validation analysis for each dataset, either using the full set of cells (c) or using a random sample of 5,000 cells (d). In each plot, the black curve shows training error, while the coloured U-shaped curve shows the test set error, with a minimum at the cluster resolution that balances over-fitting and under-fitting. The shaded region shows the s.e.m. based on cross-validation with n = 5 data partitions. e, Transcriptomic platform consistency is assessed by cross-dataset cluster stability analysis (Conos).

Comment in

References

    1. Zeisel A, et al. Molecular architecture of the mouse nervous system. Cell. 2018;174:999–1014.e22. doi: 10.1016/j.cell.2018.06.021. - DOI - PMC - PubMed
    1. Saunders A, et al. Molecular diversity and specializations among the cells of the adult mouse brain. Cell. 2018;174:1015–1030.e16. doi: 10.1016/j.cell.2018.07.028. - DOI - PMC - PubMed
    1. Tasic B, et al. Shared and distinct transcriptomic cell types across neocortical areas. Nature. 2018;563:72–78. doi: 10.1038/s41586-018-0654-5. - DOI - PMC - PubMed
    1. Yamawaki N, Borges K, Suter BA, Harris KD, Shepherd GMG. A genuine layer 4 in motor cortex with prototypical synaptic circuit connectivity. eLife. 2014;3:e05422. doi: 10.7554/eLife.05422. - DOI - PMC - PubMed
    1. Zeng H, Sanes JR. Neuronal cell-type classification: challenges, opportunities and the path forward. Nat. Rev. Neurosci. 2017;18:530–546. doi: 10.1038/nrn.2017.85. - DOI - PubMed

Publication types