. 2021 Oct;598(7879):151-158.
doi: 10.1038/s41586-021-03813-8. Epub 2021 Oct 6.

Human neocortical expansion involves glutamatergic neuron diversification

Jim Berg #  1 Staci A Sorensen #  1 Jonathan T Ting #  1   2 Jeremy A Miller #  1 Thomas Chartrand  1 Anatoly Buchin  1 Trygve E Bakken  1 Agata Budzillo  1 Nick Dee  1 Song-Lin Ding  1 Nathan W Gouwens  1 Rebecca D Hodge  1 Brian Kalmbach  1   2 Changkyu Lee  1 Brian R Lee  1 Lauren Alfiler  1 Katherine Baker  1 Eliza Barkan  1 Allison Beller  3 Kyla Berry  1 Darren Bertagnolli  1 Kris Bickley  1 Jasmine Bomben  1 Thomas Braun  4 Krissy Brouner  1 Tamara Casper  1 Peter Chong  1 Kirsten Crichton  1 Rachel Dalley  1 Rebecca de Frates  1 Tsega Desta  1 Samuel Dingman Lee  1 Florence D'Orazi  1 Nadezhda Dotson  1 Tom Egdorf  1 Rachel Enstrom  1 Colin Farrell  1 David Feng  1 Olivia Fong  1 Szabina Furdan  5 Anna A Galakhova  6 Clare Gamlin  1 Amanda Gary  1 Alexandra Glandon  1 Jeff Goldy  1 Melissa Gorham  1 Natalia A Goriounova  6 Sergey Gratiy  1 Lucas Graybuck  1 Hong Gu  1 Kristen Hadley  1 Nathan Hansen  7 Tim S Heistek  6 Alex M Henry  1 Djai B Heyer  6 DiJon Hill  1 Chris Hill  1 Madie Hupp  1 Tim Jarsky  1 Sara Kebede  1 Lisa Keene  3 Lisa Kim  1 Mean-Hwan Kim  1 Matthew Kroll  1 Caitlin Latimer  3 Boaz P Levi  1 Katherine E Link  1 Matthew Mallory  1 Rusty Mann  1 Desiree Marshall  3 Michelle Maxwell  1 Medea McGraw  1 Delissa McMillen  1 Erica Melief  3 Eline J Mertens  6 Leona Mezei  5 Norbert Mihut  5 Stephanie Mok  1 Gabor Molnar  5 Alice Mukora  1 Lindsay Ng  1 Kiet Ngo  1 Philip R Nicovich  1 Julie Nyhus  1 Gaspar Olah  5 Aaron Oldre  1 Victoria Omstead  1 Attila Ozsvar  5 Daniel Park  1 Hanchuan Peng  1 Trangthanh Pham  1 Christina A Pom  1 Lydia Potekhina  1 Ramkumar Rajanbabu  1 Shea Ransford  1 David Reid  1 Christine Rimorin  1 Augustin Ruiz  1 David Sandman  1 Josef Sulc  1 Susan M Sunkin  1 Aaron Szafer  1 Viktor Szemenyei  5 Elliot R Thomsen  1 Michael Tieu  1 Amy Torkelson  1 Jessica Trinh  1 Herman Tung  1 Wayne Wakeman  1 Femke Waleboer  6 Katelyn Ward  1 René Wilbers  6 Grace Williams  1 Zizhen Yao  1 Jae-Geun Yoon  7 Costas Anastassiou  1 Anton Arkhipov  1 Pal Barzo  8 Amy Bernard  1 Charles Cobbs  7 Philip C de Witt Hamer  9 Richard G Ellenbogen  10 Luke Esposito  1 Manuel Ferreira  10 Ryder P Gwinn  7 Michael J Hawrylycz  1 Patrick R Hof  11 Sander Idema  9 Allan R Jones  1 C Dirk Keene  3 Andrew L Ko  10 Gabe J Murphy  1   2 Lydia Ng  1 Jeffrey G Ojemann  10 Anoop P Patel  10 John W Phillips  1 Daniel L Silbergeld  10 Kimberly Smith  1 Bosiljka Tasic  1 Rafael Yuste  12 Idan Segev  13 Christiaan P J de Kock  6 Huibert D Mansvelder  6 Gabor Tamas  5 Hongkui Zeng  1 Christof Koch  1 Ed S Lein  14   15
Affiliations

Human neocortical expansion involves glutamatergic neuron diversification

Jim Berg et al. Nature. 2021 Oct.

Erratum in

  • Author Correction: Human neocortical expansion involves glutamatergic neuron diversification.
    Berg J, Sorensen SA, Ting JT, Miller JA, Chartrand T, Buchin A, Bakken TE, Budzillo A, Dee N, Ding SL, Gouwens NW, Hodge RD, Kalmbach B, Lee C, Lee BR, Alfiler L, Baker K, Barkan E, Beller A, Berry K, Bertagnolli D, Bickley K, Bomben J, Braun T, Brouner K, Casper T, Chong P, Crichton K, Dalley R, de Frates R, Desta T, Lee SD, D'Orazi F, Dotson N, Egdorf T, Enstrom R, Farrell C, Feng D, Fong O, Furdan S, Galakhova AA, Gamlin C, Gary A, Glandon A, Goldy J, Gorham M, Goriounova NA, Gratiy S, Graybuck L, Gu H, Hadley K, Hansen N, Heistek TS, Henry AM, Heyer DB, Hill D, Hill C, Hupp M, Jarsky T, Kebede S, Keene L, Kim L, Kim MH, Kroll M, Latimer C, Levi BP, Link KE, Mallory M, Mann R, Marshall D, Maxwell M, McGraw M, McMillen D, Melief E, Mertens EJ, Mezei L, Mihut N, Mok S, Molnar G, Mukora A, Ng L, Ngo K, Nicovich PR, Nyhus J, Olah G, Oldre A, Omstead V, Ozsvar A, Park D, Peng H, Pham T, Pom CA, Potekhina L, Rajanbabu R, Ransford S, Reid D, Rimorin C, Ruiz A, Sandman D, Sulc J, Sunkin SM, Szafer A, Szemenyei V, Thomsen ER, Tieu M, Torkelson A, Trinh J, Tung H, Wakeman W, Waleboer F, Ward K, Wilbers R, Williams G, Yao Z, Yoon JG, Anastassiou C, Arkhipov A, Barzo P, Bernard A, Cobbs C,… See abstract for full author list ➔ Berg J, et al. Nature. 2022 Jan;601(7893):E12. doi: 10.1038/s41586-021-04322-4. Nature. 2022. PMID: 34992294 Free PMC article. No abstract available.

Abstract

The neocortex is disproportionately expanded in human compared with mouse1,2, both in its total volume relative to subcortical structures and in the proportion occupied by supragranular layers composed of neurons that selectively make connections within the neocortex and with other telencephalic structures. Single-cell transcriptomic analyses of human and mouse neocortex show an increased diversity of glutamatergic neuron types in supragranular layers in human neocortex and pronounced gradients as a function of cortical depth3. Here, to probe the functional and anatomical correlates of this transcriptomic diversity, we developed a robust platform combining patch clamp recording, biocytin staining and single-cell RNA-sequencing (Patch-seq) to examine neurosurgically resected human tissues. We demonstrate a strong correspondence between morphological, physiological and transcriptomic phenotypes of five human glutamatergic supragranular neuron types. These were enriched in but not restricted to layers, with one type varying continuously in all phenotypes across layers 2 and 3. The deep portion of layer 3 contained highly distinctive cell types, two of which express a neurofilament protein that labels long-range projection neurons in primates that are selectively depleted in Alzheimer's disease4,5. Together, these results demonstrate the explanatory power of transcriptomic cell-type classification, provide a structural underpinning for increased complexity of cortical function in humans, and implicate discrete transcriptomic neuron types as selectively vulnerable in disease.


Conflict of interest statement

The authors declare no competing interests.

Figures

Fig. 1
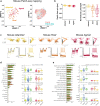
Fig. 1. Comparison of human versus mouse supragranular neurons.
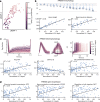
a, NeuN labelling of neurons in human MTG (left), mouse VISp (center), and mouse TEa (right).  Higher magnification insets spanning L2 and L3. WM, white matter. b, Left, neuron density through L2 and L3. Tick marks show individual donors. Right, Normalized histogram of neuron density in mouse VISp (red), mouse TEa (grey) and human (green) L2-3. Normalized L2/3 depth is defined as distance from L1–L2 boundary to soma/(L2/3 thickness). c, Mean (left) and standard deviation (right) of soma area. Green tick marks indicate border between L2 and L3 for each human sample.  Data in b, c, are mean ± s.d. of metrics across donors.  d, UMAP of 2,948 dissociated human nuclei collected3 from five glutamatergic t-types in L2 and L3 of human MTG using the 2,000 most binary genes.  Cells are colour-coded by t-type. e, f, Comparable UMAP of 981 mouse cells mapping to three glutamatergic L2/3 neuron types in VISp (e) and 313 cells mapping to ALM (f).  g, Average variance explained by principal component 1 (PC1) across 100 subsets of actual versus permuted data (Methods).  Error bars show s.d. h, Average number of differentially expressed genes between indicated cluster and other homologous t-types. i, Comparison of calculated electrophysiological features (y-axis) between recorded neurons in low (0–1) versus high (2–3) score bins for GFAP and IBA1, with and without including cell depth as a regressor (x-axis). *P < 0.05 (FDR-corrected). AHP, after hyperpolarization; AP, action potential features: down, downstroke velocity; thresh, voltage threshold; trough, nadir following action potential; up, upstroke velocity; RMP, resting membrane potential; Rinput, input resistance; adaptation, spike frequency adaptation ratio; fI slope, slope of the firing rate versus current curve; rate, firing rate; latency, delay between stimulus onset and first AP; tau, time constant (details in Methods ‘Electrophysiology feature analysis’). j, UMAP of 385 glutamatergic Patch-seq neurons from supragranular cortex in human MTG, colour-coded by mapped t-type and plotted as in dk, Depth of human Patch-seq neurons, by t-type. l, Location of t-types within the neocortex (red dots) demonstrated using mFISH. Black lines delineate layer boundaries. t-Type is indicated as in k.
Fig. 2
Fig. 2. Human L2 and L3 glutamatergic t-types show strong morphological and electrophysiological differentiation by t-type.
a, Morphology descriptions of the three prominent superficial (top row) and deep (bottom row) human L2 and L3 glutamatergic neuron t-types. For each t-type: left, representative examples of morphological reconstructions (scale bar, 250 µm); right, histogram of the average apical dendrite branch length by cortical depth and layer for all reconstructed cells from each t-type.  b, Intrinsic electrophysiology responses by t-type. Coloured lines are individual neurons, solid black line represents the mean of all neurons in that t-type, dashed grey line is a global mean of the other t-types. Top row: left, responses to −70 and −30 pA current injections (scale bars, 10 mV, 1.0 s); right, responses to normalized to peak deflection to reveal voltage sag (scale bar, 0.5 s). Second row: left, first action potential during rheobase current injection (scale bar, 25 mV, 1.0 ms); right, corresponding phase plot (x-axis, mV; y-axis, mV ms−1). Third row: left, representative suprathreshold spiking response (scale bars, 20 mV, 0.5 s); right, normalized instantaneous firing rates for a suprathreshold pulse, demonstrating adaptation of firing rate (scale bar, 0.5 s). Bottom row: histogram of rheobase currents (left axis) and mean frequency to current curves (dots, right axis; currents normalized to the mean rheobase current before averaging).  c, d, UMAP representation of electrophysiology (c) and morphology (d) space (left), and the same feature space projected onto sparse PCs (SPCA, right), with contributing features listed on each axis.  e, f,  Box plots showing feature distributions by t-type for illustrative features from each axis of SPCA space. Bars indicate significant pairwise comparisons (P < 0.05, FDR-corrected Mann–Whitney test).  Boxes show median (centre line) and quartiles (top and bottom), whiskers show trimmed range bounded at 1.5× interquartile range beyond quartiles.
Fig. 3
Fig. 3. Features of FREM3 neurons vary according to laminar depth.
a, FREM3 neurons plotted in transcriptomic UMAP space (as in Fig. 1d). Each cell is coloured on the basis of its relative position within L2-3. Depth colour scale shown at right. b, Top, these FREM3 neurons exhibit a range of morphologies spanning L2-3. Scale bar, 250 µm.  Apical height and basal maximum distance are positively correlated with depth (bottom row). In bd, all regressions shown are significant at FDR < 10−7c, Top row, electrophysiology data traces coloured on the basis of each neuron’s relative position within L2-3 (scale at right). Top left, hyperpolarizing pulses normalized to their peak deflection to allow for a sag comparison (n = 124). Top centre, overlaid first action potential during a rheobase current injection (scale bars, 25 mV, 1.0 ms; traces aligned to the time of threshold), as well as the corresponding phase plots (x-axis, mV; y-axis, mV ms−1). Top right, initial action potentials at rheobase for 141 FREM3 neurons aligned to the time of stimulus onset. Bottom, summary plots show that sag and action potential upstroke/downstroke ratio are positively correlated, and latency to action potential firing at rheobase is negatively correlated with depth. d, Representative gene examples for three GO categories with pronounced depth dependence of expression in FREM3 neurons: chemical synaptic transmission, neuron projection morphogenesis and regulation of cell migration.
Fig. 4
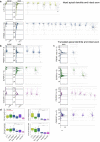
Fig. 4. Human deep L3 glutamatergic t-types are morphologically and electrophysiologically distinct.
a, Top, example reconstructions and associated maximum-intensity projection images of deep L3 t-types, deep FREM3CARM1P1 and COL22A1 (scale bars, 200 µm). Bottom, histograms of the average apical and basal dendrite branch length (normalized to the maximum value for each t-type) by cortical depth and layer for all reconstructed cells from each t-type. Open circles indicate soma location. b, A logistic regression classifier predicts t-types on the basis of electrophysiological properties with 66% class-balanced accuracy for deep t-types, compared with 49% for superficial (sup.) t-types (overall 58% accuracy). c, Box plots of electrophysiology and morphology features that discriminate the three deep t-types from superficial t-types (LTK, GLP2R and superficial FREM3) and each other. Features shown selected from significant analysis of variance (ANOVA) results (FDR < 10−7 for electrophysiology, FDR < 10−2 for morphology). Bars indicate significant pairwise comparisons (P < 0.05, FDR-corrected Mann–Whitney test). Boxes show median (centre line) and quartiles (top and bottom), whiskers show trimmed range bounded at 1.5× interquartile range beyond quartiles. Apical Hist PC0 is the first principal component of apical dendrite distribution with respect to cortical layer depths, representing a preference for apical found in L1 over deeper layers. d, A selection of eight marker genes that are differentially expressed in the deep L3 human t-types. Colour bars show normalized expression. The top left UMAP is identical to the one in Fig 1d. e, Left, MTG tissue immunostained for SMI-32. FREM3 and CARM1P1 neurons that are SMI-32 immunoreactive are indicated by cyan dots and those that are not are indicated by pink dots. Layer boundaries indicated at left of image, Scale bar, 100 µm. Representative SMI-32 immunoreactivity photomicrographs, along with mFISH for t-type specific genes shown for FREM3 (top) and CARM1P1 (middle) types. Right, representative mFISH composite images showing labelling for DAPI, NEFH, RORB and FREM3 (top) or CARTPT (middle) in the same cell. The dashed box indicates the region of image shown on the right, where RORB and FREM3 (top) or CARTPT (middle) are shown separately and then combined. Bottom, mFISH composite images with labelling for DAPI, neurofilament H, and t-type-specific genes for  LTK (LAMP5 and LTK), GLP2R (CUX2 and GLP2R) and COL22A1 (COL22A1 and RORB) t-type. Scale bars, 10 µm. Marker gene expression is shown in Extended Data Fig. 3.
Extended Data Fig. 1
Extended Data Fig. 1. Human tissue acquisition and pathology analysis.
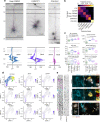
a, UMAP of 2,948 dissociated human nuclei collected26 from five glutamatergic t-types in L2 and L3 of human MTG using the 2,000 most binary genes (repeated from Fig. 1d for clarity).  FREM3 nuclei, color-coded by subtype assignment26(middle) or dissected layer (right).  b, Example resected tissue specimen from human middle temporal gyrus is processed into a series of 350 µm-thick slices according to a standardized sampling plan.  c, Immunohistochemistry and imaging on human surgical specimens. Averages of scores from 0 [normal] to 3 [pathological). Shown are images for donors with the lowest (top) and highest (middle) average marker score. Scores indicated below each image. Bottom, histograms of scores across all donors (N=number of cases). d, Pearson correlation coefficient between various tissue pathology scores: GFAP, IBA1, SMI-32, Ki-67, NeuN and Nissl. e, Boxplots of electrophysiology features with potential relationships to pathology. Cells are assigned to low or high pathology groups based on pathology scores <1 or ≥1 respectively. Bars indicate significant pairwise comparisons (p<0.05, FDR-corrected Mann-Whitney test), both of which are nonsignificant once cell depth is included as a factor (main text). Boxes show median (center) and quartiles (ends), whiskers show trimmed range bounded at 1.5×IQR beyond quartiles.
Extended Data Fig. 2
Extended Data Fig. 2. Relationships between patient metadata and features.
UMAP projection of electrophysiological features (left) and gene expression (right), with data points for each neuron colored by t- type (upper left) and by patient characteristics. In particular, cells split by medical condition (upper right) show a lack of correspondence between pathology, electrophysiology, and transcriptomic cell identity.
Extended Data Fig. 3
Extended Data Fig. 3. Human Patch-seq pipeline.
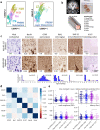
a, Workflow for patch clamp recording using standardized stimulus protocols and feature extraction code (1), followed by RNA-seq on extracted nucleated patches (2).  Biocytin-filled neurons in slices are visualized with DAB as chromogen, imaged, and digitally reconstructed for morphological feature calculation and analysis (3). b, Density scatter plot showing the average expression of genes between dissociated nuclei and Patch-seq cells in human.  Dashed lines indicate two-fold enrichment, with number of differentially expressed genes shown in the off-diagonal corners. p~0.  c, Depth distribution of neurons in human and mouse supragranular layers normalized to depth within L2-3, grouped and colored by t-type.  All pairwise comparisons are significant at FDR<0.05 (Mann-Whitney test). Boxes show median and quartiles, whiskers show trimmed range without outliers >1.5 IQR beyond quartiles. Individual neuron data points horizontally jittered for clarity. d, Marker gene expression values for each t-type, based on FACS data, shown for all five human t-types, normalized by gene.
Extended Data Fig. 4
Extended Data Fig. 4. Human L2-3 excitatory neuron dendritic reconstructions.
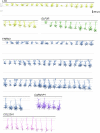
All human L2-3 excitatory neuron dendritic reconstructions ordered by t-type and aligned by layer to an average cortical template. Apical dendrites are in darker colors, basal dendrites in lighter colors. The division between superficial and deep FREM3 neurons is indicated by the gray vertical line.
Extended Data Fig. 5
Extended Data Fig. 5. Mouse VISp L2/3 excitatory neurons are less morphoelectrically discrete than their homologous human L2, L3 counterparts.
a, Joint UMAP of dissociated mouse cells from Fig. 1e and 133 glutamatergic Patch-seq neurons from supragranular cortex in VISp. Left plot shows cells color-coded by collection strategy. Right plot shows only Patch-seq neurons color-coded by mapped t-type. b, Depth distribution of neurons in mouse supragranular cortex, grouped and colored by t-type. Left plot shows depth from pia in μm. Right plot shows scaled depth within L2/3. Boxes show median and quartiles, whiskers show trimmed range without outliers >1.5 IQR beyond quartiles. Individual neuron data points horizontally jittered for clarity. c, Morphology and electrophysiology descriptions of the three L2/3 glutamatergic t-types in mouse visual cortex: Adamts2, Rrad, and Agmat. For each panel, colored lines are individual neurons, solid black line represents the mean of all neurons in that t-type, dashed gray line represents the global mean of the other 2 homologous t-types in that species. Left is an overlaid response to -70 and -30 pA current injections (scale bar = 10 mV, 1.0 s), center left are hyperpolarizing pulses normalized to their peak deflection to allow for a sag comparison, shown is the range -0.5 to -1.0 (scale bar = 0.5 s). Right is a representative suprathreshold spiking response (top, scale bar = 20 mV, 0.5 s), and the normalized instantaneous firing rates for a suprathreshold pulse, demonstrating the neuron’s firing rate adaptation (bottom, scale bar = 0.5 s). Scale bar = 250 μm. Electrophysiological responses are shown for 9 Adamst2, 43 Rrad and 55 Agmat cells. d, e, Effect size (explained variance) for one-way ANOVA of each electrophysiology (d) and morphology (e) feature vs. t-type for human (green) and mouse (red). Stars indicate significance at FDR (False Discovery Rate) < (0.05, 0.01, 0.001). Box plots on right show data distribution by t- type for the four features with the largest effect size in human. Gray bars indicate significant pairwise comparisons (FDR<0.05, Mann-Whitney test). Boxes show median and quartiles, whiskers show trimmed range without outliers >1.5 IQR beyond quartiles. Individual neuron data points horizontally jittered for clarity.
Extended Data Fig. 6
Extended Data Fig. 6. Mouse L2/3 excitatory neuron dendritic reconstructions.
All mouse L2/3 excitatory neuron dendritic reconstructions ordered by t-type and aligned by layer to an average cortical template. Apical dendrites are in darker colors, basal dendrites in lighter colors.
Extended Data Fig. 7
Extended Data Fig. 7. Somata radius by depth and t-type.
a, Soma radius vs. normalized L2-3 depth. Each soma is colored by t-type. b, Average soma radius by t-type for human and mouse.
Extended Data Fig. 8
Extended Data Fig. 8. Axon distribution pattern by t-type.
a, Morphology descriptions of LTK and superficial FREM3 neurons with intact apical dendrites and substantial local axon (top two rows). For each panel: Left, Histograms of the average apical dendrite and axon branch length (normalized to the maximum value for each t-type) by cortical depth and layer. Right, representative examples of morphological reconstructions from each t-type. Axons appear in gray. Morphology descriptions of deep FREM3GLP2RCARM1P1 and COL22A1 neurons with either intact apical dendrites (b) or truncated apical dendrites (c) and substantial local axon. For each panel: Left, Histograms of the average apical dendrite and/or axon branch length (normalized to the maximum value for each t-type) by cortical depth and layer. Right, representative examples of morphological reconstructions from each t-type. Axons appear in gray. d, Box plots illustrating axon feature distribution by t-type. Total axon length, axon histogram Principal Component (PC) 0, number of axon branches and maximum branch order are shown. Brackets indicate significant pairwise comparisons (FDR<0.05, Mann-Whitney test). Scale bar = 250 μm.
Extended Data Fig. 9
Extended Data Fig. 9. Deep human L2, L3 neuron types are more morphoelectrically distinct than superficial L2, L3 t-types.
Effect size (explained variance) for one-way ANOVA of each electrophysiology (left) and morphology (right) feature vs. t-type for human superficial L2-3 (LTK, GLP2R, Superficial FREM3, green) and deep L2-3 (Deep FREM3, CARM1P1, COL22A1, purple). Stars indicate significance at FDR (False Discovery Rate) < (0.05, 0.01, 0.001).
Extended Data Fig. 10
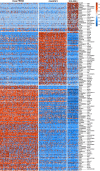
Extended Data Fig. 10. Differentially expressed genes between deep types.
differentially expressed genes selective for one or two of the CARM1P1, COL22A1, and deep FREM3 t-types, selected using genesorteR. Heatmap and legend show Z score normalized expression values.

References

    1. Petersen CCH. The functional organization of the barrel cortex. Neuron. 2007;56:339–355. - PubMed
    1. DeFelipe J, Alonso-Nanclares L, Arellano JI. Microstructure of the neocortex: comparative aspects. J. Neurocytol. 2002;31:299–316. - PubMed
    1. Hodge RD, et al. Conserved cell types with divergent features in human versus mouse cortex. Nature. 2019;573:61–68. - PMC - PubMed
    1. Bussière T, et al. Progressive degeneration of nonphosphorylated neurofilament protein-enriched pyramidal neurons predicts cognitive impairment in Alzheimer’s disease: stereologic analysis of prefrontal cortex area 9. J. Comp. Neurol. 2003;463:281–302. - PubMed
    1. Hof PR, Cox K, Morrison JH. Quantitative analysis of a vulnerable subset of pyramidal neurons in Alzheimer’s disease: I. Superior frontal and inferior temporal cortex. J. Comp. Neurol. 1990;301:44–54. - PubMed

Publication types