. 2021 Oct;598(7879):182-187.
doi: 10.1038/s41586-021-03955-9. Epub 2021 Oct 6.

Genetic dissection of the glutamatergic neuron system in cerebral cortex

Affiliations

Genetic dissection of the glutamatergic neuron system in cerebral cortex

Katherine S Matho et al. Nature. 2021 Oct.

Abstract

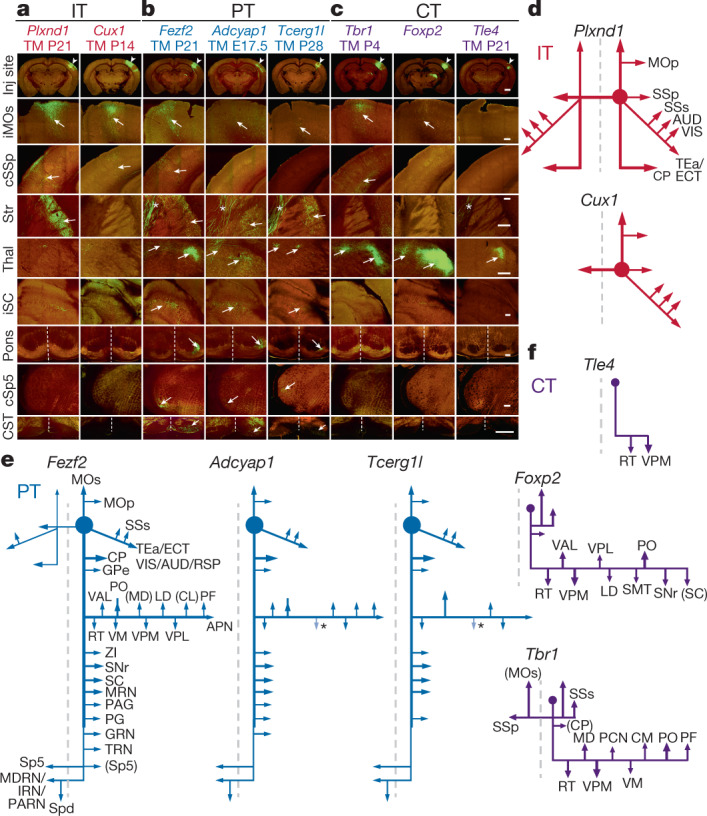
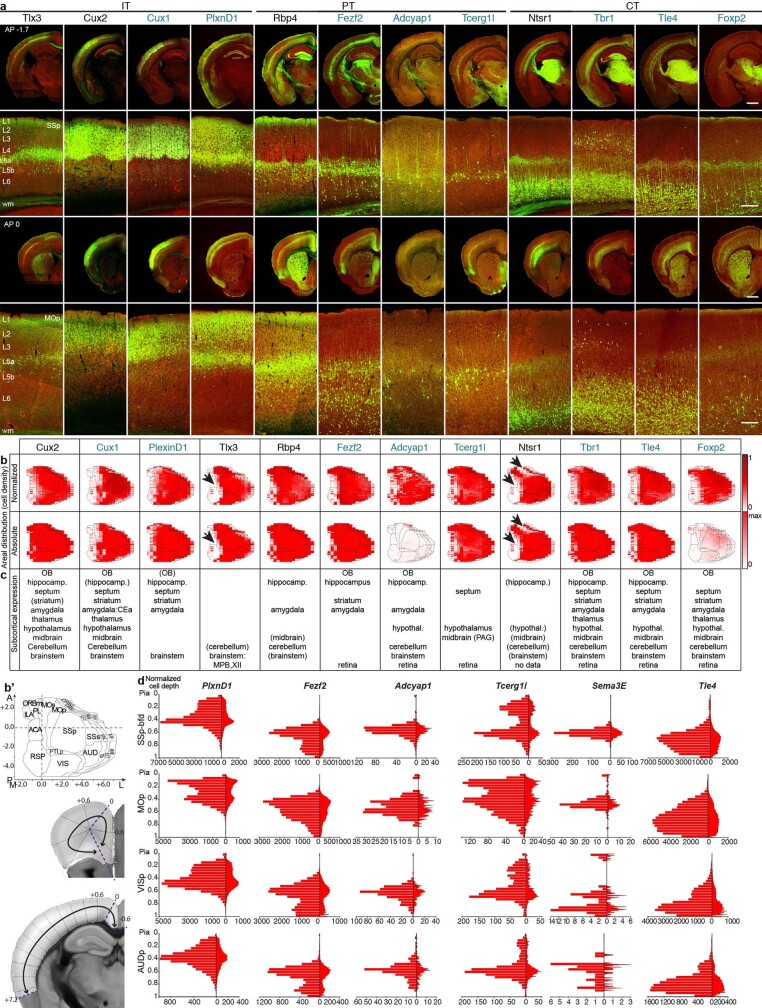
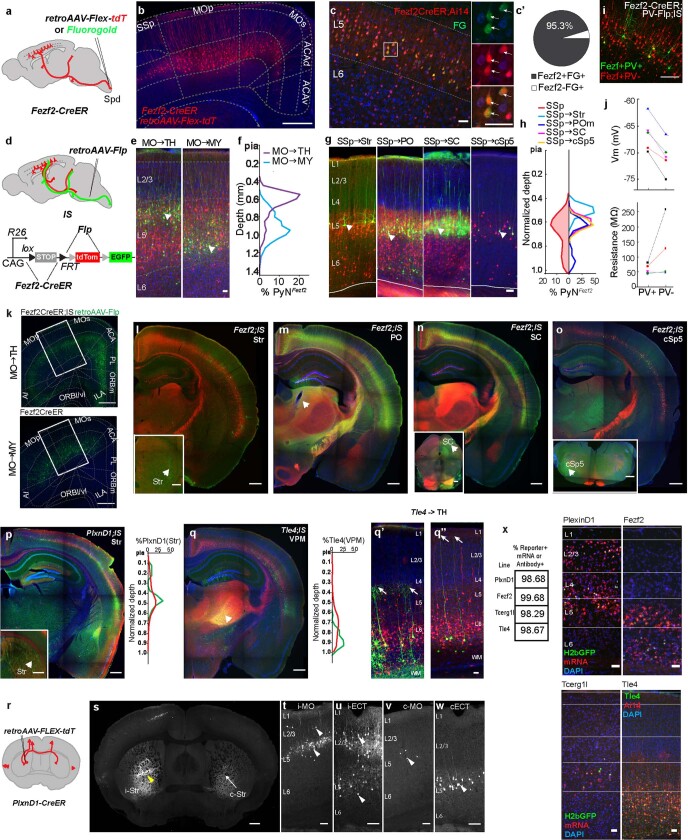
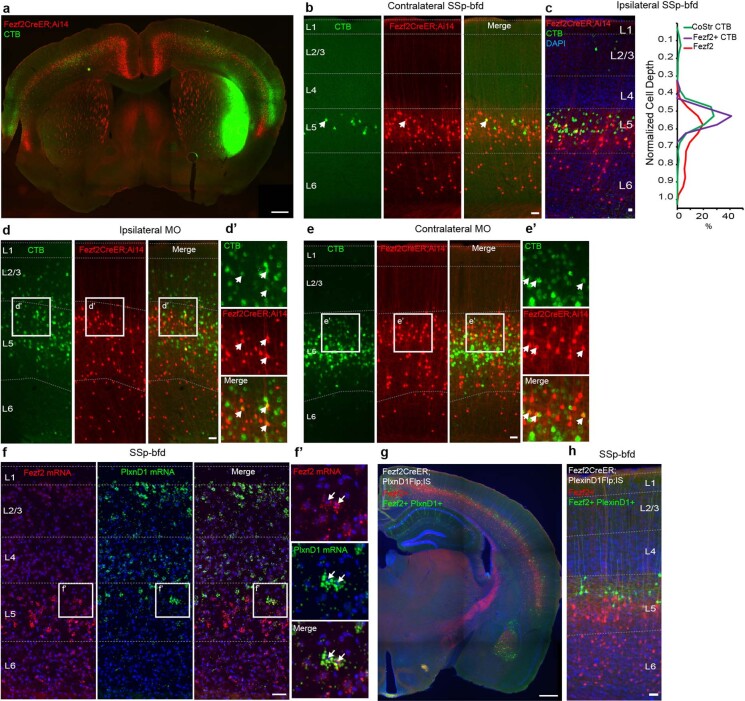
Diverse types of glutamatergic pyramidal neurons mediate the myriad processing streams and output channels of the cerebral cortex1,2, yet all derive from neural progenitors of the embryonic dorsal telencephalon3,4. Here we establish genetic strategies and tools for dissecting and fate-mapping subpopulations of pyramidal neurons on the basis of their developmental and molecular programs. We leverage key transcription factors and effector genes to systematically target temporal patterning programs in progenitors and differentiation programs in postmitotic neurons. We generated over a dozen temporally inducible mouse Cre and Flp knock-in driver lines to enable the combinatorial targeting of major progenitor types and projection classes. Combinatorial strategies confer viral access to subsets of pyramidal neurons defined by developmental origin, marker expression, anatomical location and projection targets. These strategies establish an experimental framework for understanding the hierarchical organization and developmental trajectory of subpopulations of pyramidal neurons that assemble cortical processing networks and output channels.


Conflict of interest statement

J.A.H. is currently employed by Cajal Neuroscience. The remaining authors declare no competing interests.

Figures

Fig. 1
Fig. 1. Strategies and drivers to target PyN types and fate-map progenitors.
a, Major PyN projection classes mediating intratelencephalic streams (IT, red) and cortical output channels (PT, blue; CT, purple) in a sagittal brain section. Pn, pons; SC, superior colliculus; Str, striatum; Th, thalamus; Spd, spinal cord. b, PyN developmental trajectory. RGs undergo direct and indirect (IP-derived) neurogenesis, producing all laminar and projection types. The listed genes are expressed in progenitor and PyN subpopulations. SVZ, subventricular zone; VZ, ventricular zone. c, Temporal expression patterns of genes used for generating knock-in drivers across PyN development. Colours correspond to projection class; intensity gradients depict expression levels. d, E12.5 tamoxifen pulse-chase in Lhx2 embryos labelled RGsLhx2+ with a medialhigh to laterallow gradient along the dorsal neuroepithelium, ending at the cortex–hem boundary. The magnified views in d, f, j show RGs at multiple cell-cycle stages, with end-feet (arrows) and dividing soma (arrowheads) at the ventricle wall (dashed line). e, E12.5 RGsLhx2+ produced PyNs across cortical layers. f, E12.5 tamoxifen pulse-chase in Fezf2 embryos labelled RGsFezf2+ with a gradient distribution similar to that in d but at a lower density. g, RGsFezf2+ produced PyNs across layers. h, Top, distribution of RGsLhx2+ (red) and RGsFezf2+ (pink) across cortical neuroepithelium divided into medial (M), dorsal (D) and lateral (L) bins. Bottom, laminar distribution of fate-mapped PyNs. i, Fate-mapping scheme using an IS reporter with Lhx2-CreER and Fezf2-Flp: RGsLhx2+Fezf2 express tdTomato/RFP by ‘Cre-NOT-Flp’ subtraction; RGsLhx2+Fezf2+ express EGFP by ‘Cre-AND-Flp’ intersection. j, E12.5 tamoxifen 24-hour pulse-chase revealed RGsLhx2+Fezf2 and RGsLhx2+Fezf2+ throughout the cortical primordium. k, Top, the labelled number of RGsLhx2+Fezf2+ is half that of RGsLhx2+Fezf2. Bottom, the number of RGsLhx2+Fezf2 versus RGsLhx2+Fezf2+ at rostral (R), mid-level (M) and caudal (C) sections. Data in h, k are mean ± s.e.m.; see ‘Quantification and statistics related to progenitor fate-mapping’ in the Methods for statistical details. l–n, RGLhx2+Fezf2-derived PyNs (red) project to the corpus callosum (arrowheads, m) without subcortical branches; RGLhx2+Fezf2+-derived PyNs project to the thalamus (arrowheads, n) without callosal branches. DAPI (blue). Scale bars, 20 µm (d, f, j insets); 100 µm (all other panels).
Fig. 2
Fig. 2. Genetic targeting of PyN subpopulations.
aj, Driver line recombination patterns visualized through reporter expression (green; background autofluorescence, red). First row, coronal hemisections. TM, tamoxifen. ad, Second row, IT drivers targeting laminar subsets in L2–L5a of somatosensory barrel cortex (SSp-bfd), which project axons across the corpus callosum (Cc) (third row) and to the striatum (Str) (bottom row). Cux1 and Plxnd1 drivers also label subsets of medium spiny neurons in the striatum (arrowheads). E16.5 and E17.5 tamoxifen induction of Tbr2-CreER label L2/3 and L2 PyNs, respectively. eg, Second row, PT drivers label L5B PyNs, which project to numerous subcortical targets, including the thalamus (Thal) (third row) and spinal cord (corticospinal tract; CST) (bottom row). hj, Second row, CT drivers label L6 PyNs, sending axons mainly to different nuclei in the thalamus (third row). Tamoxifen induction times are indicated in the first row. The reporter allele was Ai14, except for Plxnd1-CreER (Snap25-LSL-EGFP) and Foxp2 (systemic injection of AAV9-CAG-DIO-EGFP). White matter (Wm). Scale bars, 100 µm (bottom (CST) panel in g); 1 mm (hemisection in j, which applies to the entire row); 200 µm (all other scale bars). Cell bodies are indicated by arrowheads and axons by arrows.
Fig. 3
Fig. 3. Projection patterns of PyN subpopulations in SSp-bfd cortex.
ac, Images at SSp-bfd injection site (inj site) (first row, arrowhead) and selected subcortical projection targets for eight driver lines: EGFP expression from Cre-activated viral vector (green) and background autofluorescence (red). Tamoxifen induction time points are indicated below each gene name. Arrows indicate axons. a, IT drivers project to the cortex and striatum. Note the near absence of projection to the striatum for the Cux1 driver. b, PT drivers project to many corticofugal targets, including the brainstem and spinal cord. c, CT drivers project predominantly to the thalamus. df, Schematics of main projection targets for each PyN subset generated in this study. d, IT drivers. e, PT drivers. f, CT drivers. Ipsilateral secondary motor area (iMOs); contralateral primary somatosensory area (cSSp); secondary somatosensory area (SSs); auditory areas (AUD); visual areas (VIS); retrosplenial area (RSP); temporal association areas (TEa); ectorhinal area (ECT); reticular nucleus of the thalamus (RT); ventral anterior–lateral complex of the thalamus (VAL); ventral posteromedial complex of the thalamus (VPM); ventral posterior–lateral complex of the thalamus (VPL); submedial nucleus of the thalamus (SMT); posterior complex of the thalamus (PO); substantia nigra, reticular part (SNr); superior colliculus (SC); caudoputamen (CP); mediodorsal nucleus of the thalamus (MD); paracentral nucleus (PCN); central medial nucleus of the thalamus (CM); parafascicular nucleus (PF); globus pallidus, external segment (GPe); lateral dorsal nucleus of the thalamus (LD); central lateral nucleus of the thalamus (CL); anterior pretectal nucleus (APN); ventral medial nucleus of the thalamus (VM); zona incerta (ZI); midbrain reticular nucleus (MRN); periaqueductal gray (PAG); pontine gray (PG); gigantocellular reticular nucleus (GRN); tegmental reticular nucleus (TRN); medullary reticular nucleus (MDRN); intermediate reticular nucleus (IRN); and parvicellular reticular nucleus (PARN).  Scale bars, 1 mm (first row, in c); 200 µm (second to eighth rows, in c (for each respective row); 100 µm (CST panel in c, which applies to the bottom row). Asterisks in b, c, e indicate passing fibres.
Fig. 4
Fig. 4. Combinatorial targeting of IT subtypes by lineage, birth time and anatomy.
a, Strategy for combinatorial labelling of PyNPlxnd1 subtypes. In a Tbr2-CreER;Plxnd1-Flp;Ai65 mouse, tamoxifen inductions at successive embryonic times label deep or more superficial PyNPlxnd1 subsets born sequentially from intermediate progenitors. bd, Laminar subsets born at E13.5 (b), E15.5 (c) and E17.5 (d). e, The overall population is labelled in a Plxnd1-Flp;R26-FSF-tdTom mouse for comparison. The bottom panels in be show high-magnification images of the boxed regions in the top panels. f, In Tbr2-CreER;Plxnd1-Flp;dual-tTA mice, E13.5 or E17.5 tamoxifen inductions activate tTA expression in L5A or L2 PyNsPlxnd1, respectively, and AAV-TRE3g-memb-mRuby2 anterograde injection in SSp-bfd reveals the projection pattern of each laminar subset. g, n, Coronal sections display the injection site and several major projection targets. gm, Anterograde tracing from E13.5-born L5A PyNsPlxnd1 in SSp-bfd, with images (hm) of projection targets in several ipsi- and contralateral regions. nt, Anterograde tracing from E17.5-born L2 PyNsPlxnd1 in SSp-bfd, with images (os) of projection targets in several ipsi- and contralateral regions. The bottom panels in l, m, s and t show high-magnification images of the boxed regions in the top panels. The higher magnification of cSSp (l, s; bottom) and iMOs (m, t; bottom) display laminar axon termination differences between L5A and L2 PyNsPlxnd1. u, Schematics comparing E13.5-born L5A (left) and E17.5-born L2 (middle) PyNPlxnd1 projection patterns; note differences in the strength of several contralateral targets and in the laminar pattern of axon termination (right). Arrowheads indicate cell body positions; arrows indicate axons. Contralateral temporal association area (cTEa); ipsilateral striatum (iStr); contralateral striatum (cStr); white matter (Wm). Scale bars: 1 mm (be (top panels), g, n); 200 µm (be (bottom panels)); 50 µm (ht (including top panels in l, m, s, t)); 5 µm (l, m, s, t (bottom panels)).
Extended Data Fig. 1
Extended Data Fig. 1. Fate-mapping using Lhx2 and Fezf2 driver lines.
a, 24-hour pulse-chase in a E10.5 Lhx2-CreER;Ai14 embryo densely labelled RGsLhx2+ throughout the dorsal neuroepithelium, sharply ending at the cortex–hem boundary (Hm); magnified view shows RGs at different stages of the cell cycle, with endfeet (arrow) or dividing somata (arrowhead) at the ventricle wall (dashed lines). b, E10.5 RGs generate PyNs across layers in P30 neocortex in Lhx2-CreER;RGBow mouse (Supplementary Table 1). c, d are duplicated from Fig. 1c, d for comparison. e, Same experiment as in a done at E13.5. RGsLhx2+remain distributed in a medialhigh-laterallow gradient along the dorsal pallium but at a reduced density compared to earlier stages. f, E14.5 RGsLhx2+generated PyNs with lower density in L5/6, higher density in L2-4, and highest density in L4, suggesting more restricted fate potential. g, 24-hour pulse-chase in a E10.5 Fezf2-CreER;Ai14 embryo. The spatial extent of RGsFezf2+ in neuroepithelium is more restricted compared to RGsLhx2+ at this stage; magnified view shows RG endfoot (arrow) at the ventricle (dashed lines). Note the sparsity of dividing RGs. h, Fate-mapping of E10.5 RGsFezf2+ in a Fezf2-CreER;RGBow mouse labelled PyN progeny across all cortical layers. i, j are duplicated from Fig. 1e, f for comparison. k, Same experiment as in g done at E13.5. Only sparse RGsFezf2+ remain in medial pallium at this time, when Fezf2expression shifts to postmitotic PyNs (arrowheads); magnified view shows a remaining RG (arrow) at the ventricle wall (dashed line). l, Fate-mapping at E18.5 in Fezf2-CreER;RGBow labelled only L5b/L6 PyNs in mature cortex. m, Upper panel, quantification of E10.5 RGsLhx2+(red) (in a) versus RGsFezf2+ (pink) (in g) distributed across the cortical primordium, divided into medial (M), dorsal (D) and lateral (L) bins of equal length. Lower panel, laminar distribution of PyNs generated by RGsLhx2+ (red) or RGsFezf2+(pink) at E10.5, shown as percentage of total PyNs in S1 barrel cortex. n, Same quantification of RGsLhx2+ and RGsFezf2+as in m except done at E12.5. o, Same quantification of RGsLhx2+ and RGsFezf2+as in m except done at E13.5 (upper panel), and the laminar distribution of their PyN progeny fate-mapped at E14.5 (for RGsLhx2+) and E18.5 (for RGsFezf2+) (lower panel). p, Fate-mapping E12.5 RGsLhx2+ to mature cortex labelled PyN progeny that are SATB2+ (IT class, 66.8%) as well as SATB2- (non-IT class, 33.2%). Of these, 72.8% of L2-4 (UL; 728 of 1,000 cells) and 60.8% of L5-6 (DL; 304 of 500 cells; n=3 brains from 2 litters) PyNs are of IT-type. q, P5 tamoxifen induction in Lhx2-CreER;Ai14 shows dense labelling of L2-4 PyNs and sparse labelling in L5/6 in P28 cortex (Left panel) Most labelled PyNs are of the IT class expressing SATB2 (middle and right panels; UL, 92.4% - 924 of 1,000 cells; DL, 90.5%–181 of 200 cells; n=3 brains from 2 litters). r, P15 tamoxifen induction in Lhx2-CreER;Ai14. (Upper) Quantification in SSp-bfd shows 58% cells are glia (Mean values for number of cells in SSp-bfd ± SEM. *P < 0.05 compared to PyN number, unpaired Student’s t-test). (Lower) Labelled PyNs are distributed across cortical layers with more labelling in L5a and L4 (n=3 brains from 2 litters). s, Presence of RGsLhx2+Fezf2 (RFP) and RGsLhx2+Fezf2+(EGFP) at E11.5 throughout cortical primordium revealed by intersection/subtraction fate-mapping with 24-hour pulse-chase in Lhx2-CreER;Fezf2-Flp;IS mice, schematized in Fig. 1i (Also see Fig. 1j–n). These progenitors distribute in a medial high-lateral low gradient along the dorsal neuroepithelium, ending at the cortex–hem boundary (Hm). Rostral, Mid and Caudal sectioning levels show a caudal high-rostral low distribution of RGsLhx2+Fezf2 and RGsLhx2+Fezf2+. s’, Magnified view shows RGsLhx2+Fezf2 and RGsLhx2+Fezf2+ at multiple cell cycle stages with endfeet (arrow) and dividing soma (arrowhead) at ventricle wall (dashed line). t, Upper, total number of RGsLhx2+Fezf2+ (green) is approximately half that of RGsLhx2+Fezf2 (red). Lower, quantification of RGsLhx2+Fezf2 versus RGsLhx2+Fezf2+ at rostral (R), mid-level (M) and caudal (C) sections revealed their caudalhigh-rostrallow distribution. Scale bars: 20µm (high magnification) in a, c, e, g, i, k, s’; 100µm for all other panels.
Extended Data Fig. 2
Extended Data Fig. 2. Lhx2 and Fezf2 driver lines precisely recapitulate endogenous developmental expression patterns.
a, Anti-LHX2 immunohistochemistry on a 24-hour pulse-chase in a E12.5 Lhx2-CreER;Ai14 embryo revealed that 99.2% RGsLhx2+ express LHX2 (1410 of 1422 cells; n = 4 embryos from 2 litters). High magnification images show colocalization (arrowheads). Note the medialhigh-laterallow gradient. b, 24-hour pulse-chase in a E10.5 Lhx2-CreER;Ai14embryo densely labelled RGs throughout the dorsal neuroepithelium, ending medially at the cortex–hem boundary (Hm). This expression recapitulated Lhx2 mRNA in-situ hybridization at E10.5 (reproduced/adapted with permission from Development). c, Same experiment as in b done at E12.5. The medialhigh-laterallow gradient of RGsLhx2+ is highly similar to Lhx2 mRNA expression (reproduced/adapted with permission from Development). d, Same experiment as in b done at E13.5. Note the reduction in RGsLhx2+ and concomitant increase in post-mitotic cells (arrowheads), in both the Lhx2 driver line and mRNA expression (ISH Data: Allen Brain Atlas: Developing Mouse Brain). e, anti-LHX2 immunohistochemistry on a 24-hour pulse-chase in a E12.5 Fezf2-CreER;Ai14 embryo reveals that 89.7% RGsFezf2+express LHX2 (376 of 419 cells; n =4 embryos from 2 litters); high magnification images show colocalization (arrowheads) and non-colocalization (arrow and encircled). f, 24-hour pulse-chase in a E10.5 Fezf2-CreER;Ai14 embryo. The spatial extent of RGsFef2+ is restricted compared to RGsLhx2+ at this stage. This sparse labelling recapitulated Fezf2 mRNA expression at E10.5 (reproduced/adapted with permission from J Comp Neurol). g, Same experiment as in f done at E12.5. The medialhigh-laterallow distribution gradient of RGsFezf2+ is also seen with Fezf2 expression at this stage. Note RGsFezf2+ are sparsely labelled compared to RGsLhx2+using in-situ hybridization at E12.5 (reproduced/adapted via Open Access from Neural Dev). h, Same experiment as in f done at E13.5. The drastic decrease of Fezf2expression in RGsFezf2+ accompanied by an increase in post-mitotic PyNs (arrowheads) is comparable in both Fezf2-CreER; Ai14 and Fezf2 in-situ data (ISH Data: Allen Brain Atlas: Developing Mouse Brain). i, anti-LHX2 immunohistochemistry on E13 Fezf2-FlpO;FSF-tdTomato embryo reveals that 91.7% RGsFezf2+ express LHX2 (718 of 783 cells; n = 4 embryos from 2 litters). Similar to e. high magnification images show colocalization (arrowheads) and non-colocalization (asterisk). Note the medialhigh-laterallow gradient. Scale bars for low mag images = 100µm in a-i. Scale bars for high mag images = 20µm in a, e, i.
Extended Data Fig. 3
Extended Data Fig. 3. Fate-mapping neurogenic and intermediate progenitors.
a, Fate-mapping strategy for intermediate progenitors (IPs) and indirect neurogenesis, used in c-e. Tbr2-CreER labels an IP and all of its progeny with a fluorescent marker when combined with Ai14 (Left). The intersection of Tis21-CreER and Tbr2-FlpER specifically targets neurogenic IPs when combined with the Ai65 intersectional reporter (Right). b, Simultaneous fate-mapping of different molecularly defined neurogenic RGs using an intersection/subtraction reporter (IS) combined with Tis21-CreER and Fezf2-Flp drivers. This scheme is used in h-k. In RGsTis21+Fezf2, Cre activates RFP expression only. In RGsTis21+Fezf2+, Cre and Flp recombinations remove the RFP cassette and activate EGFP expression. At a later stage when Fezf2 is only expressed in postmitotic deep layer PyNs, Tis21-CreER in RGs activates RFP expression in all of its progeny, but RFP is then switched to EGFP only in Fezf2+ PyNs expressing Flp. c, E16.5 IPs densely labelled by 12-hour pulse-chase in Tbr2-CreER;Ai14 mice; magnified view shows IP somata (arrowhead) away from the lateral ventricle (dashed line) lacking radial fibers and endfeet. d, Fate-mapping E16.5 IPs in Tbr2-CreER;Ai14mice labels PyNs in L2-3 cortex at P28. e, Intersectional fate-mapping of neurogenic IPs at E16.5 in Tis21-CreER;Tbr2-FlpER;Ai65 mice, as depicted in a, labelled L2-3 PyN progeny in P28 cortex. f, 48-hr pulse-chase in E10.5 Tis21-CreER;Ai14 embryo labels Tis21+ neurogenic progenitors (nRGs) and their postmitotic progeny throughout the neural tube, including dorsal pallium (high magnification). Self-renewing RGs are identified by their endfeet at the ventricular surface (arrowheads) and radial fibers (arrow). g, Fate-mapping of E10.5 nRGs to mature cortex reveals PyNs are distributed throughout cortical layers. Note that multipolar GABAergic interneurons (some in layer 1) derived from subpallium nRGs are also labelled (arrowheads). h, The presence of nRGsFezf2 and nRGsFezf2+ at E11.5 is revealed by intersection/subtraction fate-mapping with 24-hour pulse-chase in Tis21-CreER;Fezf2-Flp;IS mice, schematized in b; magnified view shows RFP-labelled nRGsFezf2 and EGFP-labelled nRGsFezf2+. i, Fate-mapping E11.5 nRGs using Tis21-CreER;Fezf2-Flp;IS mice. The mixed RFP and EGFP clone is likely to have derived from a nRGFezf2, which activated RFP expression in all progeny and EGFP expression was then switched on only in Fezf2+ postmitotic deep layer PyNs expressing Flp. j, k, More examples of differential fate-mapping of nRGsFezf2 and nRGsFezf2+ from E12.5 to the mature cortex using the scheme in b. The majority of clones consist of mixed RFP and EGFP PyNs (j’), and rarely RFP-only (j”) or EGFP-only PyNs (k). RFP-only clones (1 of 29) probably derive from nRGFezf2 whose progeny were all Fezf2− (j”). EGFP-only clones (2 of 29) are derived from nRGsFezf2+, suggesting multipotency of RGsFezf2+ (k). Mixed RFP/EGFP clones are most prominent and are likely to result from Cre activation of RFP in nRGsFezf2 and subsequent Flp activation of EGFP in Fezf2+ L5/6 postmitotic PyNs (i,j’). Scale bars: 500µm in d, j, k; 100µm in d (high mag), e, f, g, h, i, j’,j”, k (high mag); 20µm in c, e, h.
Extended Data Fig. 4
Extended Data Fig. 4. Comparison of new with existing driver lines in terms of areal and laminar patterns.
a, Side-by-side comparison of Cre recombination patterns from 8 mouse driver lines characterized in this study (blue font) and 4 existing driver lines (black font) visualized through reporter expression (green; background autofluorescence in red), grouped according to IT, PT and CT projection classes. First row: coronal hemisections at Bregma -1.7 mm. Second row: Image panel showing cortical depth detailing cell body distribution pattern of PyN subpopulations within SSp-bfd taken from the hemisection above at level Bregma -1.7 mm. Third row: coronal hemisections at Bregma 0 mm. Image panel showing cortical depth detailing cell body distribution pattern of PyN subpopulations within MOp taken from the hemisection above at level Bregma 0 mm. For comparison to the PT driver Sim1-Cre transgenic line, see reference 37. b, Cortex-wide distribution patterns of PyN subpopulations viewed as cortical flatmaps in a side-by-side comparison of 8 newly generated (blue font) and 4 existing driver lines (black font): first row, normalized for each dataset’s total number of cells detected; second row, absolute scale per flatmap grid area, with maximum number of cells for any PyN subpopulation. Arrowheads indicate gaps in expression and labelling. b’ shows cortical flat-mapping coordinate space and two exemplary coronal hemisections describing the demarcations used to generate the cortical grid for flatmapping. c, Overview of brain-wide cell body distribution patterns for each driver line. This table provides an overall impression of the recombination patterns in major adult brain regions in selected lines. d, Histograms showing normalized laminar distribution for six genetically targeted PyN subpopulations by cortical area. Brain-wide cortical depth quantification was performed based on cell detection by convolutional networks from GeneX-CreER driver lines crossed to Ai14 (R26-LSL-tdTomato), R26-LSL-h2b-GFP or Snap25-LSL-EGFP reporters and induced at the ages specified in Fig. 2, and P7 for Sema3E. The normalized cortical depth (0-1) was divided into 24 bins for the left histogram and 124 bins for the right plot in each panel. Abbreviations explained in the Supplementary Information. Scale bars: Last panel of first and third rows applies to all hemisections, 1mm; last panel of second and fourth rows applies to all cortical depth image panels, 200µm.
Extended Data Fig. 5
Extended Data Fig. 5. Comparison of new with existing driver lines in terms of axon projections from SSp-bfd somatosensory cortex.
a-c, STP images at the SSp injection site (first row, arrow head) and at selected subcortical projection targets for eight driver lines characterized in this study (coloured gene names code for IT-red, PT-blue and CT-purple) compared to seven existing driver lines (black gene names), with EGFP or EYFP expression from Cre-activated viral vector (green) and background autofluorescence (red). Arrows point to axons. a, IT drivers project to cortical and striatal targets. PyNsPlxnd1 project bilaterally to cortex and striatum; PyNsCux1 project bilaterally to cortex but not to striatum. b, PT drivers project to many corticofugal targets including brainstem and spinal cord. PyNsFezf2, PyNsAdcyap1 and PyNsTcerg1l project to multiple ipsilateral targets and to the contralateral brainstem (arrows). c, CT drivers project predominantly to the thalamus. PyNsTbr1 project bilaterally to cortex and to ipsilateral thalamus, PyNsFoxp2 and PyNsTle4 project to the ipsilateral cortex and thalamus. Scale bars: first row in c (applies to first row), 1 mm; second to eighth rows in c (applies to each respective row), 200 µm; CST panel (bottom row) in c applies to entire row, 100 µm. Asterisks in b & c indicate presence of passing fibers. A side-by-side list of axon projection matrix for all these lines is presented in Fig. 3d.
Extended Data Fig. 6
Extended Data Fig. 6. Molecular validation and developmental characterization of PyN driver lines.
a, d, Low magnification images of sections of somatosensory cortex (SSp) at P7 stained with antibodies against CTIP2, CUX1, and tdTomato from PyN-CreER;Ai14 mice induced with tamoxifen. Inset to the right shows markers and Tomato+cell distributions across layers. Fezf2-, Tcerg1l-, Adcyap1- and Tle4-CreER;Ai14 were induced at E16.5 and collected at P7. Tbr1-, Cux1- and Plxnd1-CreER;Ai14 were induced at P4 and collected at P7. Tbr2-CreER;Ai14 was induced at E16.5 (not shown) or E17.5 and collected at P7. Lhx2-CreER;Ai14 was induced at P3 and collected at P7. a’, d’, Histograms showing radial distribution of Tomato+ cells in the cortical plate, in the region corresponding to SSp. In brief, in CUX1- and CTIP2-stained sections, Tomato+ cell depths relative to the thickness of the cortex were measured, as well as the limits of the areas occupied by CUX1+ or CTIP2HIGH cells, shown in green (layers 2-4) and blue (layer 5b) bars, respectively (average relative values for the same sections, gray shading corresponds to 1 SD). For Tbr2-CreER;Ai14, mice induced at E16.5 or E17.5 were quantified separately, showing the later induction (darker red) results in more superficial labelling. Quantifications were made from 4-10 sections from 2-3 different mice for each line. b, e, Magnification of Tomato+ cells in sections co-stained against CUX1 and CTIP2, LDB2 (enriched in PT), FOG2 (expressed in CT), BRN2, or SATB2 (expressed in IT). Arrowheads show double-positive cells; asterisks show Tomato+ cells not expressing the marker. c, f, Percentage of Tomato+ cells stained with each antibody. Quantifications were done in equivalent areas (320µm by 320µm) within the SSp centered in the specified layers. Each dot is an area from a different section, for which the percentage of double positive cells was calculated. Bars are mean+SD. Quantifications were made from 4-8 sections from 2-3 different mice for each line. Tbr2-CreER;Ai14 labelled CUX1+, SATB2+, BRN2+ IT in the most superficial layers 2-3, irrespective of their induction time. Lhx2-CreER;Ai14 and Cux1-CreER;Ai14 labelled CUX1+, SATB2+, BRN2+ IT deeper in layers 2-3. Plxnd1-CreER;Ai14 labelled SATB2+, BRN2+cells in layer 5A, as well as CUX1+, SATB2+, BRN2+ cells in layer 4. No cells were found in layer 5B. Tcerg1l-CreER;Ai14 and Adcyap1-CreER;Ai14 labelled sparse LDB2+, CTIP2+ PT in layer 5. Fezf2-CreER;Ai14 extensively labelled PT in layer 5 that were LDB2+, CTIP2+, as well as some CT in layer 6 expressing CTIP2 and FOG2. Tle4-CreER;Ai14 and Tbr1-CreER;Ai14 labelled CT expressing FOG2 and CTIP2 (and lower levels of LDB2) in layer 6. Tle4-CreER;Ai14 also labelled some LDB2+, CTIP2+ cells in layer 5 (PT), whereas Tbr1-CreER;Ai14 also labelled some CUX1+, BRN2+ IT in layer 2/3. g, Fate-mapping of PyNsTbr1 using Tbr1-CreER; Ai14 mice. Tamoxifen induction at E14.5 densely labelled L6 CT cells with minor labelling of cells in layers 3-5. h, Tamoxifen induction at E15.5 labelled L6 CT cells. i, Tamoxifen induction at P4 labelled L6 CT cells and also a subset of L2/3 cells. A subset of adult PyNsTbr1 labelled from E14.5, E15.5 and P4 induction project to contralateral cortex via the corpus callosum (arrowheads, g’, h’, i’). Scale bars: g-i, low magnification, 500µm; high magnification, 100µm.
Extended Data Fig. 7
Extended Data Fig. 7. Anterograde tracing, registration to CCFv3 and analysis of PyN projections from SSp-bfd.
a, Summary table of driver lines and viral vectors used for anterograde tracing from PyNs in primary somatosensory cortex, related to Fig. 3. b, Virus injection centroid coordinates across single driver experiments in CCFv3 space on a dorsal whole-brain view. c-e, Whole-brain 3D renderings of axon projections registered to CCFv3 and main projection targets for each PyN subpopulation in the SSp-bfd. f, Axon projection matrix from SSp-bfd to 321 ipsilateral and 321contralateral targets (in columns), each grouped under 12 major categories (top row) for each of the driver lines generated in this study highlighted in Fig. 3, and presented alongside several previously published driver lines (IT lines: Cux2, Sepw1, Rasgrf2, Tlx3; PT lines: Rbp4, Sim1; CT lines: Ntsr1) for comparison (see Extended Data Fig. 5 for images). Colour shades in each row represent fraction of total axon signal measured from a single experiment per brain area; signal in the inj. site (white) was subtracted from total axon signal to show the fraction of projections outside the inj. site. PyNsPlxnd1 project bilaterally to CTX and Str; PyNsCux1 project bilaterally to CTX but minimally to Str; PyNsFezf2, PyNsAdcyap1 and PyNsTcerg1l project to multiple ipsilateral targets, and contralateral brainstem (arrows); PyNsTbr1 project bilaterally to CTX and ipsilaterally to thalamus, PyNsFoxp2 and PyNsTle4 project to the ipsilateral CTX and thalamus. Scale bar in d (for all 3D renderings in c-e), 2 mm. Asterisks in f indicate passing fibers. Abbreviations explained in the Supplementary Information.
Extended Data Fig. 8
Extended Data Fig. 8. Anterograde tracing of axon projections from one or two PyN populations using single- or double-allele driver mice, respectively.
a, 3D rendering from STP imaging of PyNsSema3E projection pattern based on injection of AAV9-Ef1a-DIO-ChR2-EYFP followed by tamoxifen induction (2 days post-injection): dorsal view (left) and parasagittal view (right). b, Coronal section containing injection site in a Sema3E-CreER;Ai14 mouse. c, PyNsSema3E project via the cerebral peduncle (cp) to the pons (Pn). PyNsSema3E infected with AAV9-Ef1a-DIO-ChR2-EYFP express EYFP/tdTomato; all other PyNsSema3Eexpress tdTomato by tamoxifen induction. d, PyNsSema3E at injection site, showing somata in layer 5 with slender tufted apical dendrites. e, PyNsSema3E axons in thalamus with large boutons in POm (e’). f-r, Simultaneous anterograde tracing from two driver allele-defined PyN populations. f, Schematic showing simultaneous anterograde tracing from PyNs targeted by Fezf2-Flp (green) and Tle4-CreER (red) with co-injection of Flp- and Cre- dependent AAVs expressing EGFP and mCherry, respectively (g-l). g, PyNsFezf2 and PyNsTle4 at the injection site occupying mainly L5B and L6, respectively. h, PyNFezf2 and PyNTle4 projection patterns converge in primary thalamus, VPM, whereas PyNsFezf2 collaterals (asterisk) extend medially to higher order thalamic nuclei. i, PyNsFezf2 (green) extend axon collaterals in Str, whereas PyNsTle4 (red) pass through en route to thalamus. j-l, PyNsFezf2 but not PyNsTle4 project to multiple other corticofugal targets, including SC, Pn and cSp5. m, Schematic showing simultaneous anterograde tracing from PyNs targeted by Plxnd1-Flp (green) and Fezf2-CreER (red) with co-injection of Flp- and Cre-dependent AAVs expressing EGFP and mCherry, respectively (n-r). n, PyNsPlxnd1 and PyNsFezf2 at the injection site in motor cortex occupying mainly L5A and L5B/L6, respectively. o-p, PyNsFezf2 but not PyNsPlxnd1 project to Thal (o) and medulla (p). q-r, PyNsPlxnd1 and PyNsFezf2 project to ipsilateral Str with overlapping terminals (r), whereas PyNsPlxnd1 but not PyNsFezf2 project to contralateral Str (q). Asterisks indicate PyNFezf2 collaterals and arrows indicate PyNPlxnd1 collaterals. Scale bars: a, 2 mm; b, 1 mm; c-e, 200 µm; e’, 100µm; l (applies to g-l), 200µm; n-r, 200µm; q’ & r’, 100µm.
Extended Data Fig. 9
Extended Data Fig. 9. Intersectional dissection of PyN subpopulations.
a, Strategy for retrograde labelling of PyNFezf2 subpopulations by viral or tracer injections from the spinal cord of Fezf2-CreER mice. b, PyNFezf2corticospinal neurons in L5B of sensorimotor cortex labelled by retroAAV-flex-tdT. cFezf2CreER;Ai14 captures >95% of retrogradely labelled Fluorogold+ corticospinal neurons. Inset arrows indicate Fezf2 and Fluorogold co-labelling. d, An intersection-subtraction (IS) reporter strategy to label projection-defined PyNFezf2 subpopulations (retroAAV-Flp, EGFP) within the overall population (Fezf2-CreER, RFP). e, f, In motor cortex (MO), thalamus-projecting PyNsFezf2 are located in upper L5B, whereas medulla-projecting PyNsFezf2 are located in lower L5B. g, In SSp-bfd, PyNsFezf2 labelled from a defined projection target (EGFP) show more restricted sublaminar position in L5 compared to overall population (RFP). h, Normalized cortical depth distributions of overall PyNFezf2 population (leftward curve) and of each target-defined subpopulation (rightward curves) in SSp-bfd. i, In Fezf2-CreER;Pv-Flp;IS triple allele mice, PV- and PV+ PyNsFezf2 are distinguished by their expression of RFP and EGFP, respectively, in SSp-bfd. j, Sample voltage responses induced by current injection from a pair of PV+ (EGFP) and PV- (RFP) PyNsFezf2 by whole-cell patch recording in a cortical slice., Electrophysiological differences between 5 pairs of PV+ and PV- PyNsFezf2: resting membrane potential (Vm, -66.5 ± 1.6 vs. −70.7 ± 1.5 mV, mean ± s.e.m.; p = 0.0014, Student’s paired t-test); input resistance (MΩ, 60.1 ± 7.8 vs. 108.7 ± 45.4 MΩ, mean ± s.e.m.; p = 0.23, Student’s paired t-test). k, PyNsFezf2 retrogradely labelled from thalamus and medulla are distributed in the upper or lower L5B, respectively, in the motor cortex (related to e, f). In a Fezf2-CreER;IS mouse (upper panels), retroAAV-Flp was injected in thalamus. In a Fezf2-CreER mouse (lower panels), retroAAV-Flex-GFP was injected into the medulla. l-q, Representative hemi-sections containing the SS-bfd showing the labelling patterns of PyNsFezf2, PyNsPlxnd1, PyNsTle4 subsets by retroAAV-Flp injections at subcortical targets (arrows) in PyN-CreER;IS mice. In each panel, the overall PyN-CreER population was labelled by RFP, whereas the target-specific subset expressed EGFP. Corresponding cortical soma depth distribution is shown for Fezf2 hemisections in g, h and to the right for Plxnd1 (p) and Tle4 (q) hemisections (n = 2 for each target). PyNsTle4 project to VPM and consist of two subpopulations with apical dendrites in L4/5 (q’) and L1 (q’’), respectively, indicated by arrows. r, Retrograde targeting of striatum-projecting PyNsPlxnd1 by injection of retroAAV-FLEX-tdTomato in striatum. s, Coronal section displays injection site (arrowhead) and collaterals of retrogradely labelled PyNsPlxnd1 in contralateral striatum (arrow). t-w, Laminar patterns of retrogradely labelled PyNsPlxnd1 reveal that L5A PyNsPlxnd1project to both ipsi- and contralateral striatum, whereas L2/3 PyNsPlxnd1 project to ipsilateral striatum (t, u, v, w). x, Validation of four PyN driver lines by fluorescence in situ hybridization (Plxnd1, Fezf2, Tcerg1l) and antibody (TLE4) using Plxnd1-, Fezf2-, Tcerg1l-CreER driver mice bred with a Rosa26-loxpSTOPloxp-H2bGFP reporter. H2bGFP signal colocalized with mRNA in situ signals of Plxnd1, Fezf2 and Tcerg1l. In Tle4-Cre;Ai14 mice, RFP signals colocalized with immunofluorescence of the TLE4 antibody. Scale bars: b, l-q, 500µm; c, e, g, q’, q’’, x, 50µm; i, s-w, 100µm. Abbreviations explained in the Supplementary Information.
Extended Data Fig. 10
Extended Data Fig. 10. Strategy to target PyN subpopulations combining driver line, projection target and cortical location.
a, Left schematic shows the ‘triple trigger’ strategy for combinatorial targeting by marker, axon target and soma location. Upon Cre and Flp recombination, the dual-tTA reporter expresses the transcription activator, tTA. In a Fezf2-CreER;dual-tTA mouse, tamoxifen induction combined with retrograde retroAAV-Flp injection at the target, cSp5 or SC, activate tTA expression in cSp5- or SC-projection PyNsFezf2 across cortical areas, and AAV-TRE-mRuby anterograde injection at SSp-bfd then labels projection-defined PyNsFezf2 in the SSp-bfd. Coronal images of PyNsFezf2 in SSp-bfd with projection to SC or cSp5, displaying axon collaterals at various subcortical targets, including Str, ZI, thalamus, pons. b, Left schematic depicts the control experiment for use of Cre- and Flp-dependent dual-tTA reporter for target-defined axon projection mapping of PyNsFezf2. Co-injection of a Cre-dependent AAV-DIO-ChR2-EYFP (green, positive control) and tTA-activated AAV-pHB-TRE-mRuby2 (red, negative control), followed by tamoxifen induction, in absence of Flp confirms dependence of reporter on both Cre and Flp recombination. Example images of anterograde injection site (SSp-bfd) and axon projection targets of several indicated ipsi- and contralateral sites displaying EGFP+PyNsFezf2 axons from Cre-dependent AAV, but no mRuby2+ axons (in absence of Flp), demonstrating the dependence of ‘triple trigger’ strategy on intersection of Cre and Flp. Scale bars: a-b, 200 um.
Extended Data Fig. 11
Extended Data Fig. 11. A subset of PyNsFezf2 manifest IT features.
a-c, Retrograde injection of CTB (green) in the lateral striatum labelled a set of contralateral (a, b) and ipsilateral (c) PyNsFezf2 at the top of L5B in SSp-bfd. The whole population of PyNsFezf2 labelled in Fezf2-CreER;Ai14. Depth distributions in c compares total CTB-labelled PyNs (green), CTB+ Fezf2+ (magenta), and the whole population of PyNsFezf2 labelled in Fezf2-CreER;Ai14. d, e), Retrograde injection of CTB in the lateral striatum labelled a set of ipsilateral (d, d’) and contralateral (e, e’) PyNsFezf2 at the top of L5B in MO. f, Fezf2 and Plxnd1 mRNAs are co-expressed (f’, arrows) in a subset of L5 PyNs in the L5B/L5A border region. g, h, Intersection/subtraction mapping in Fezf2-CreER;Plxnd1-Flp;IS mice revealed a small set of PyNsFezf2/Plxnd1 (EGFP) located at the top of L5B among other PyNsFezf2 (RFP). Magnified insets are from the boxed regions in each panel. DAPI (blue) counterstain in c, f-h. Scale bars: a, g, 500µm; b, c, d, e, f, h, 50µm.

References

    1. Harris KD, Shepherd GM. The neocortical circuit: themes and variations. Nat. Neurosci. 2015;18:170–181. doi: 10.1038/nn.3917. - DOI - PMC - PubMed
    1. Huang ZJ. Toward a genetic dissection of cortical circuits in the mouse. Neuron. 2014;83:1284–1302. doi: 10.1016/j.neuron.2014.08.041. - DOI - PMC - PubMed
    1. Greig LC, Woodworth MB, Galazo MJ, Padmanabhan H, Macklis JD. Molecular logic of neocortical projection neuron specification, development and diversity. Nat. Rev. Neurosci. 2013;14:755–769. doi: 10.1038/nrn3586. - DOI - PMC - PubMed
    1. Lodato S, Arlotta P. Generating neuronal diversity in the mammalian cerebral cortex. Annu. Rev. Cell Dev. Biol. 2015;31:699–720. doi: 10.1146/annurev-cellbio-100814-125353. - DOI - PMC - PubMed
    1. Kawaguchi Y. Pyramidal cell subtypes and their synaptic connections in layer 5 of rat frontal cortex. Cereb. Cortex. 2017;27:5755–5771. doi: 10.1093/cercor/bhx252. - DOI - PubMed

Publication types

LinkOut - more resources