. 2021 Oct;598(7879):200-204.
doi: 10.1038/s41586-021-03910-8. Epub 2021 Oct 6.

An atlas of cortical arealization identifies dynamic molecular signatures

Affiliations

An atlas of cortical arealization identifies dynamic molecular signatures

Aparna Bhaduri et al. Nature. 2021 Oct.

Abstract

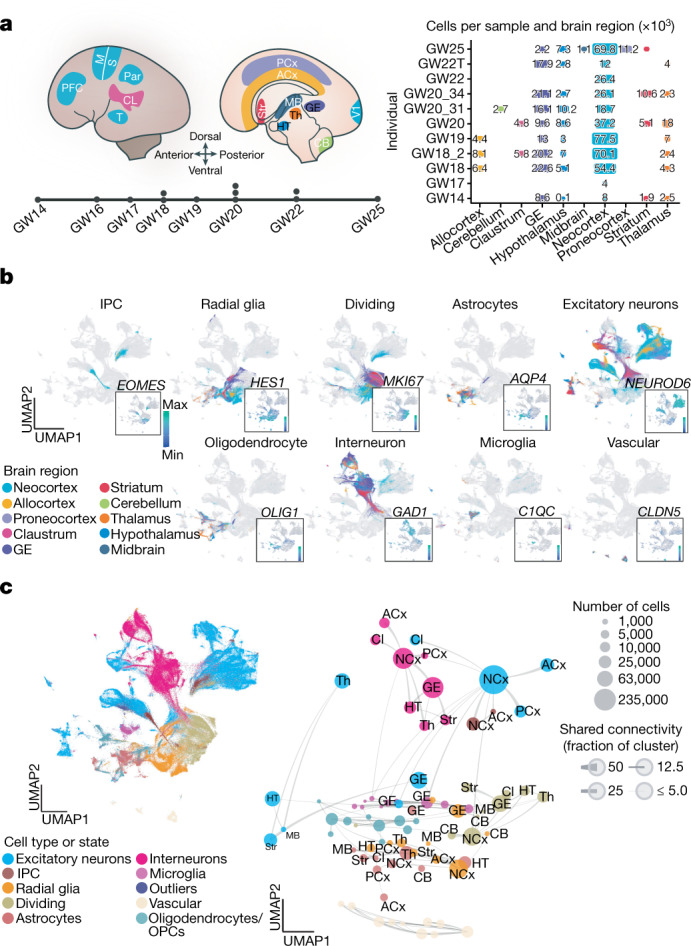
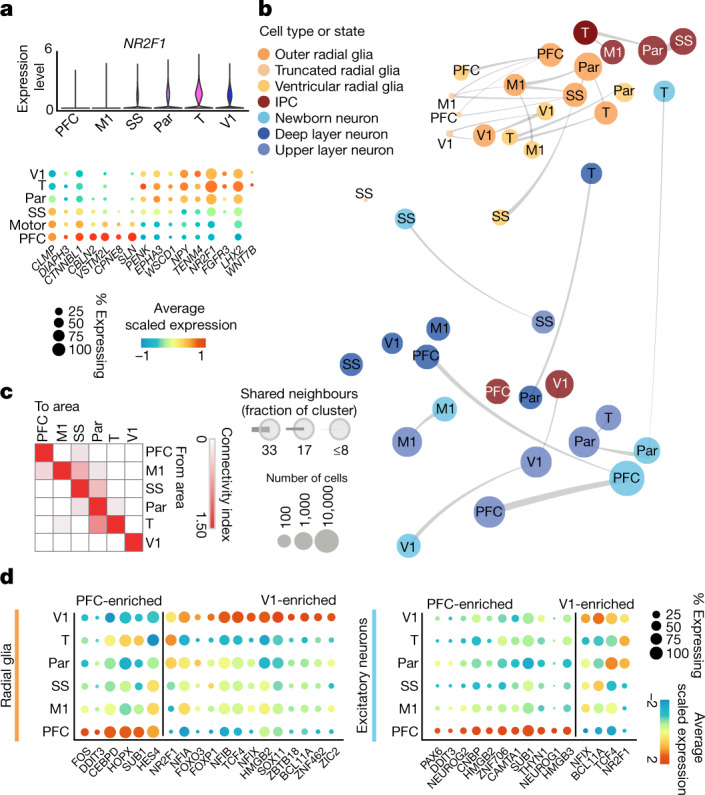
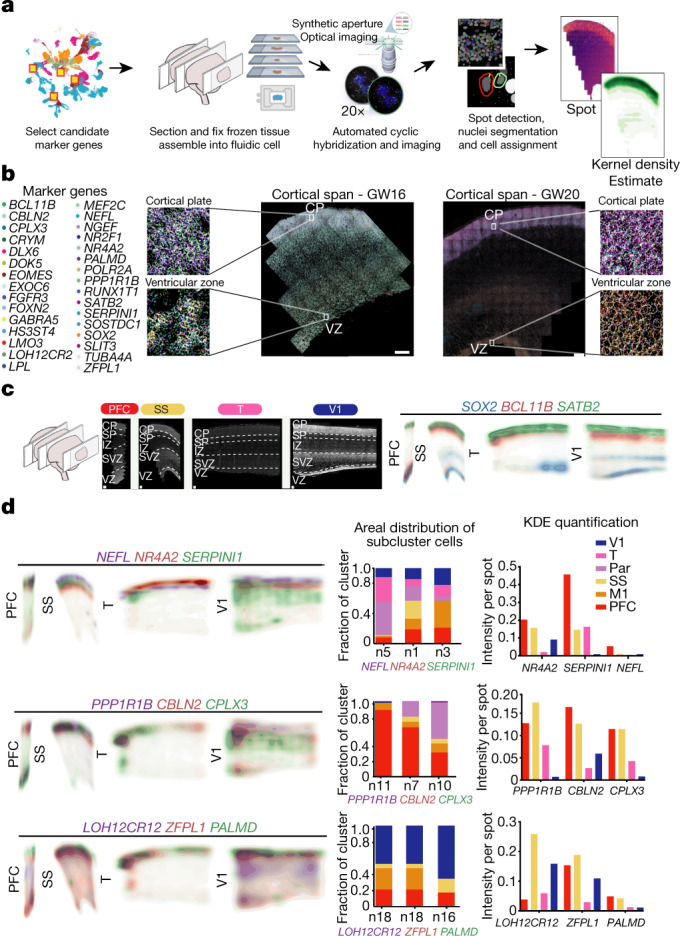
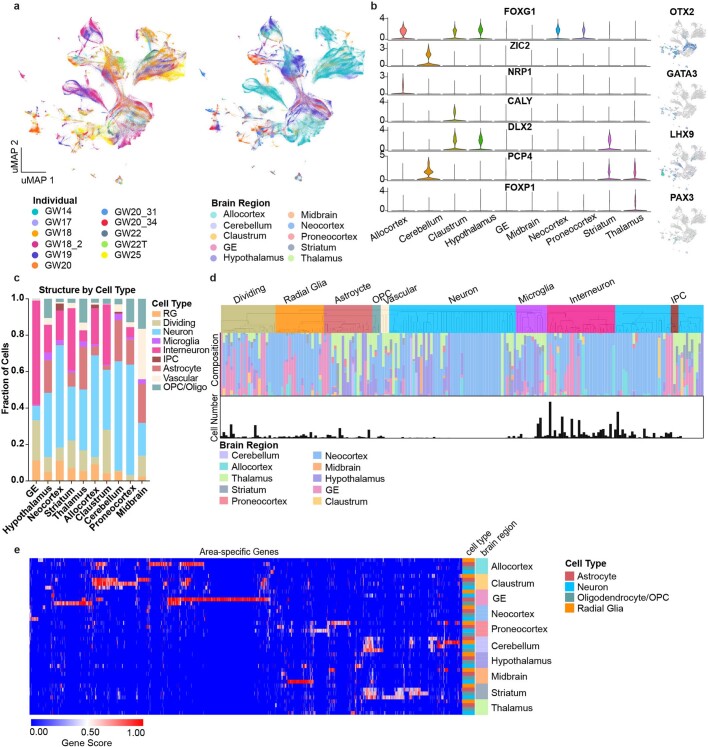
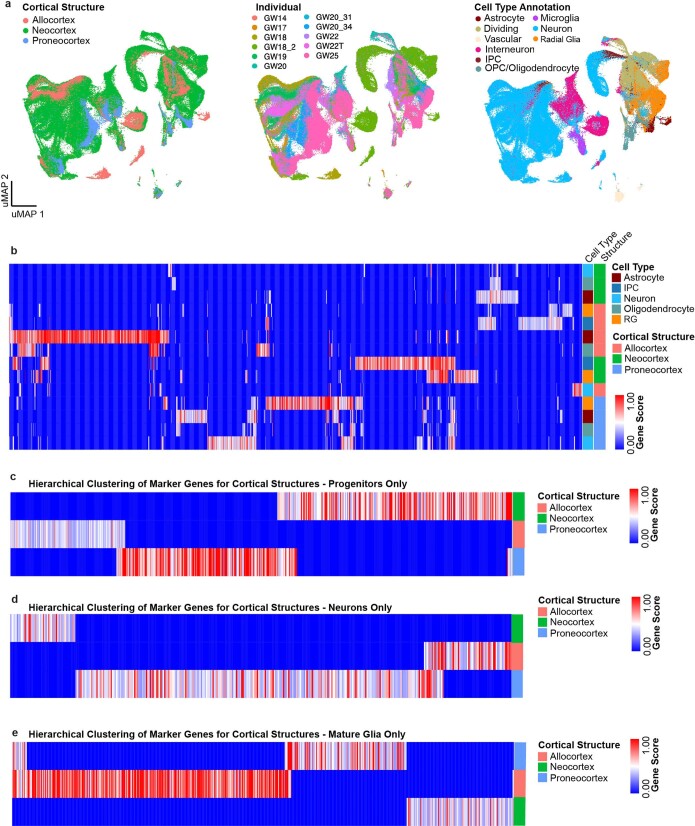
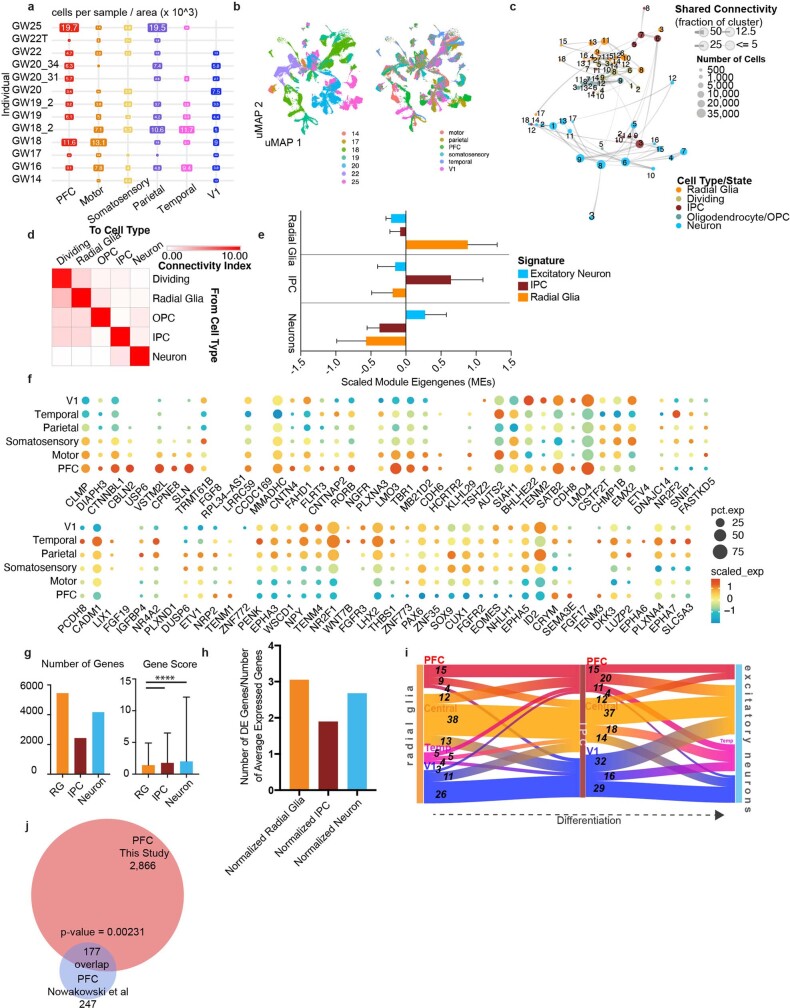
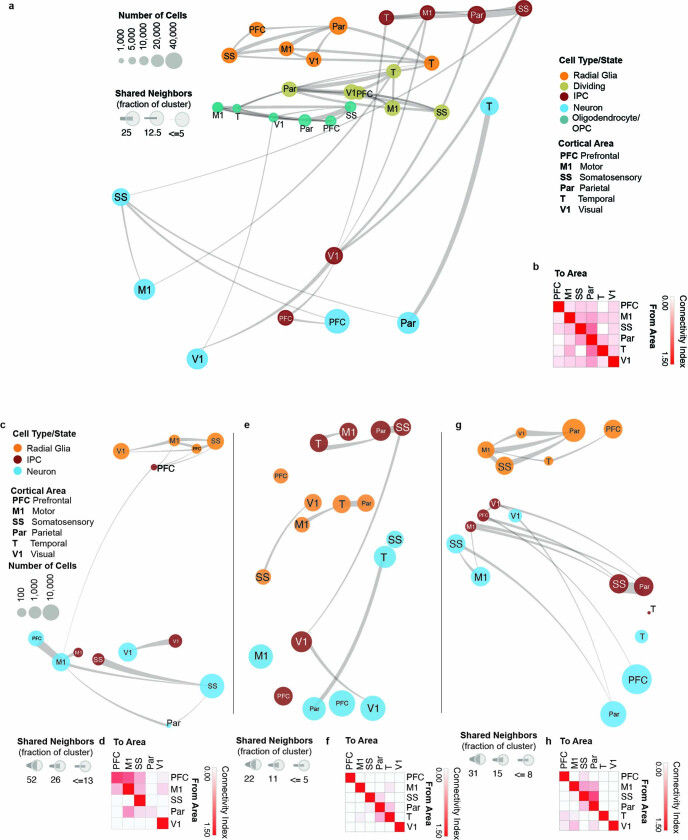
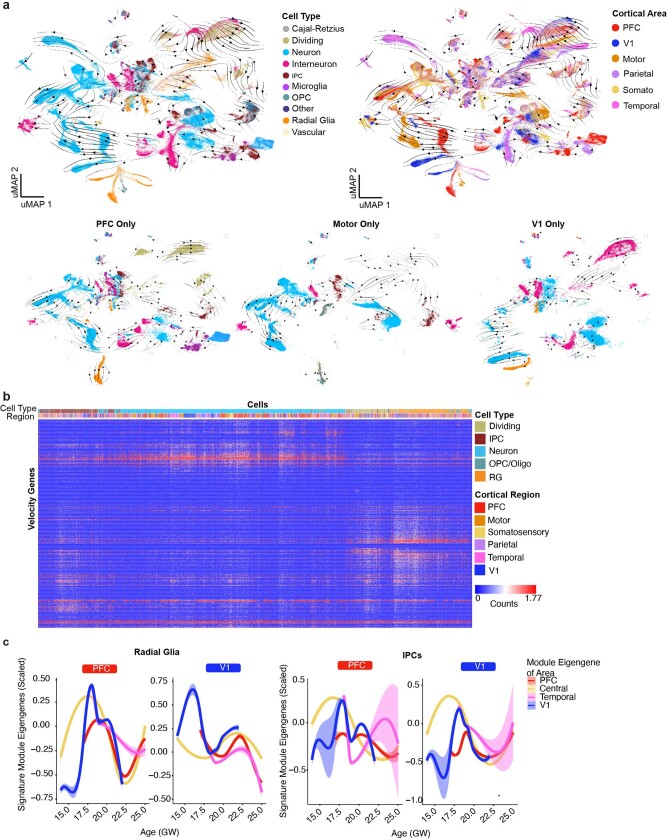
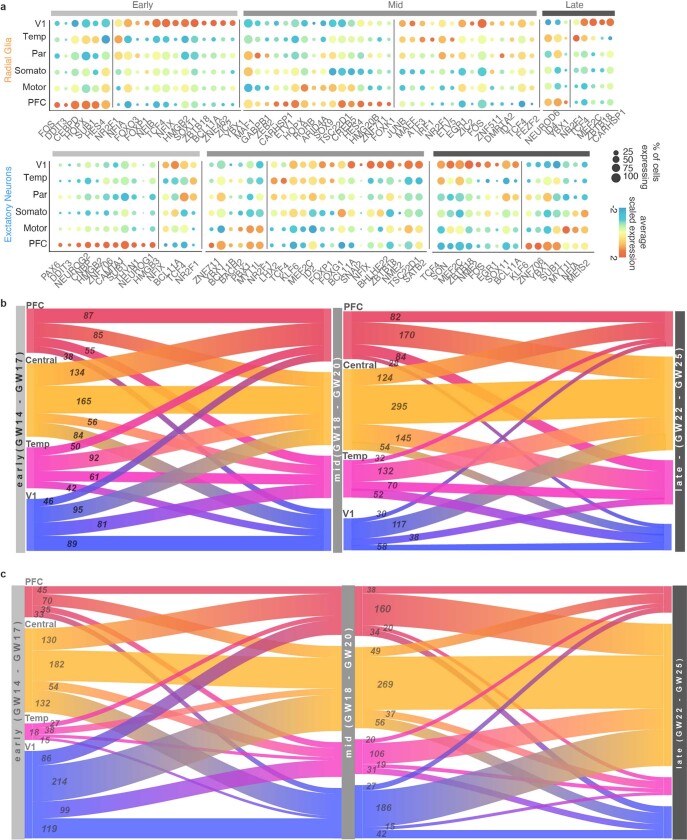
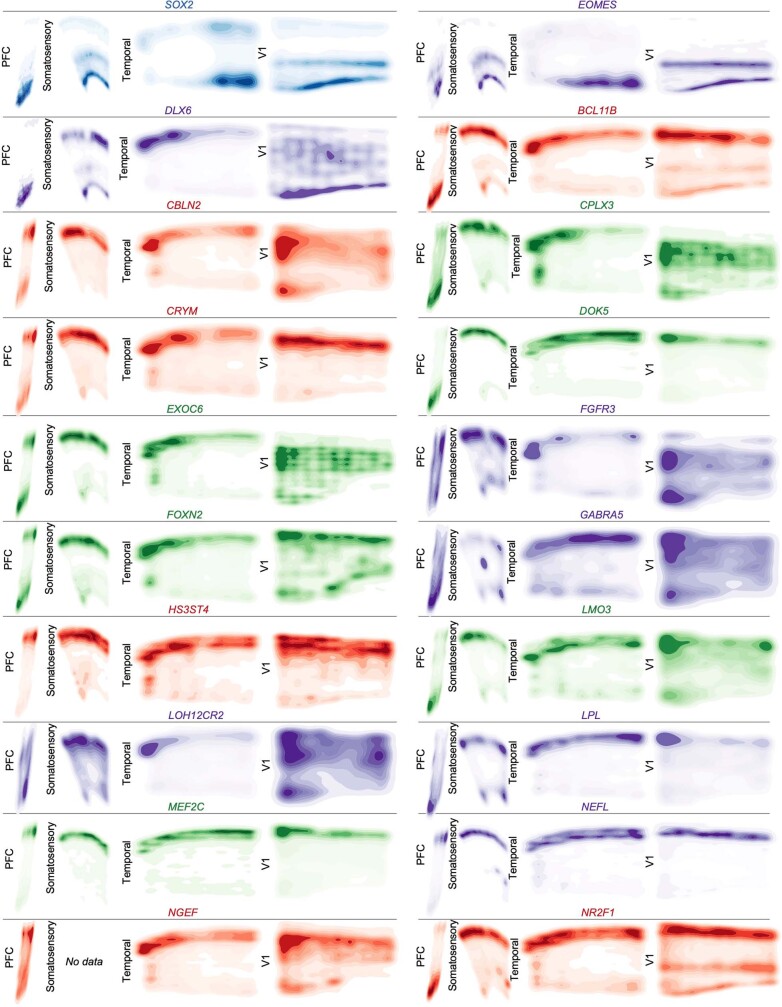
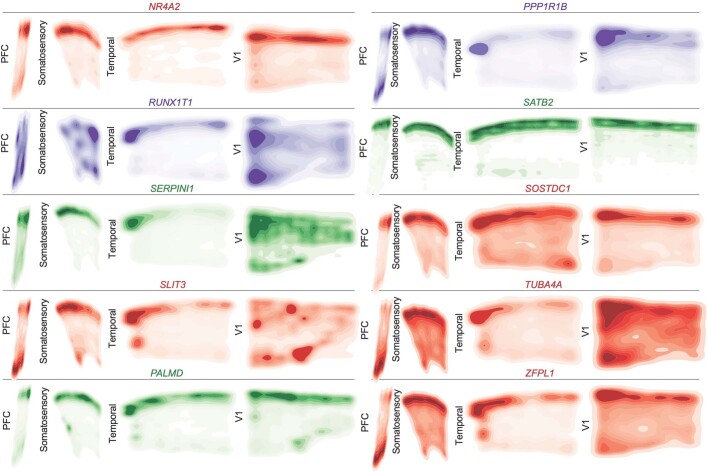
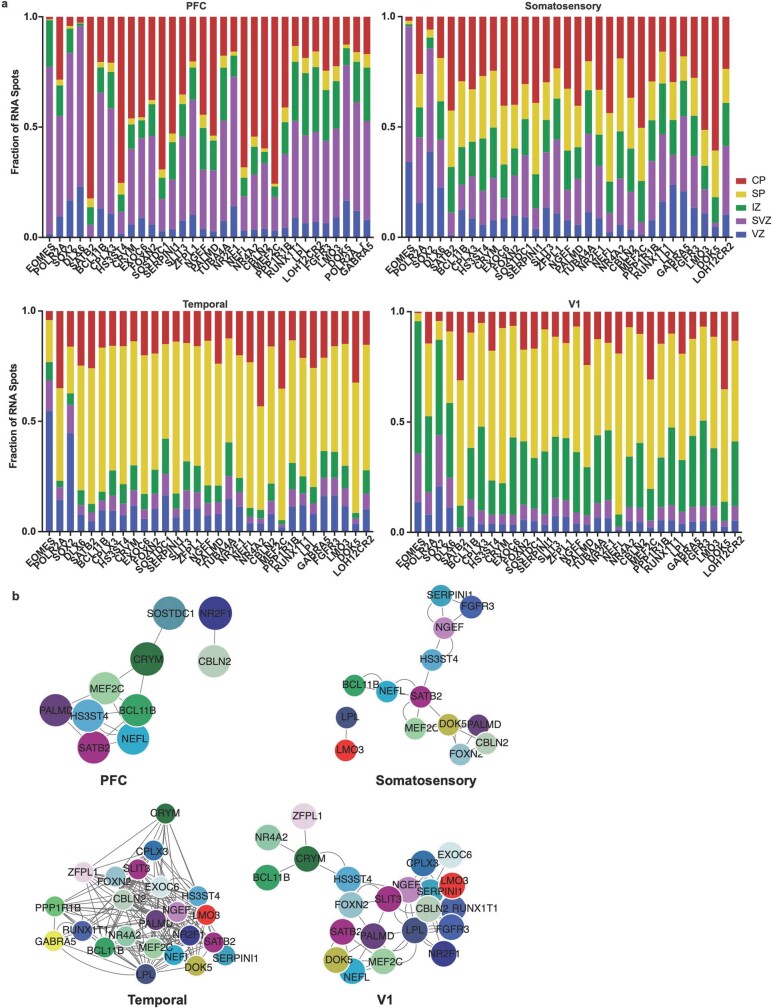
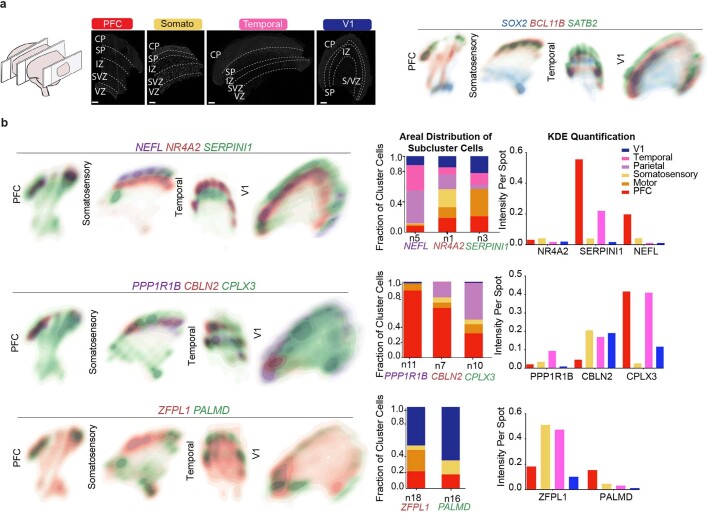
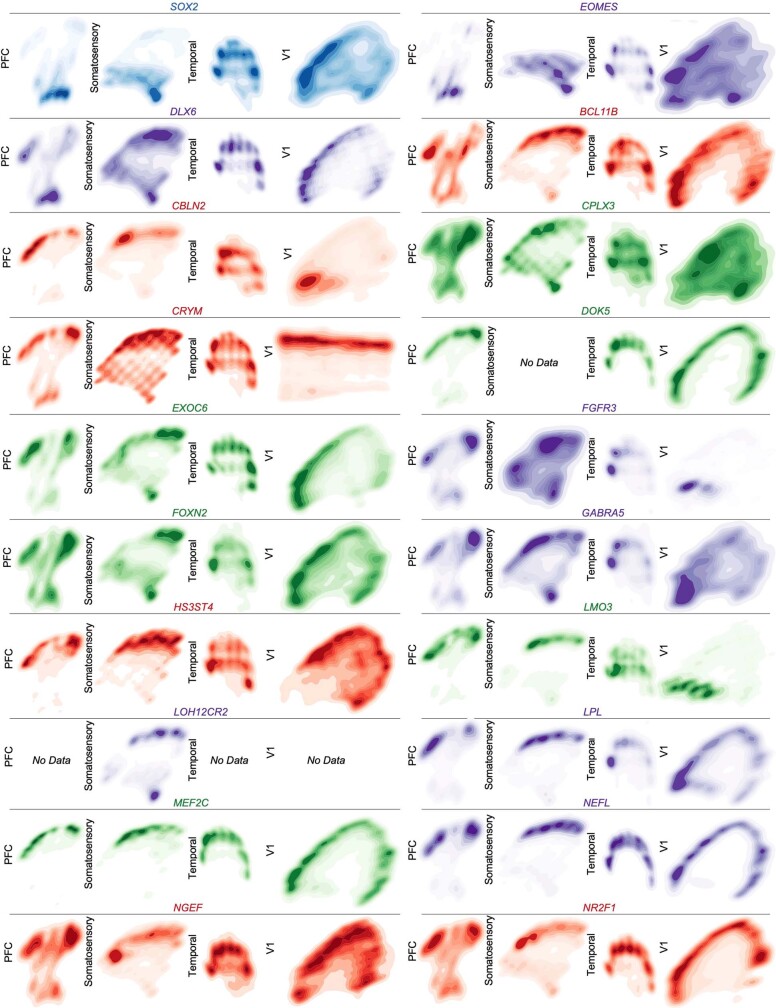
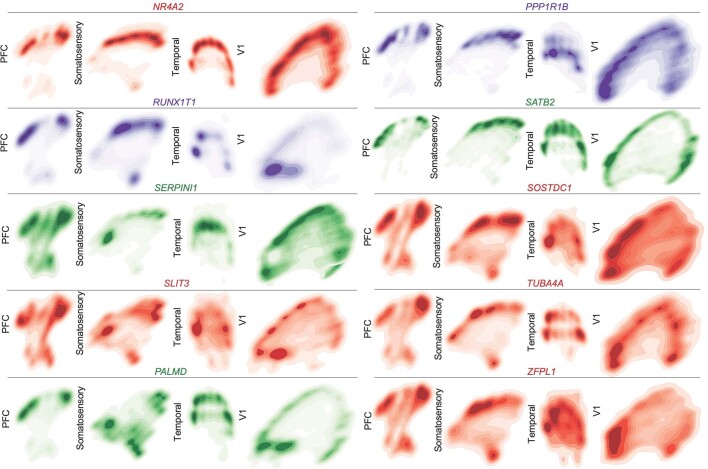
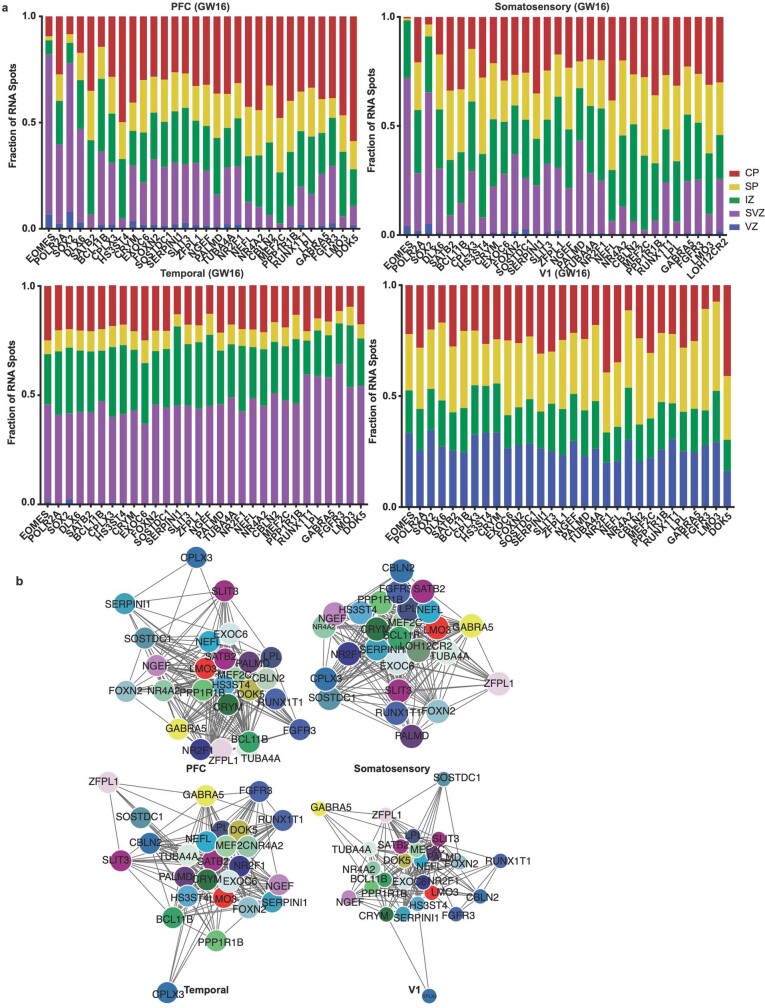
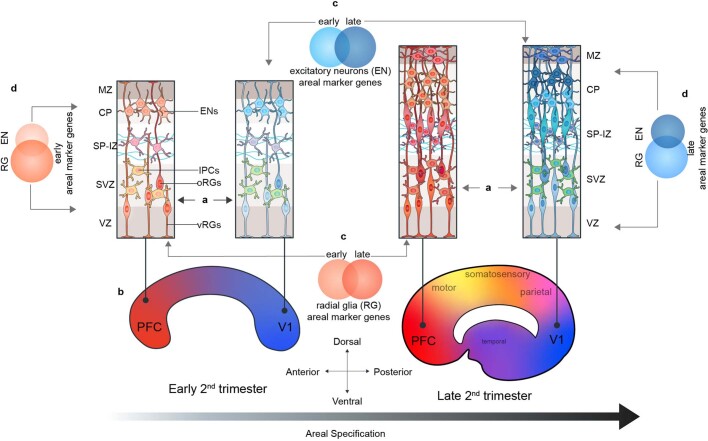
The human brain is subdivided into distinct anatomical structures, including the neocortex, which in turn encompasses dozens of distinct specialized cortical areas. Early morphogenetic gradients are known to establish early brain regions and cortical areas, but how early patterns result in finer and more discrete spatial differences remains poorly understood1. Here we use single-cell RNA sequencing to profile ten major brain structures and six neocortical areas during peak neurogenesis and early gliogenesis. Within the neocortex, we find that early in the second trimester, a large number of genes are differentially expressed across distinct cortical areas in all cell types, including radial glia, the neural progenitors of the cortex. However, the abundance of areal transcriptomic signatures increases as radial glia differentiate into intermediate progenitor cells and ultimately give rise to excitatory neurons. Using an automated, multiplexed single-molecule fluorescent in situ hybridization approach, we find that laminar gene-expression patterns are highly dynamic across cortical regions. Together, our data suggest that early cortical areal patterning is defined by strong, mutually exclusive frontal and occipital gene-expression signatures, with resulting gradients giving rise to the specification of areas between these two poles throughout successive developmental timepoints.


Conflict of interest statement

A.R.K. is a co-founder, consultant and director of Neurona Therapeutics. The remaining authors declare no competing interests.

Figures

Fig. 1
Fig. 1. Single-cell analysis of gene-expression signatures across regions of the developing human brain.
a, Left, schematic showing the anatomical brain regions sampled for this study. The timeline below highlights the number of individuals sampled at each gestational week. Right, matrix showing the final count (after quality control) of cells from each individual distributed across regions sampled. b, Single cells from all brain regions sampled are represented in UMAP space. Cells are colour-coded by their region of origin. Insets show the expression profile of canonical genes representative of each identity. c, Top left, distribution of cell types and states in UMAP space. Constellation plot of cells grouped by type or state and brain region highlights the interplay between cell type (node colour) and regional identity (node label). Nodes are scaled proportionally to the number of cells in each group. Edge thickness at each end represents the fraction of cells within a group with neighbours in the opposite group. Node colour corresponds to cell type or state; node label corresponds to the brain region from which cells were sampled. ACx, allocortex; CB, cerebellum; CL, claustrum; GE, ganglionic eminences; HT, hypothalamus; M, motor cortex; MB, midbrain; NCx, neocortex; Par, parietal cortex; PCx, proneocortex; S, somatosensory cortex; Str, striatum; T, temporal lobe; Th, thalamus.
Fig. 2
Fig. 2. Cell types in the developing human neocortex across cortical areas.
a, Single cells from the neocortex represented in UMAP space. Cells in the far left UMAP plot are colour-coded by cell type or state annotation. Feature plots on the right depict the expression pattern of major cell population markers (SOX2, radial glia; EOMES, IPC; MKI67, dividing cells; HOPX, outer radial glia; PDGFRA, OPC/oligodendrocyte; AQP4, astrocytes; BCL11B, deep layer excitatory neurons; SATB2, superficial layer excitatory neurons; NEUROD6, broad excitatory neurons; DLX6-AS1, inhibitory neurons). b, Hierarchical clustering of 138 neocortical clusters on the basis of the Pearson correlations of cluster marker expression profiles across all neocortical stages sampled. Branches are colour-coded by the major cell type assigned to each cluster group. Histograms below show the fraction of cells from each area contributing to a cluster. Bottom bar chart shows the relative number of cells (log2-transformed, range 0 to 20) in each cluster.
Fig. 3
Fig. 3. Cortical area-specific gene signatures.
a, Top, violin plots show the expression of the previously described posterior-high to anterior-low gradient marker gene NR2F1 across all neocortical cells grouped by area. Bottom, dot plot shows the expression of a representative panel of previously reported areally enriched genes across all neocortical cells grouped by area. Expression profiles validate the areal identity of the cortical subdissections used in this study. b, Constellation plots of excitatory lineage grouped by cortical area and annotated by cell subtype highlight cascading differences in areal identity, with similarities between cell types from the same region. Each dot is scaled proportionally to the number of cells represented by that analysis. The thickness of the connecting line on each end represents the fraction of cells within each group with neighbours in connected groups. Dot colour represents cell type and text over the dot marks cortical area. c, Quantification of the constellation plots, with ‘towards area’ in columns and ‘from area’ in rows. The connectivity index from white to red integrates the number of connections between two cell types as well as the average fraction of cells from each cluster contributing to each connection. d, Dot plots quantify a subset of transcription factors enriched in PFC or V1 radial glia (left) and excitatory neurons (right) relative to other cortical areas. Enrichment can occur through an increase in the number of cells expressing a given gene, an increase in the average expression level of expressing cells, or both. Cortical areas: M1, motor; Par, parietal; SS, somatosensory; T, temporal; V1, visual.
Fig. 4
Fig. 4. Spatial RNA analysis identifies distinct spatial patterns of area specific clusters.
a, Automated spatial RNA transcriptomics workflow used to validate the expression patterns of candidate marker genes in situ across four distinct cortical areas. Tissue blocks from 4 cortical areas of a GW20 and a GW16 sample were sectioned (7–10 µm in thickness) onto coverslips and mounted into a fluidic chamber, in which iterative smFISH was performed in batches of 3 genes at a time. RNA molecules were quantified and assigned to individual cells by automated spot detection and nuclei segmentation. b, Representative merged images of smFISH for 31 candidate marker genes in a GW16 (left) and GW20 (right) somatosensory cortex section. Zoomed in images of the ventricular zone (left) and cortical plate (right). White circles indicate segmented nuclei. This analysis was performed once for each of the four regions. Scale bar, 444 μm. c, Top left, nucleus staining outlines tissue architecture, with the ventricular zone at the bottom and the cortical plate at the top. Top right, KDE plots for positive-control genes. CP, cortical plate; IZ, intermediate zone; SP, subplate; SVZ, subventricular zone; VZ, ventricular zone. Scale bar, 444 μm. d, KDE plots for neuronal genes of interest. Genes were chosen as candidate markers for specific neuronal subclusters. Clusters being explored are named below the histogram and the gene marker for the cluster is shown below its name. Stacked histograms show the expected ratio of clusters as a fraction of total composition. Right, KDE plots are quantified as intensity divided by the number of spots to reflect both the intensity of signal and the pervasiveness of the marker to not artificially bias the analysis owing to rare but intense signals. Source data
Extended Data Fig. 1
Extended Data Fig. 1. Single-cell analysis across the whole developing human brain.
a, UMAP plots showing the representation of samples by individual and brain region. There is strong intermixing across individuals, but more segregation by stage. b, On the left, violin plots of known and novel brain region-enriched marker genes. On the right are feature plots of cell type specific transcription factors. c, Histogram depicting the cell type composition as determined by the single-cell analysis for each sampled brain region, showing similar distributions across regions, but with known enrichments for inhibitory interneurons in the ganglionic eminences, and other small enrichments for specific cell types in other regions. d, Hierarchical clustering of 210 neocortex clusters based upon Pearson correlations across cluster markers. Each bar is colored based upon the major cell type assigned to that cluster. Beneath the clusters are histograms showing the fraction of cells from each area contributing to the cluster, and below that is a barchart showing the relative number of cells in each cluster (log2 transformed numbers ranging from 0 to 20). e, Heatmap representing the universe of area-specific genes for each cell type. Gene score, a metric that combines specificity and fold change, is shown from blue to red. Rows are grouped by brain region, and reveal that in many structures, area-specific genes cross cell types.
Extended Data Fig. 2
Extended Data Fig. 2. Single-cell analysis of regional identities across distinct cortical structures.
a, UMAP projection of neocortex, allocortex and proneocortex cells alone, using cell type annotations from the previous analysis. Left UMAP plot shows integration of neocortex and allocortex cells (green and salmon, respectively), but exclusion of proneocortex cells (blue). In the middle UMAP plot, cells are colored by individual. Right UMAP plot shows the distribution and strong segregation by cell type. b, Marker genes (columns) specific to distinct cortical regions by cell type. Rows and columns are hierarchically clustered columns using one minus Pearson correlation for the distance metric. Heatmap reflects strong regional transcriptional identities, even among these 3 cortical structures. Additionally, it highlights expression signatures that cross cell type boundaries. c, Marker genes (columns) specific to distinct cortical regions analyzed in progenitors only. Rows and columns are hierarchically clustered columns using one minus Pearson correlation for the distance metric. d, Marker genes (columns) specific to distinct cortical regions analyzed in excitatory neurons only. Rows and columns are hierarchically clustered columns using one minus Pearson correlation for the distance metric. e, Marker genes (columns) specific to distinct cortical regions analyzed in mature glia only. Rows and columns are hierarchically clustered columns using one minus Pearson correlation for the distance metric.
Extended Data Fig. 3
Extended Data Fig. 3. Single-cell analysis across the developing human neocortex.
a, Matrix showing the distribution of the number of cells across areal dissections for each of the individuals samples. Number of cells is shown in boxes sized proportionally to the number of cells from that individual and region, times 1000. b, UMAP plots showing the representation of samples by age (GW) (left) and brain region (right). There is strong intermixing across individuals, but more segregation by stage. c, Constellation plot shows the relationships between clusters of the excitatory lineage and oligodendrocytes, highlighting the strong relationships between clusters of the same cell type and lineage, but not between those of different groups. Nodes are scaled proportionally to the number of cells in each group. Edge thickness at each end represents the fraction of cells within a group with neighbors in the opposing group. Nodes are colored by cell type/state, and labelled by the brain region from which cells were sampled. d, Constellation plot quantification, with ‘towards cell type’ connectivity as columns and ‘from cell type’ connectivity as rows. The connectivity index integrates the number of connections between two distinct cell types, as well as the average fraction of contributing cells from each cluster. e, Differential expression was performed at the cell type level between radial glia, IPCs, and excitatory neurons. Each set of cell-type-enriched genes was used to create a network and scaled module eigengenes were calculated for each cell type. n = 50,000 cells subsampled from full dataset. Mean with standard deviation error bars are shown. f, Dot plot of area-specific genes as identified in Cadwell, et al 2019 as they are expressed in our dataset. Most genes show expected expression patterns, though some deviate from these expectations, likely because many of these genes have been characterized in the rodent. g, Quantification of the number of differentially expressed areal genes from each cell type, using a union of all genes as calculated across each individual in the dataset. The gene score, an integration of fold change and specificity is quantified in the lower graph, with mean plus standard deviation shown. Neurons vs radial glia p-value = 0.000011; IPC vs radial glia p-value = 0.000435 (one-sided t-test). For both analyses, n= 5446 (radial glia), 2426 (IPCs), 4170 (Neurons). h, Quantification of the number of differentially expressed areal genes from each cell type, using a union of all genes as calculated across each individual in the dataset normalized by the average number of genes expressed within that cell type. i, Sankey plots show the proportion of area-specific gene groups shared between cell types and cortical areas. The number on each block line indicates how many genes are represented by that stream as the stream sizes are not to scale. The “central” area encompasses motor, parietal, and somatosensory areas. j, Venn diagram showing the overlap between the PFC/V1 genes in the Nowakowski, et al 2017 dataset and this study. p-value = 0.00231, Chi-square test. Source data
Extended Data Fig. 4
Extended Data Fig. 4. Constellation plots cell types and developmental stages.
a, Constellation plots of excitatory lineage and oligodendrocyte lineage cell grouped by type and cortical area highlight similarities between groups of frontal and occipital cortical areas. Each dot is scaled proportionally to the number of cells represented by that analysis. The thickness of the connecting line on each end represents the fraction of cells within each group with neighbors in connected groups. Dot color represents cell type while text over the dot marks cortical area. b, Quantification of the constellation plots, with ‘towards area’ in columns and ‘from area’ in rows. The connectivity index from white to red integrates the number of connections between two cell types as well as the average fraction of cells from each cluster contributing to each connection. c, Constellation plots of excitatory lineage grouped by cortical area within early (GW14 – GW17) samples. d, Quantification of the early constellation plots. e, Constellation plots of excitatory lineage grouped by cortical area within mid-stage (GW18 – GW20) samples. f, Quantification of the mid-stage constellation plots. g, Constellation plots of excitatory lineage grouped by cortical area within late-stage (GW18 – GW20) samples. h, Quantification of the late-stage constellation plots.
Extended Data Fig. 5
Extended Data Fig. 5. Trajectories of differentiation and changes in gene signatures.
a, RNA velocity analysis was performed using all necortical cells from the dataset. Stream arrows depict predicted differentiation trajectories. Cells are shown in UMAP space, and are colored by cell type (left panel) and by cortical area (right panel). In the second row, zoomed in streams are shown for individual cortical areas PFC, motor and V1 only colored by cell type. b, Normalized counts for area-specific genes (rows) that were detected by the RNA-velocity algorithm are shown across a random subset of 20,000 cells (columns). Rows and columns were hierarchically clustered using a one minus pearson correlation distance matrix. Cell type and region are shown for each cell (top color bar), and highlight cortical area specific excitatory neuron populations. c, Module eigengenes were calculated for radial glia (left) and IPCs (right) based upon the area specific gene signatures identified in neurons of that area. For both sets of plots, the gene-expression signature of PFC neurons is shown on the left and the V1 signature is shown on the right. Lines indicate the signature strength for progenitors of each region across the timepoints sampled. Early in development, PFC radial glia are defined by a low V1 signature strength, while V1 radial glia are defined by a strong V1 signature and minimal signal for all other areal signatures. IPCs from the PFC and V1 are generally defined by the lack of a strong signature for any of the areas calculated. Range shows 95% confidence interval.
Extended Data Fig. 6
Extended Data Fig. 6. Gene-Expression Dynamics Across Areas and Developmental Stages.
a, Dot plots transcription factors enriched across areas in radial glia (left) and excitatory neurons (right) relative to other cortical areas. Enrichment can occur via an increase in the number of cells expressing a given gene, an increase in the average expression level of expressing cells, or both. b, Sankey plots show the proportion of area-specific excitatory neuron genes shared across developmental stages. The number on each block line indicates how many genes are represented by that stream as the stream sizes are not to scale. The “central” area encompasses motor, parietal, and somatosensory areas. c, Sankey plots show the proportion of area-specific radial glia genes shared across developmental stages. The number on each block line indicates how many genes are represented by that stream as the stream sizes are not to scale.
Extended Data Fig. 7
Extended Data Fig. 7. Signature Correspondence Between Developmental and Adult Samples.
a, Correlations were performed between the neuronal clusters in this dataset and the area specific identities calculated from adult human cortical areas as obtained from the Allen Institute Brain Map dataset. b, Module eigengene calculations of adult areal signatures show minimal to no correspondence to the signatures we identify in this study based upon low module eigengene values. n = 50,000 cells subsampled from full dataset. Mean with standard deviation error bars are shown. c, Module eigengene values of Allen excitatory neurons layer specific signatures in each of the developmental stages within our dataset. n = 50,000 cells subsampled from full dataset. Upper layer signatures emerge at late stages, while a small signal for deep layer identities can be observed at the earliest stages. Mean with standard deviation error bars are shown. Source data
Extended Data Fig. 8
Extended Data Fig. 8. Spatial Expression Patterns of Cell Type and Neuronal Cluster Marker Genes GW20 Part 1.
Kernel density plots of each gene assayed using spatial RNA in situ analysis. Plots are made from all spots, and are shown across all four sampled cortical areas of a GW20 individual. Color is for emphasis of expression, but individual colors have no specific meaning.
Extended Data Fig. 9
Extended Data Fig. 9. Spatial Expression Patterns of Cell Type and Neuronal Cluster Marker Genes GW20 Part 2.
Kernel density plots of each gene assayed using spatial RNA in situ analysis. Plots are made from all spots, and are shown across all four sampled cortical areas of a GW20 individual. Color is for emphasis of expression, but individual colors have no specific meaning.
Extended Data Fig. 10
Extended Data Fig. 10. Laminar and network changes across cortical areas (GW20).
a) We quantified the laminar distributions of each gene in each GW20 sample. The distributions are shown by laminar region, as annotated in Fig. 4, and are represented as fraction of signal for each gene in each bin. b) Using cell identities for individual gene spots, we computed co-expression networks for each sample to visualize changes in the co-expression patterns of the 31 genes analyzed across areas of the cortex. Gene pairs were classified as coexpressed if their Pearson correlation was >=0.05. Networks are shown in a force-directed layout reflective of interaction strength. Only neuronal marker genes are shown, colored as in panel (b).
Extended Data Fig. 11
Extended Data Fig. 11. Spatial analysis of GW16 sample.
a) Top left: Nucleus staining outlines tissue architecture, with the ventricular zone at the bottom and the cortical plate at the top. Top right: KDE plots of positive control genes. SOX2 marks radial glia and the ventricular zone, while SATB2 and BCL11B mark the cortical plate. As previously described, SATB2 and BCL11B are co-expressed in frontal regions, but are mutually exclusive in occipital regions. Scale bar = 444 μm. This analysis was performed once for each of the four regions. b) KDE plots of neuronal genes of interest. Genes were chosen as candidate markers for specific neuronal subclusters. Clusters being explored are named below the histogram each gene marker for this cluster is below its name. Stacked histograms show the expected ratio of clusters as a fraction of total composition. To the far right in each row, the quantification of the KDE plots is shown as intensity divided by the number of spots in order to reflect both the intensity of signal but also the pervasiveness of the marker to not artificially bias the analysis by examples of rare but intense signal. We see strong correspondence between the predicted spatial distribution of clusters and the signal in our spatial RNA analysis.
Extended Data Fig. 12
Extended Data Fig. 12. Spatial Expression Patterns of Cell Type and Neuronal Cluster Marker Genes GW16 Part 1.
Kernel density plots of each gene assayed using spatial RNA in situ analysis. Plots are made from all spots and are shown across all four sampled cortical areas of a GW16 individual. Color is for emphasis of expression, but individual colors have no specific meaning.
Extended Data Fig. 13
Extended Data Fig. 13. Spatial Expression Patterns of Cell Type and Neuronal Cluster Marker Genes GW16 Part 2.
Kernel density plots of each gene assayed using spatial RNA in situ analysis. Plots are made from all spots, and are shown across all four sampled cortical areas of a GW16 individual. Color is for emphasis of expression, but individual colors have no specific meaning.
Extended Data Fig. 14
Extended Data Fig. 14. Laminar and network changes across cortical areas (GW16).
a) We quantified the laminar distributions of each gene in each GW16 sample. The distributions are shown by laminar region, as annotated in Fig. 4, and are represented as fraction of signal for each gene in each bin. b) Using cell identities for individual gene spots, we computed co-expression networks for each sample to visualize changes in the co-expression patterns of the 31 genes analyzed across areas of the cortex. Gene pairs were classified as coexpressed if their Pearson correlation was >=0.05. Networks are shown in a force-directed layout reflective of interaction strength. Only neuronal marker genes are shown, colored as in panel (b).
Extended Data Fig. 15
Extended Data Fig. 15. Summary Schematic of Proposed Model of Arealization.
In this study, we find that in addition to their neuronal progeny, radial glia from distinct cortical areas are already distinct from each other (A). At early second trimester timepoints, the strongest contrast is seen radial glia at the frontal and occipital poles of the neocortex (B). The gene-expression signatures of cells at different cortical areas are highly dynamic across developmental time (C) and across the differentiation axis (RG → IPC → excitatory neuron) (D). As differentiation progresses, these dynamic gene signatures give rise to other major cortical areas, and further refinement occurs, likely as sensory input to the cortex begins to take place.

References

    1. Tasic B, et al. Shared and distinct transcriptomic cell types across neocortical areas. Nature. 2018;563:72–78. doi: 10.1038/s41586-018-0654-5. - DOI - PMC - PubMed
    1. Donahue CJ, Glasser MF, Preuss TM, Rilling JK, Van Essen DC. Quantitative assessment of prefrontal cortex in humans relative to nonhuman primates. Proc. Natl Acad. Sci. USA. 2018;115:E5183–E5192. doi: 10.1073/pnas.1721653115. - DOI - PMC - PubMed
    1. Cadwell CR, Bhaduri A, Mostajo-Radji MA, Keefe MG, Nowakowski TJ. Development and arealization of the cerebral cortex. Neuron. 2019;103:980–1004. doi: 10.1016/j.neuron.2019.07.009. - DOI - PMC - PubMed
    1. Rubenstein JL. Annual research review: development of the cerebral cortex: implications for neurodevelopmental disorders. J. Child Psychol. Psychiatry. 2011;52:339–355. doi: 10.1111/j.1469-7610.2010.02307.x. - DOI - PMC - PubMed
    1. O’Leary DD, Chou SJ, Sahara S. Area patterning of the mammalian cortex. Neuron. 2007;56:252–269. doi: 10.1016/j.neuron.2007.10.010. - DOI - PubMed

Publication types