Comparative Study
. 2021 Oct;598(7879):86-102.
doi: 10.1038/s41586-021-03950-0. Epub 2021 Oct 6.

A multimodal cell census and atlas of the mammalian primary motor cortex

Collaborators
Comparative Study

A multimodal cell census and atlas of the mammalian primary motor cortex

BRAIN Initiative Cell Census Network (BICCN). Nature. 2021 Oct.

Abstract

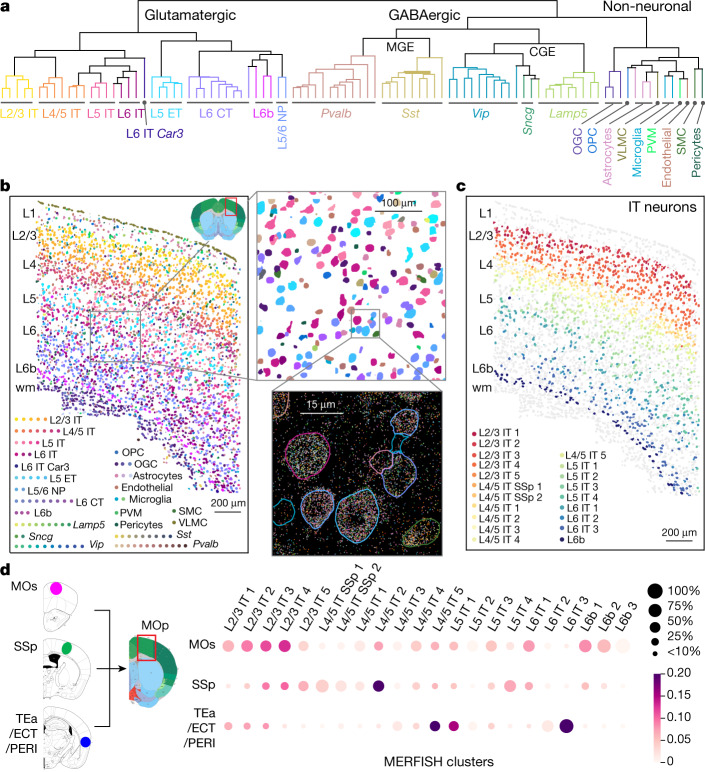
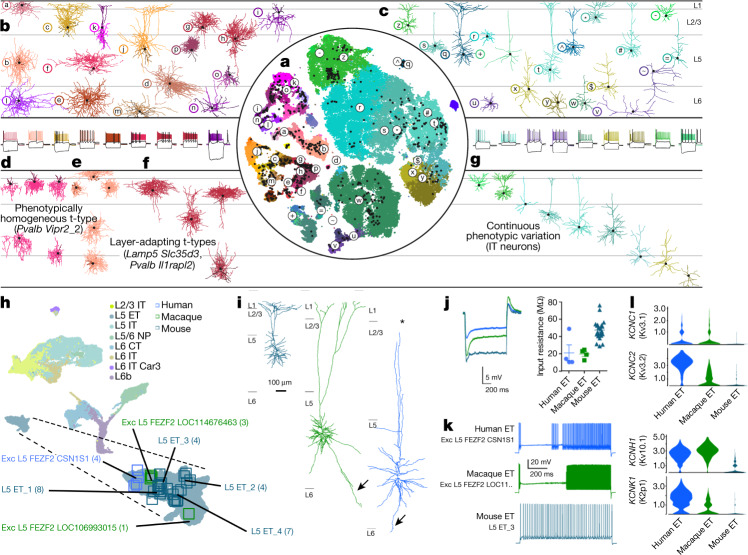
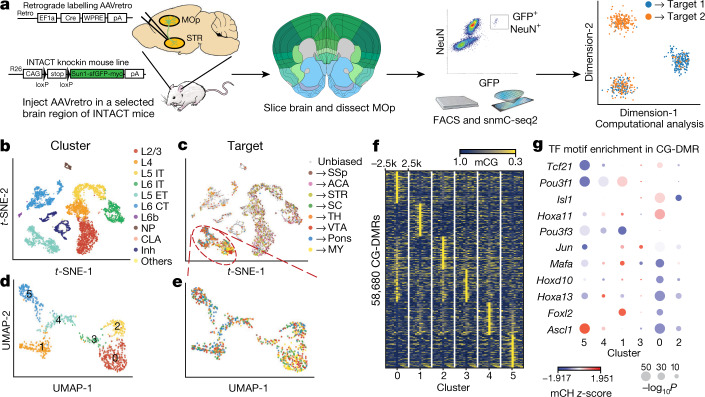
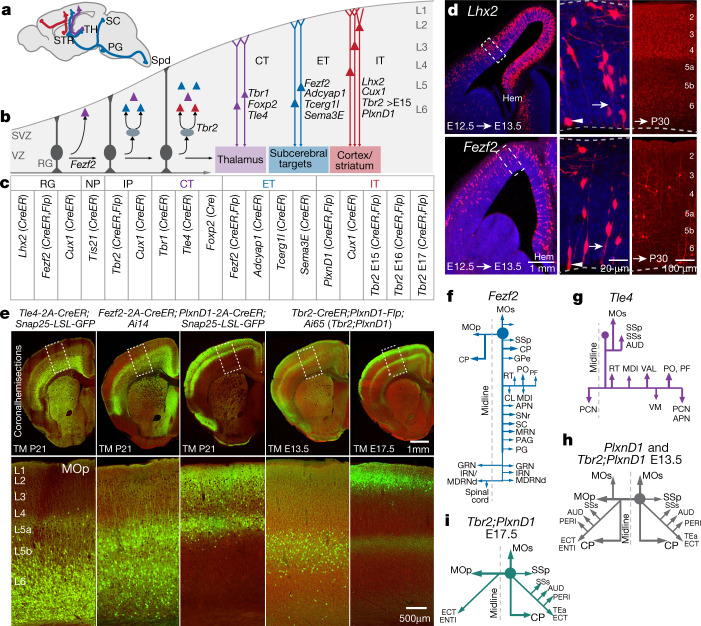
Here we report the generation of a multimodal cell census and atlas of the mammalian primary motor cortex as the initial product of the BRAIN Initiative Cell Census Network (BICCN). This was achieved by coordinated large-scale analyses of single-cell transcriptomes, chromatin accessibility, DNA methylomes, spatially resolved single-cell transcriptomes, morphological and electrophysiological properties and cellular resolution input-output mapping, integrated through cross-modal computational analysis. Our results advance the collective knowledge and understanding of brain cell-type organization1-5. First, our study reveals a unified molecular genetic landscape of cortical cell types that integrates their transcriptome, open chromatin and DNA methylation maps. Second, cross-species analysis achieves a consensus taxonomy of transcriptomic types and their hierarchical organization that is conserved from mouse to marmoset and human. Third, in situ single-cell transcriptomics provides a spatially resolved cell-type atlas of the motor cortex. Fourth, cross-modal analysis provides compelling evidence for the transcriptomic, epigenomic and gene regulatory basis of neuronal phenotypes such as their physiological and anatomical properties, demonstrating the biological validity and genomic underpinning of neuron types. We further present an extensive genetic toolset for targeting glutamatergic neuron types towards linking their molecular and developmental identity to their circuit function. Together, our results establish a unifying and mechanistic framework of neuronal cell-type organization that integrates multi-layered molecular genetic and spatial information with multi-faceted phenotypic properties.


Conflict of interest statement

A. Bandrowski is a cofounder of SciCrunch, a company devoted to improving scientific communication. J.R.E. is a member of Zymo Research SAB. J.A.H., K.E.H., T.N.N. and P.R.N. are currently employed by Cajal Neuroscience. P.V.K. serves on the Scientific Advisory Board of Celsius Therapeutics Inc. M.E.M. is a founder and CSO of SciCrunch Inc., a UCSD tech start up that produces tools in support of reproducibility including RRIDs. A.R. is a founder and equity holder of Celsius Therapeutics, an equity holder in Immunitas Therapeutics and until 31 August 2020 was a member of the scientific advisory board of Syros Pharmaceuticals, Neogene Therapeutics, Asimov and ThermoFisher Scientific. From 1 August 2020, A.R. has been an employee of Genentech. B.R. is a co-founder of Arima Genomics, Inc. and Epigenome Technologies, Inc. K.Z. is a co-founder, equity holder and serves on the Scientific Advisor Board of Singlera Genomics. X. Zhuang is a co-founder and consultant of Vizgen.

Figures

Fig. 1
Fig. 1. MOp consensus cell-type taxonomy.
a, Integrated transcriptomic and epigenomic datasets using SCF show consistent molecular cell-type signatures as revealed by a low-dimensional embedding in mouse MOp. Each UMAP plot represents one dataset. Colours indicate cell subclasses. b, Dendrogram of integrated human (hum), marmoset (mar) and mouse (mou) cell types based on snRNA-seq datasets (10x v3). Branch colour denotes confidence after 10,000 bootstrap iterations. c, Number of within-species clusters included in each cross-species cluster. d, e, For each cross-species cluster, correlations (d) and differentially expressed genes (Wald two-sided test, adjusted P-value < 0.05, fold-change > 4) (e) between pairs of species. Asterisks denote non-neuronal populations that were under-sampled in human. DE, differentially expressed. f, Venn diagrams of shared differentially expressed genes between species for L2/3 IT and L5 ET subclasses. g, Conserved and species-enriched differentially expressed genes for all glutamatergic subclasses shown in an expression heat map. h, Conserved markers of GABAergic neuron types across three species. Data may be viewed at NeMO Analytics. Marmoset silhouette is adapted from www.phylopic.org (public domain). Exc, excitatory; max, maximum; astro, astrocyte; endo, endothelial cell; oligo, oligodencrocyte; OPC, oligodendrocyte progenitor cell; PVM, perivascular macrophage.
Fig. 2
Fig. 2. In situ cell-type identification, spatial mapping and projection mapping of individual cells in MOp by MERFISH.
a, Dendrogram showing the hierarchical relationship among the subclasses and clusters in the mouse MOp identified by MERFISH, coloured by the subclass each cluster belongs to. b, Left, spatial map of cell clusters identified in a coronal slice (bregma ~+0.9), with cells coloured by their cluster identity as shown in the colour index. Top right, zoomed-in map of the boxed region of the left panel. Bottom right, spatial localization of individual RNA molecules in the boxed region of the top right panel, coloured by their gene identity. The segmented cell boundaries are coloured according to the cell clusters they belong to. c, IT neurons in the same coronal slice as shown in b. The IT neurons are coloured by their cluster identity, as shown in the colour index, together with L6b cells in dark blue to mark the bottom border of the cortex. All other cells are shown in grey. d, Projection patterns of the MOp neurons into three other regions of the brain, MOs, SSp and TEa–ECT–PERI. Left, CTb was used as retrograde tracer and injected into these three regions. The CTb signals and the MERFISH gene panel were imaged in MOp to determine both the cluster identities and projection targets of individual cells. Projection of MOp neurons to the target regions are displayed as a dot plot, where the size of the dot represents the fraction of cells projecting to each indicated target among all CTb-positive, single-projecting cells in a cluster, and the colour represents the fraction of cells a target received from each indicated cluster. Data may be viewed at NeMO Analytics. OGC, oligodendrocyte; SMC, smooth muscle cell.
Fig. 3
Fig. 3. Correspondence between transcriptomic and morpho-electrical properties of mouse MOp neurons by Patch-seq, and cross-species comparison of L5 ET neurons.
a, t-Distributed stochastic neighbor embedding (t-SNE) of the scRNA-seq 10x v2 dataset with the superimposed Patch-seq neurons (black dots). b, c, Examples of GABAergic interneuron (b) and glutamatergic excitatory neuron (c) morphologies and electrophysiological recordings. Letters and symbols refer to cells marked in a. Three voltage traces are shown in each cell: the hyperpolarization trace obtained with the smallest current stimulation, the first depolarization trace that elicited at least one action potential, and the depolarization trace showing maximal firing rate. Stimulation length, 600 ms. d, Example of a phenotypically homogeneous t-type (Pvalb Vipr2_2, chandelier neurons). e, f, Two examples of t-types showing layer-adapting morphologies: Lamp5 Slc35d3, neurogliaform cells (e) and Pvalb Il1rapl2, fast-spiking basket cells (f). g, Example of a transcriptomic subclass (excitatory IT neurons) that shows continuous within-subclass co-variation between distances in transcriptomic space and morphological space, as seen in similar colour ordering in a (right) and gh, UMAP visualization of cross-species integration of snRNA-seq data for glutamatergic neurons isolated from mouse, macaque and human, with colours corresponding to cell subclass. Patch-seq samples mapping to various ET neuron types are denoted by squares, colour-coded by species. i, Dendritic reconstructions of L5 ET neurons. The human and macaque neurons display classical Betz cell features including taproot dendrites (arrows). Note that the human neuron is truncated (asterisk) before reaching the pial surface. j, Voltage response of mouse, macaque and human ET neurons to a 1 s, −300 pA current injection (left) and input resistance (mean ± s.e.m.; macaque n = 4, human n = 4, mouse n = 22) (right). False-discovery rate (FDR)-corrected two-sided Wilcoxon ranked-sum test (human versus mouse W = 12, P = 0.31, d = 2.09; human versus macaque W = 5, P = 0.49, d = 0.08; macaque versus mouse W = 0, P = 0.0004, D = 2.5). k, Example spike trains in response to a 10-s suprathreshold current injection. l, Violin plots of enriched potassium channel gene expression in human, macaque and mouse L5 ET neurons. Data may be viewed at NeMO Analytics.
Fig. 4
Fig. 4. Epi-retro-seq links molecular cell types with distal projection targets.
a, Workflow of Epi-retro-seq. Mouse brain sagittal panel is adapted from https://commons.wikimedia.org/wiki/File:Mouse_brain_sagittal.svg (public domain). Coronal reference plane is adapted from Allen Reference Atlas with permission. FACS, fluorescence activated cell sorting. b, c, t-SNE of MOp cells profiled by Epi-retro-seq (n = 2,115) and unbiased snmC-seq2 (n = 4,871) computed with 100-kb-bin-level mCH, coloured by subclasses (b) or projection targets (c). d, e, UMAP embedding of L5 ET cells in MOp profiled by Epi-retro-seq (n = 848) computed with 100-kb-bin-level mCH, coloured by clusters (d) or projection targets (e). f, mCG levels at CG-DMRs identified between the six clusters and their flanking 2.5-kb regions. Top 100 CG-DMRs in each cluster are shown. g, Transcription factor motif enrichment in CG-DMRs in each cluster. Colour represents z-scored gene-body mCH level of the transcription factors, and size represents −log10 P value (computed with Homer, using one-sided binomial tests) of motif enrichment in the CG-DMRs. CLA, claustrum; inh, inhibitory.
Fig. 5
Fig. 5. Genetic tools for targeting cortical glutamatergic projection neuron types.
a, Major PyN projection classes mediating IT (red) and cortical output channels (ET, blue; CT, purple). PG, pontine grey; Spd, spinal cord. b, Developmental trajectory from progenitors to mature PyNs. Genes specify lineage and projection types. VZ, ventricular zone; SVZ, subventricular zone. c, New gene knockin driver mouse lines targeting RG, neurogenic precursor (NP), IP and broad projection types. d, Pulse-chase of E12.5 Lhx2-2A-CreER;Ai14 (Lhx2) (top row) and Fezf2-2A-CreER;Ai14 (Fezf2) (bottom row) embryos for 24 hours densely labelled RGs throughout dorsal neuroepithelium (left). Middle, boxed areas shown left, magnified, showing RGLhx2+ and RGFezf2+. Long pulse-chase (right) of E12.5 RGs generates PyNs across layers at postnatal day (P)30. Arrows show endfeet and arrowheads show dividing soma. Hem, cortical hemisphere. e, Driver–reporter recombination patterns (reporter, pseudo-coloured green; background, red) from five PyN subpopulations defined by Tle4, Fezf2, PlxnD1 and Tbr2;PlxnD1 with tamoxifen (TM) induction times. Combinatorial definition of PyNPlxnD1 subtypes by lineage, birth time and anatomical location achieved by Tbr2;PlxnD1 intersection: tamoxifen at E13.5 and at E17.5 labelled different Tbr2-expressing IP-derived PyNPlxnD1 cohorts. Boxed areas in MOp (top row) are shown in the bottom row. fi, Main PyN subpopulation projection targets from MOp. Drivers were crossed with mouse reporter lines, Rosa26-CAG-LSL-Flp (Cre-dependent) or Rosa26-CAG-dual-(LSL-FSF)-tTA (Cre-AND-Flp-dependent), and tamoxifen induction was performed to convert transient CreER to constitutive reporter expression for anterograde tracing with Flp- or tTA-dependent AAV vector (AAV8-CAG-fDIO-TVA-EGFP or AAV-TRE-3g-TVA-EGFP). Filled circle shows MOp injection site. For full names of projection target acronyms, see refs. ,. APN, anterior pretectal nucleus; AUD, auditory cortex; CL, central lateral nucleus; ENTI, entorhinal area, lateral part; GPe, globus pallidus, external segment; GRN, gigantocellular reticular nucleus; IRN, intermediate reticular nucleus; MDl, mediodorsal nucleus, lateral part; MDRNd, medullary reticular nucleus, dorsal part; MRN, midbrain reticular nucleus; PAG, periaqueductal grey; PCN, paracentral nucleus; PF, parafascicular nucleus; RT, reticular nucleus; SNr, substantia nigra, reticular part; SSs, supplemental somatosensory cortex.
Fig. 6
Fig. 6. Global wiring diagram and anatomical characterization of MOp-ul neuron types.
a, Flat map representation of the MOp-ul input–output wiring diagram. Black lines and red dots indicate axonal projections (outputs) and retrograde labelling sources (inputs), respectively, with line thickness and dot sizes representing relative connection strengths. Most MOp-ul projection targets in the cortex and TH also contain input sources, suggesting bi-directional connections. Numbers in parentheses indicate numbers of cervical or thoracic segments in spinal cord. b, Projection patterns arising from excitatory cell subclasses, IT, ET and CT, with corresponding Cre line assignment and somatic laminar location, compared with the overall projection pattern from the MOp-ul region (left, black). Along each vertical output pathway, horizontal bars on the right and left sides represent ipsilateral and contralateral collaterals, respectively, with dot sizes indicating the strength of axonal termination in different targets. For full names of projection target acronyms, see refs. ,. ac, anterior commissure; ACB, nucleus accumbens; AId, v, p, agranular insular cortex, dorsal, ventral, posterior part; AUDv, ventral auditory cortex; BAC, bed nucleus of the anterior commissure; CBN, cerebellar nuclei; CBX, cerebellar cortex; CEAc, central amygdalar nucleus, capsular part; CM, central medial nucleus; CN, cerebral nuclei; CTX, cerebral cortex; DN, dentate nucleus; FN, fastigial nucleus; GPi, globus pallidus, internal segment; GU, gustatory cortex; HY, hypothalamus; IO, inferior olivary complex; IP, interposed nucleus; LHA, lateral hypothalamic area; MARN, magnocellular reticular nucleus; MB, midbrain; MDc, mediodorsal nucleus, central part; MDRN, medullary reticular nucleus; NPC, nucleus of the posterior commissure; ORBvl, l, orbital cortex, ventrolateral, lateral part; P, pons; PAL, pallidum; PARN, parvicellular reticular nucleus; PPN, pedunculopontine nucleus; PRNr, pontine reticular nucleus; PRNc, pontine reticular nucleus, caudal part; RM, nucleus raphe magnus; RN, red nucleus; RSPd, retrosplenial cortex, dorsal part; SMT, submedial nucleus; SPFp, subparafascicular nucleus, parvicellular part; SPVI, spinal nucleus of the trigeminal, interpolar part; SPVO, spinal nucleus of the trigeminal, oral part; SSp-ul, -ll, -tr, -bfd, -m, -n, -un, primary somatosensory cortex upper limb, lower limb, trunk, barrel field, mouth, nose, unassigned; STN, subthalamic nucleus; TRN, tegmental reticular nucleus; VISC, visceral cortex; VPL, ventral posterolateral nucleus; VPM, ventral posteromedial nucleus; ZI, zona incerta.
Fig. 7
Fig. 7. Existence of L4 excitatory neurons in MOp.
a, UMAP embedding of IT cells from 11 datasets. Cells are coloured by modalities, by cluster identities from the 11-dataset joint clustering, and by cluster identities generated from other consensus clustering. b, Genome browser view of layer-specific gene markers—from L2/3 to L5—across IT cell types (SCF L1). Arrows indicate cell types with correlated transcription and epigenomic signatures of the specific marker gene. c, MERFISH IT clusters correspond well with the joint clusters from a (confusion matrices, left), and reveal a group of L4 specific clusters (L45_IT) between L2/3 and L5 and marked by genes Rspo1 and Rorb (right). d, Correspondence between mouse and human or marmoset transcriptomic IT types. e, UMAP embedding of excitatory cells from MOp and VISp. Gene expression levels are log10(transcripts per million + 1). f, Dendritic morphologies and spiking patterns of mouse Patch-seq cells from L2/3-6 IT types. Arrowheads in a, c, d, f indicate the L4/5 IT_1 type. g, Left, local dendritic and axonal morphologies of fully reconstructed IT neurons with somas located in L2, L3 and L4. Black, apical dendrites. Blue, basal dendrites. Red, axons. Right, quantitative vertical profiles showing average distribution of local axons along cortical depth for L2/3 or L4 neurons. Dots indicate soma locations and the open arrowhead points to L2/3 neuron axon projections down to L5. Layer marking is approximate owing to the variable thickness of layers in different parts of MOp.
Fig. 8
Fig. 8. Two distinct L5 ET projection neuron types in MOp.
a, Confusion matrices between mouse L5 ET RNA-seq clusters and SCF, MERFISH, human or marmoset clusters, with the fraction of cells in each of the other datasets mapped to mouse transcriptomic clusters. b, Distribution of MERFISH L5 ET cells in upper or lower L5. L5_ET_4 cells are not found in this section. c, Genome browser view of gene markers for the MY-projecting (Slco2a1) and non-MY-projecting (Npnt) L5 ET neurons. d, Left, integration UMAP panels between L5 ET Epi-retro-seq clusters and consensus transcriptomic clusters using the snRNA 10x v3 B dataset with the largest number of L5 ET cells (more than 4,000). Right, confusion matrices (normalized by columns). e, Local dendritic and axonal morphologies (left) and brain-wide axon projections (right) of fully reconstructed MY-projecting and non-MY-projecting L5 ET neurons. Black, apical dendrites; blue, basal dendrites; red, axons. Numbers are cell IDs. f, Characterization of two L5 ET driver lines. For each line, the first panel shows tdTomato reporter expression from a Slco2a1-P2A-Cre;Ai14 or Npnt-P2A-FlpO;Ai65F mouse. The second panel shows a whole-brain view of the projection pattern from a Slco2a1-P2A-Cre mouse injected with AAV-pCAG-FLEX-EGFP-WPRE or a Npnt-P2A-FlpO mouse injected with AAV-pCAG-fDIO-mNeonGreen-WPRE (MOp (purple), TH (blue) and MY (yellow); injection sites indicated by the dashed circles). Last two panels show GFP- or mNeonGreen-labelled neurons at the injection site (MOp) and axon fibres in contralateral MY (seen only in Slco2a1 but not Npnt).
Fig. 9
Fig. 9. An integrated multimodal census and atlas of MOp cell types.
a, Mouse MOp consensus transcriptomic taxonomy at the top is used to anchor cell-type features in all the other modalities. Major cellular divisions, class and subclass labels are shown above major branches and cluster labels are shown below each leaf node. Using Patch-seq and connectivity studies, many transcriptomic neuron types or subclasses are annotated and correlated with known cortical neuron types. No Patch-seq data were collected for the ‘uncharacterized’ Vip types. Relative proportions of all cell types are calculated from the snRNA-seq 10x v3 B data (bar graph). b, Representative local dendritic and axonal morphologies of GABAergic and glutamatergic neuron types from Patch-seq data. c, UMAP representation of the mouse transcriptomic–epigenomic integrated molecular taxonomy (SCF version). d, Gradual transition of MERFISH IT clusters across cortical layers and depth. e, Percentage of LIGER, MERFISH and human cells assigned to mouse consensus transcriptomic cell types (Methods). Darker subclass colours indicate an exact match to the cluster/type, while lighter-coloured stacked bars indicate a match to taxonomic neighbours within the same subclass or, occasionally, a neighbouring subclass. Grey line, mean exact type match over neuronal types; black line, mean subclass match. f, Single-neuron full morphology reconstructions show distinct long-range axon projection patterns between glutamatergic subclasses and cell-to-cell variations within each subclass: L2/3 IT (17 cells), L4 IT (3 cells), L5 IT (5 cells), L5 ET MY-projecting (6 cells) and L5 ET non-MY-projecting (6 cells). Left, Allen mouse brain CCFv3 as an anatomical reference. CCK, cholecystokinin; FS, fast spiking; NGC, neurogliaform cell; PV, parvalbumin; SST, somatostatin; VIP, vasoactive intestinal peptide.
Extended Data Fig. 1
Extended Data Fig. 1. Summary of experimental and computational approaches taken and community resources generated by BICCN.
a, Comprehensive characterization of cell types in the primary motor cortex (MOp or M1) of three mammalian species using multiple approaches spanning molecular, genetic, physiological and anatomical domains. Integration of these datasets leads to a cohesive multimodal description of cell types in the mouse MOp and a cross-species molecular taxonomy of MOp cell types. b, The multimodal datasets are organized by the Brain Cell Data Center (BCDC), archived in the Neuroscience Multi-omic (NeMO) Archive (for molecular datasets), Brain Image Library (BIL, for imaging datasets) and Distributed Archive for Neurophysiology Data Integration (DANDI, for electrophysiology data), and made publicly available through the BICCN web portal www.biccn.org and resource page DOI: 10.5281/zenodo.4726182. Human and mouse icons and brains are credited to Anna Hupalowska at Broad Institute. Marmoset icon and brain are modified from unrestricted use purchase from Shutterstock. Allen mouse CCF, BCDC and transcriptomics browser images are reproduced with permission from Allen Institute. Mouse brain panel in Epi-retro-seq is adapted from https://commons.wikimedia.org/wiki/File:Mouse_brain_sagittal.svg (public domain). DANDI artwork is licensed under CC-BY-3.0 from https://github.com/dandi/artwork.
Extended Data Fig. 2
Extended Data Fig. 2. MOp consensus cell type taxonomy.
a, Cluster overlap heatmap showing the proportion of nuclei in each pair of species clusters that are mixed in the cross-species integrated space. Cross-species consensus clusters are indicated by labeled blue boxes. Mouse clusters (rows) are ordered by the mouse MOp transcriptomic taxonomy dendrogram. Marmoset (left columns) and human (right columns) transcriptomic clusters are ordered to align with mouse clusters. Color bars at top and left indicate subclasses of within-species clusters. b-c, Genome browser view showing transcriptomic and epigenetic signatures for gene markers of Lamp5_2 (NFIX) and Pvalb_1 (TMEM132C) GABAergic neurons in human (b) and mouse (c). Yellow bars highlight sites of open chromatin and DNA hypomethylation in the cell type with corresponding marker expression.
Extended Data Fig. 3
Extended Data Fig. 3. Epi-retro-seq links molecular cell types with distal projection targets.
a, Distribution across subclasses of neurons from unbiased snmC-seq2 and neurons projecting to each target. b, Enrichment of L5 ET neurons projecting to each target in each cluster. * represents FDR < 0.05, Wald test, Benjamini-Hochberg Procedure. c, Boxplots of normalized mCH levels at gene bodies of example CH-DMGs in the six clusters. Numbers of cells represented by the boxes are 242, 165, 118, 42, 119, and 162 for the six clusters. The elements of boxplots are defined as: center line, median; box limits, first and third quartiles; whiskers, 1.5× interquartile range.
Extended Data Fig. 4
Extended Data Fig. 4. Anatomical characterization of MOp-ul neuron types.
a, MOp-ul neurons classified by projection targets or transgenic Cre expression. Top, retrograde tracing using CTb revealed layer-specific distributions of MOp-ul neurons with respect to their major projection targets. Representative images (left) show neurons labeled by CTb injections into cortical areas (TEa, contralateral MOp), SC in the midbrain, and PO of the thalamus. Detected cells were pseudo-colored and overlaid onto a schematic coronal section near the center of MOp-ul (right). MOp neurons that project to TEa are distributed in L2 and L5 (yellow), to the contralateral MOp in L2-L6b (purple), to targets in the pons and medulla in L5b (blue), and to thalamus in L6a (red). Bottom, distribution of neurons labeled in transgenic Cre lines was mapped in MOp and across the whole cortex. Images (left) show laminar patterns of Cre+ nuclei in MOp-ul from four driver lines (Cux2, Tlx3, Rbp4, and Ntsr1). Detected nuclei from these lines, plus the Ctgf-Cre line, were pseudo-colored and overlaid onto a schematic coronal section near the center of MOp-ul (right). Cre+ nuclei are found in L2-4 in Cux2; L5a and superficial L5b in Tlx3; L5a and L5b in Rbp4; L6a in Ntsr1, and L6b in Ctgf. b, 3D views show brain-wide MOp input–output patterns at the population and single cell resolution. Top left, regional MOp inputs and outputs were mapped using retrograde (in red, example showing rabies tracing from the Tlx3-Cre line) and anterograde (in black, example showing AAV-EGFP) tracing methods. Top right, whole-brain axonal trajectories from 6 Cre line-defined subpopulations labeled with Cre-dependent AAV tracer injections at the same MOp-ul location. Bottom, individual projection neurons were fully reconstructed following high-resolution whole-brain imaging of sparsely labeled cells. Representative examples of IT, ET, and CT neurons are shown in each panel. The two ET examples represent distinct projection types; medulla (dark blue)- and non-medulla-projecting (light blue). 3D renderings were generated following registration of projection and reconstruction data into CCFv3 using BrainRender.
Extended Data Fig. 5
Extended Data Fig. 5. An integrated multimodal census and atlas of cell types in the primary motor cortex of mouse, marmoset and human.
The mouse MOp consensus transcriptomic taxonomy at the top is used to anchor cell type features in all the other modalities. Subclass labels are shown above major branches and cluster labels are shown below each leaf node. Confusion matrices show correspondence between the mouse MOp transcriptomic taxonomy (116 clusters) with those derived from other molecular datasets, including mouse MERFISH (95 clusters), the integrated mouse molecular taxonomies by SingleCellFusion (SCF) (56 neuronal clusters) or LIGER (71 clusters), and the human and marmoset transcriptomic taxonomies (127 and 94 clusters, respectively). Cells within each taxonomy were either mapped to the reference (MERFISH, SCF, LIGER) or shared common cells via integration (Human, Marmoset). Color code corresponds to the fraction of cells in each column mapped to or shared with each reference cluster, and each column summed up to 1. These mapping relationships between the mouse consensus transcriptomic taxonomy and other taxonomies are summarized in an overview panel in Figure 9e. Using Patch-seq and connectivity studies, many transcriptomic neuronal types or subclasses are annotated and correlated with known cortical neuron types traditionally defined by electrophysiological, morphological and connectional properties. Relative proportions of all cell types within the mouse MOp are calculated from either the snRNA-seq 10x v3 B dataset (horizontal bar graph) or the MERFISH dataset (vertical bar graph to the right of the MERFISH matrix). The numbers of cCRE-gene pairs in modules corresponding to neuronal subclasses identified by Cicero from the scRNA-seq and snATAC-seq datasets are shown at the bottom of the SCF matrix.
Extended Data Fig. 6
Extended Data Fig. 6. Identification of putative enhancer-gene pairs.
a, Detection of putative enhancer-gene pairs. 7,245 pairs of positively correlated cCRE and genes (highlighted in red) were identified using an empirically defined significance threshold of FDR < 0.01. Grey filled curve shows the distribution of PCC for randomly shuffled cCRE-gene pairs. b, Heatmap of chromatin accessibility of 6,280 putative enhancers, grouped by distinct enhancer-gene modules, across joint cell clusters (left) and expression of 2,490 target genes (right). Note genes are displayed for each putative enhancer separately. CPM: counts per million, TPM: transcripts per million. About 76% of putative enhancers showed cluster-specific chromatin accessibility and were enriched for lineage-specific TFs, while 24% were widely accessible and linked to genes expressed across neuronal clusters with the highest expression in glutamatergic neurons (module M1). Other modules (M2 to M14) of enhancer-gene pairs were active in a subclass-specific manner. c, Enrichment of known TF motifs in distinct enhancer-gene modules. Displayed are known motifs from HOMER with enrichment -log p-value > 10. In module M1, de novo motif analysis of putative enhancers showed enrichment of sequence motifs recognized by TFs CTCF and MEF2. CTCF is a widely expressed DNA binding protein with a well-established role in transcriptional insulation and chromatin organization, but recently it was also reported that CTCF can promote neurogenesis by binding to promoters and enhancers of related genes. In the L2/3 IT selective module M2, putative enhancers were enriched for the binding motif for Zinc-finger transcription factor EGR, a known master transcriptional regulator of excitatory neurons. In the Pvalb selective module M8, putative enhancers were enriched for sequence motifs recognized by the MADS factor MEF2, which is associated with regulating cortical inhibitory and excitatory synapses and behaviours relevant to neurodevelopmental disorders. d, Heatmap showing the weight of each joint cell cluster in each module, derived from the coefficient matrix. The values of each column are scaled (0–1).
Extended Data Fig. 7
Extended Data Fig. 7. Dot plot illustrating RNA expression levels (red) and hypo-CG-DMR motif enrichments (blue) of transcription factors (TFs) in mouse MOp subclasses.
The size and color of red dots indicate the proportion of expressing cells and the average expression level in each subclass, respectively. The size and color of blue dots indicate adjusted P-value (Fisher’s exact test, Benjamini-Hochberg Procedure) and log2(Odds Ratio) of motif enrichment analysis, respectively. Combining these two orthologous pieces of evidence identified many well-studied TFs in embryonic precursors, such as the Dlx family members for pan-inhibitory neurons, and Lhx6 and Mafb for MGE derived inhibitory neurons. We further identified many additional TFs with more restricted patterns in specific subclasses, such as Rfx3 and Rreb1 (in L2/3 IT), Atoh7 and Rorb (in L4/5 IT), Pou3 family members (in L5 ET), Etv1 (in L5/6 NP), Esrr family members (in Pvalb), and Arid5a (in Lamp5).

Comment in

References

    1. Somogyi, P. & Klausberger, T. Defined types of cortical interneurone structure space and spike timing in the hippocampus. J. Physiol.562, 9–26 (2005). - PMC - PubMed
    1. Sanes, J. R. & Masland, R. H. The types of retinal ganglion cells: current status and implications for neuronal classification. Annu. Rev. Neurosci.38, 221–246 (2015). - PubMed
    1. Zeng, H. & Sanes, J. R. Neuronal cell-type classification: challenges, opportunities and the path forward. Nat. Rev. Neurosci.18, 530–546 (2017). - PubMed
    1. Huang, Z. J. & Paul, A. The diversity of GABAergic neurons and neural communication elements. Nat. Rev. Neurosci.20, 563–572 (2019). - PMC - PubMed
    1. Mukamel, E. A. & Ngai, J. Perspectives on defining cell types in the brain. Curr. Opin. Neurobiol.56, 61–68 (2019). - PMC - PubMed

Publication types

MeSH terms

Grants and funding