Review
. 2022 Jan;18(1):38-55.
doi: 10.1038/s41581-021-00488-2. Epub 2021 Oct 6.

Lipidomic approaches to dissect dysregulated lipid metabolism in kidney disease

Affiliations
Review

Lipidomic approaches to dissect dysregulated lipid metabolism in kidney disease

Judy Baek et al. Nat Rev Nephrol. 2022 Jan.

Abstract

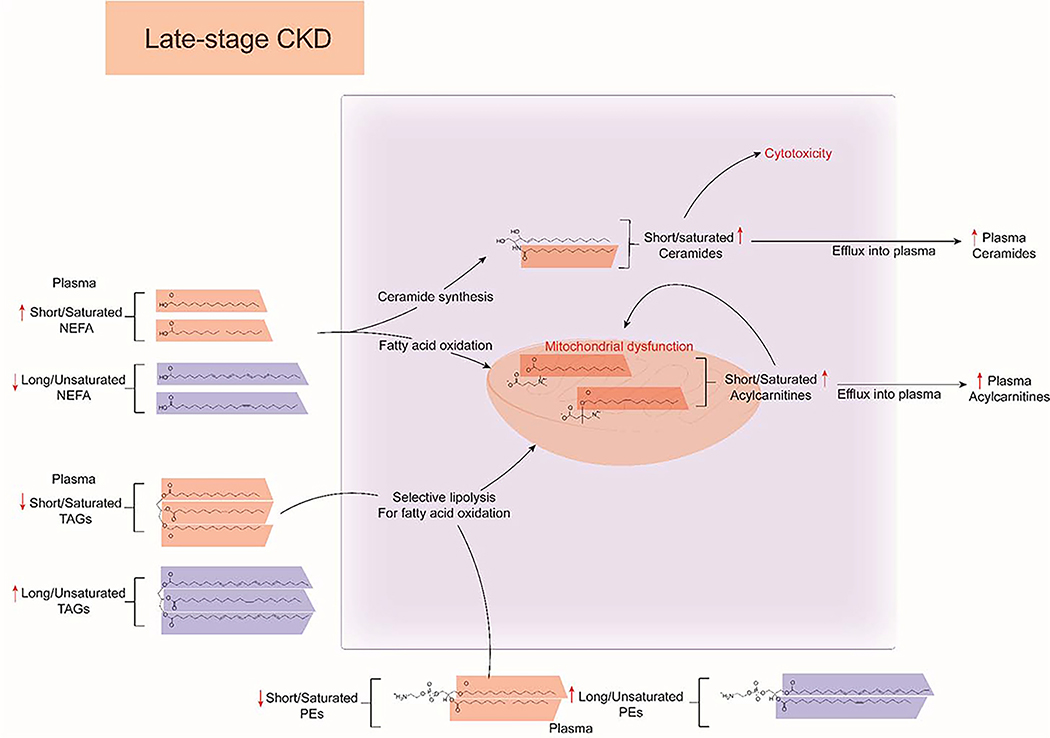
Dyslipidaemia is a hallmark of chronic kidney disease (CKD). The severity of dyslipidaemia not only correlates with CKD stage but is also associated with CKD-associated cardiovascular disease and mortality. Understanding how lipids are dysregulated in CKD is, however, challenging owing to the incredible diversity of lipid structures. CKD-associated dyslipidaemia occurs as a consequence of complex interactions between genetic, environmental and kidney-specific factors, which to understand, requires an appreciation of perturbations in the underlying network of genes, proteins and lipids. Modern lipidomic technologies attempt to systematically identify and quantify lipid species from biological systems. The rapid development of a variety of analytical platforms based on mass spectrometry has enabled the identification of complex lipids at great precision and depth. Insights from lipidomics studies to date suggest that the overall architecture of free fatty acid partitioning between fatty acid oxidation and complex lipid fatty acid composition is an important driver of CKD progression. Available evidence suggests that CKD progression is associated with metabolic inflexibility, reflecting a diminished capacity to utilize free fatty acids through β-oxidation, and resulting in the diversion of accumulating fatty acids to complex lipids such as triglycerides. This effect is reversed with interventions that improve kidney health, suggesting that targeting of lipid abnormalities could be beneficial in preventing CKD progression.


Figures

Figure 1:
Figure 1:
Diagram of the MS and MS/MS spectra acquired from a triple-TOF for phosphatidylethanolamine (PE) 36:1 with theoretical m/z 744.5543 for its [M-H] precursor ion. A) Chemical structure of PE 36:1. Fragments identified in the following spectra are highlighted. B) MS spectra identifying the [M-H] precursor ion with its m/z highlighted. C) MS/MS spectra identifying fragments of PE 36:1. Each m/z is highlighted with colors that correspond to its fragments highlighted in A). Diagnostic ions for the PE class are labeled.
Figure 2:
Figure 2:
Schematic demonstrating the structural diversity of triglyceride 44:2: which has a precursor ion m/z of 764.7 and product ion of 493.4 and mass loss of 253.2 that corresponds to fatty acid (FA) 16:1. Four isomers of the original structure (FA 16:1, FA 14:0, FA14:1) are proposed (A-D). FA 16:1 is highlighted in every structure. A) TAG 44:2 with 16:1 and sn-2 and sn-3 acyl-chain carbon isomers. B) TAG 44:2 with FA 16:1 double-bond position isomer. C) TAG 44:2 with FA 16:1 trans double-bond isomer. D). TAG 44:2 with16:1 sn-2 positional isomer.
Figure 3:
Figure 3:
Analysis of lipid classes by their secondary characteristics in the CPROBE cohort. Lipid species for specific class are plotted by their carbon number (x-axis) and double-bond number (y-axis), and color coded (blue – low, red – high) to represent standardized measured abundance for CKD stages 2 through 5. A) Example of secondary characteristic plot for free-fatty acids (FFA) in CPROBE CKD stage 2 patients. Each box represents mean standardized abundance for FFA species with the denoted carbon and double-bond number; structures for saturated 16-carbon fatty acid and 24-carbon fatty acid with four double bonds are drawn as representatives of their respective boxes. The interaction term between carbon and double bond number are noted with its p-value and the red arrow denotes the directionality of lipid accumulation with regards to carbon and double bond number. B) CPROBE FFA and triacylglycerol (TAG) secondary characteristic plots demonstrate significant interaction terms for CKD stage 2 and 5 with opposite directionality of lipid accumulation with regards to carbon and double bond number for each stage: at stage 2, FFA demonstrate increased levels of high carbon number and double bond number, whereas tags demonstrate increased level of low carbon number and double bond number; this directionality is reversed for stage 5. Figure adapted with permission from Journal of American Society of Nephrology.
Figure 4:
Figure 4:
Differential network enrichment analysis (DNEA) for lipidomics data between CKD groups. A) DNEA is equipped to differentiate networks that are differentiated by differences in lipid abundance (Group 2 vs Group 1 in Case 1) or altered correlations or edges (Group 2 vs Group 1 in Case 2) or both. B) DNEA for non-progressors and progressors for CRIC patients for triacylglycerols (TAGs) and diacylglycerols (DAGs) in CPROBE. Nodes represent specific lipid species. Black edges represent correlations present in both progressors and non-progressors, blue edges represent correlations more likely to be present in non-progressors and early-stage CKD, and pink edges represent correlations more likely to be present in progressors and late-stage CKD. Higher abundance of longer polyunsaturated TAGs in CKD stages 4 and 5 with new edges in neighboring lipids specific to progressors aligns with upregulation of elongation and desaturation of longer chain fatty acids and their incorporation in synthesis of longer chain polyunsaturated TAGs in advanced CKD. Figure adapted with permission from Bioinformatics.
Figure 5:
Figure 5:
Overview of dyslipidemia in late-stage CKD. Short/saturated non-esterified fatty acids (NEFAs) are highlighted in orange and and long/unsaturated NEFAs are highlighted in blue. Increased levels of circulating short/saturated NEFA in CKD serve as substrates for fatty-acid oxidation and ceramide synthesis. Increase in short/saturated acylcarnitines contribute to mitochondrial overload and dysfunction, while increased production of short/saturated ceramides contribute to cellular cytotoxicity. Acylcarnitine and ceramides are transported outside the cell and their levels and profiles reflected in the plasma. In turn, mitochondrial overload leads to selective lipolysis of complex lipids such as triacylglycerols (TAGs) and phosphatidylethanolamines (PEs) with short/saturated fatty acid side-chains as they can bypass the carnitine shuttle. This leads to consumption of plasma level short/saturated complex lipids and relative increase in long/unsaturated TAGs

References

    1. Centers for Disease Control and Prevention. Chronic Kidney Disease in the United States, 2019. Atlanta, GA: US Department of Health and Human Services, Centers for Disease Control and Prevention; 2019.
    1. United States Renal Data System. 2019 Annual Data Report. Bethesda, Maryland, USA: NIH and National Institute of Diabetes and Digestive and Kidney Diseases; 2018.
    1. Sarnak Mark J et al. Kidney Disease as a Risk Factor for Development of Cardiovascular Disease. Circulation 108, 2154–2169 (2003). - PubMed
    1. Tsimihodimos V, Dounousi E & Siamopoulos KC Dyslipidemia in Chronic Kidney Disease: An Approach to Pathogenesis and Treatment. Am. J. Nephrol. 28, 958–973 (2008). - PubMed
    1. Thompson S et al. Cause of Death in Patients with Reduced Kidney Function. J. Am. Soc. Nephrol. 26, 2504–2511 (2015). - PMC - PubMed

Publication types