. 2021 Sep 20:15:722374.
doi: 10.3389/fnana.2021.722374. eCollection 2021.

Otic Neurogenesis in Xenopus laevis: Proliferation, Differentiation, and the Role of Eya1

Affiliations

Otic Neurogenesis in Xenopus laevis: Proliferation, Differentiation, and the Role of Eya1

Suad Hamdan Almasoudi et al. Front Neuroanat. .

Abstract

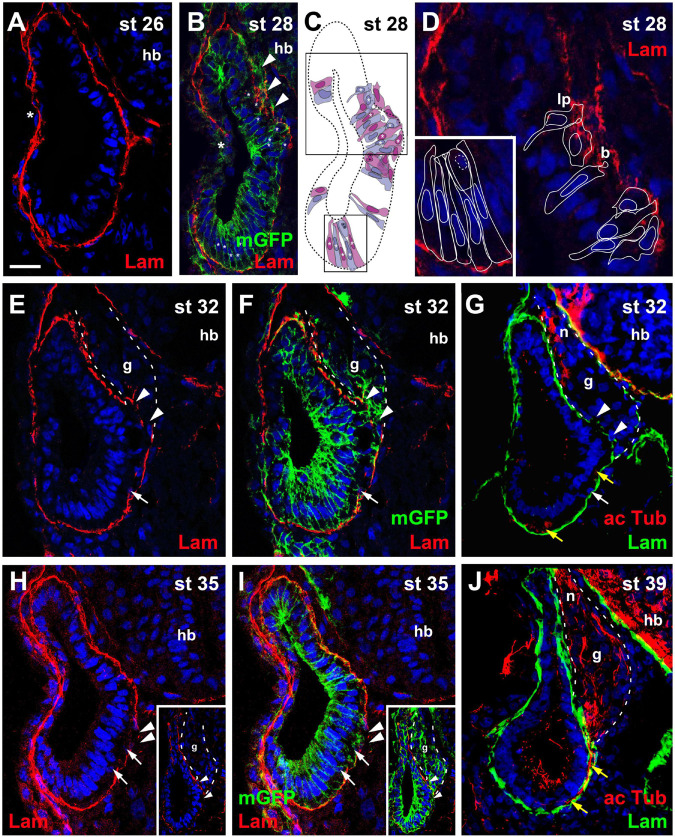
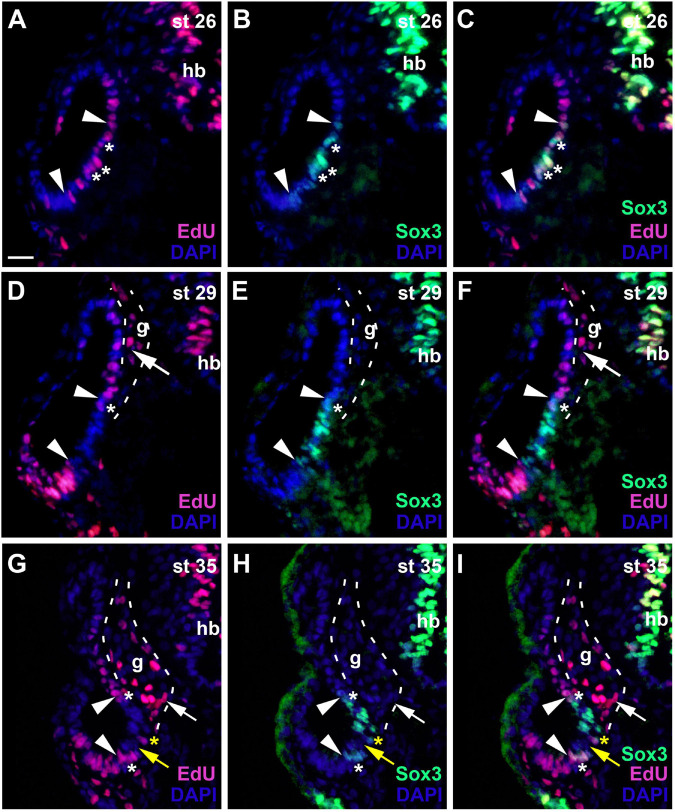
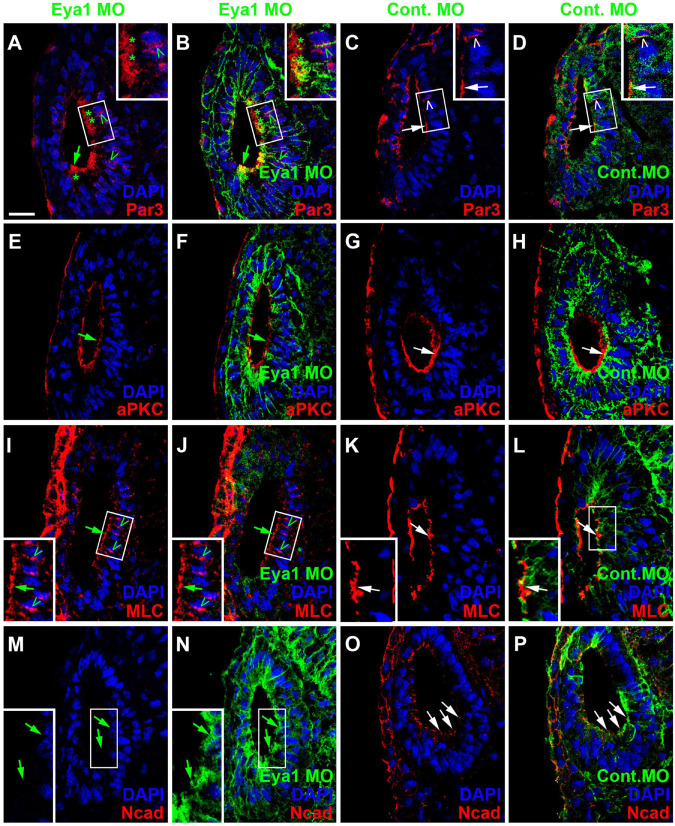
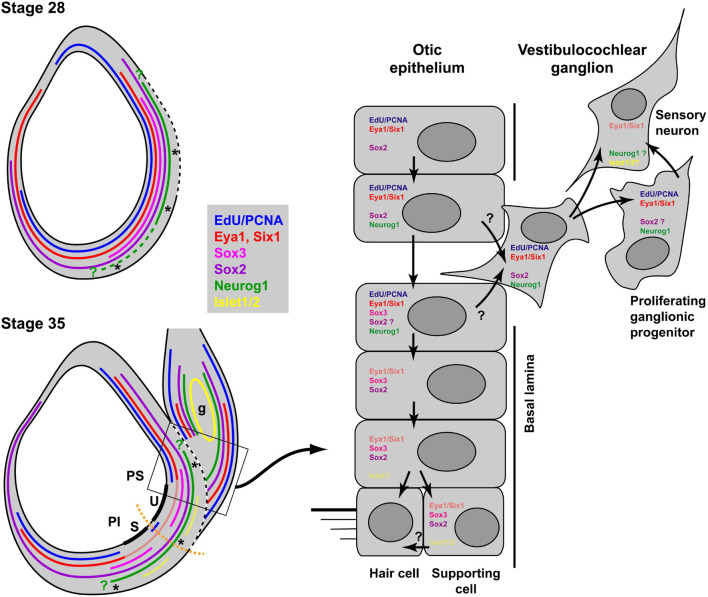
Using immunostaining and confocal microscopy, we here provide the first detailed description of otic neurogenesis in Xenopus laevis. We show that the otic vesicle comprises a pseudostratified epithelium with apicobasal polarity (apical enrichment of Par3, aPKC, phosphorylated Myosin light chain, N-cadherin) and interkinetic nuclear migration (apical localization of mitotic, pH3-positive cells). A Sox3-immunopositive neurosensory area in the ventromedial otic vesicle gives rise to neuroblasts, which delaminate through breaches in the basal lamina between stages 26/27 and 39. Delaminated cells congregate to form the vestibulocochlear ganglion, whose peripheral cells continue to proliferate (as judged by EdU incorporation), while central cells differentiate into Islet1/2-immunopositive neurons from stage 29 on and send out neurites at stage 31. The central part of the neurosensory area retains Sox3 but stops proliferating from stage 33, forming the first sensory areas (utricular/saccular maculae). The phosphatase and transcriptional coactivator Eya1 has previously been shown to play a central role for otic neurogenesis but the underlying mechanism is poorly understood. Using an antibody specifically raised against Xenopus Eya1, we characterize the subcellular localization of Eya1 proteins, their levels of expression as well as their distribution in relation to progenitor and neuronal differentiation markers during otic neurogenesis. We show that Eya1 protein localizes to both nuclei and cytoplasm in the otic epithelium, with levels of nuclear Eya1 declining in differentiating (Islet1/2+) vestibulocochlear ganglion neurons and in the developing sensory areas. Morpholino-based knockdown of Eya1 leads to reduction of proliferating, Sox3- and Islet1/2-immunopositive cells, redistribution of cell polarity proteins and loss of N-cadherin suggesting that Eya1 is required for maintenance of epithelial cells with apicobasal polarity, progenitor proliferation and neuronal differentiation during otic neurogenesis.

Keywords: Eya1; Xenopus; cell polarity; delamination; ear; neurogenesis; otic vesicle; vestibulocochlear ganglion.


Conflict of interest statement

The authors declare that the research was conducted in the absence of any commercial or financial relationships that could be construed as a potential conflict of interest.

Figures

FIGURE 1
FIGURE 1
Time course of neurogenesis and neuronal migration in the otic vesicle. Immunostaining for laminin (Lam) in transverse sections through the center of the left otic vesicle of Xenopus embryos from stage 26 to 39 analyzed in single confocal planes (A–G) or maximum intensity projections of z-stacks (H–J) (dorsal to the top, medial to the right). Some sections have also been immunostained for acetylated tubulin (G,J) or a membrane bound form of GFP (mGFP) following mGFP mRNA injection (B,F,I). DAPI was used to label nuclei. Different channels of same section shown in (E,F) and in (H,I). Arrowheads indicate breaches in the basal lamina. b, blob; g, vestibulocochlear ganglion (outlined with hatched lines); hb, hindbrain; lp, lamellipodium; n, vestibulocochlear nerve. (A) At stage 26 the otic vesicle has largely invaginated and is surrounded by a basal lamina. Reorganization of the basal lamina takes place where otic epithelia are in the process of fusion laterally (asterisk). (B–D) At stage 28 the first breaches appear in the basal lamina on the medial side of the otic vesicle (arrowheads), whereas reorganization of the basal lamina continues laterally (asterisk). (C) Shows cell shapes reconstructed from mGFP staining of a z-stack, from which (B) was taken. Cells are shown in alternating blue and purple colors for clarity. They form a single-layered, pseudostratified epithelium. Outlines of cells marked with asterisks in the black boxes in (C) are shown at higher magnification in (D) superimposed on laminin staining. Laminin is displaced where lamellipodia protrude from cells which probably migrate out of the otic vesicle. Some cells form blob-like protrusions through gaps in the basal lamina. (E–J) At later stages (stages 32–39) the ganglion (g; outlined with white hatched line in (E–G) and axons of the vestibulocochlear nerve (n) can be recognized between the otic vesicle and the hindbrain. (H,I) Show a section through the stage 35 otic vesicle immediately posterior to the main body of the ganglion, while a section through another otic vesicle at the center of the ganglion is shown in insets. At stages 32 (E–G) and 35 (H,I) there are still medial gaps in the basal lamina next to the ganglion, but these have closed by stage 39 (J). Cells on the ventromedial side of the otic vesicle (white arrows) and acetylated tubulin stained axons (yellow arrows) located between the otic epithelium and the basal lamina are indicated. Scale bar in (A): 25 μm (for all panels).
FIGURE 2
FIGURE 2
Distribution of mitoses and apico-basal markers in the otic epithelium at stage 26. Transverse sections through the center of the left otic vesicle of Xenopus embryos at stage 26 analyzed in single confocal planes (dorsal to the top, medial to the right). Sections have also been immunostained for membrane GFP (mGFP) following mGFP mRNA injection. DAPI was used to label nuclei. Different channels of same section shown in (A–C), (D–F), (G–I), (J–L), and (M–O). (A–C) Mitotic, pH3 positive cells in the otic epithelium (asterisks) are located near the apical (luminal) surface. One pH3 positive nucleus (asterisk) is located outside the invaginated otic vesicle in the adjacent posterior placodal area, which is in a process of dynamic reorganization where apical and basal surfaces cannot be ascertained. (D–O) Immunostaining for cell polarity proteins Par3 (D–F), aPKC (G–I), MLC (J–L), and N-cadherin (Ncad; (M–O)). Note the prevalence of apical and/or apicolateral staining. Apical/apicolateral staining is notably absent from the lateral domain of the otic epithelium, where invaginating epithelia fuse (asterisks in (D–O)). In addition to its distribution on the apical side of the otic vesicle, aPKC is localized to basal protrusions on the ventromedial side of the otic epithelium (white arrowheads in (G–I)). White boxed area in (I) is shown at higher magnification in insets. Apicolateral Ncad-staining is markedly reduced in the medial and ventromedial otic epithelium (arrowheads), where cells begin to form basal protrusions (arrow). Scale bar in (A): 25 μm (for all panels).
FIGURE 3
FIGURE 3
Apico-basal polarity in the pseudostratified otic epithelium at stage 26. Immunostaining for the cell polarity proteins Par3, aPKC, MLC, and N-cadherin (Ncad) in transverse sections through the center of the left otic vesicle of Xenopus embryos at stage 26 analyzed in single confocal planes (dorsal to the top, medial to the right). Sections have also been immunostained for membrane GFP (mGFP) following mGFP mRNA injection. Distribution of cell polarity proteins in medial otic epithelium as indicated in overview ((A); Par3) and higher magnified views of Par3 (lower and upper box in (A) shown in (B–E)), aPKC (F,G), MLC (H,I), and N-cadherin (J,K). DAPI was used to label nuclei. Different channels of same region shown in (B,C), (D,E), (F,G), (H,I) and (J,K). Inserts in (F–I) show nuclei from adjacent cells in medial otic epithelium, which show clear perinuclear and membrane staining. All proteins are localized to the apical (Par3, aPKC, MLC) and/or apicolateral (Par3, aPKC, MLC, Ncad) surface of cells. In addition, Par3 is localized to some cytoplasmic regions and nuclei and Par3, aPKC, and MLC show staining of membranes and perinuclear staining associated with some nuclei. White arrowheads indicate apical staining; white arrows: apicolateral (junctional) staining; white open arrowheads: cytoplasmic staining; yellow arrows: membrane staining next to nuclei; yellow arrowheads: perinuclear staining; yellow open arrowheads: nuclear staining; asterisk in (D,E): dividing nuclei. Scale bars (A) 25 μm; (B) 10 μm (for (B–K)).
FIGURE 4
FIGURE 4
Distribution of apico-basal polarity markers in otic vesicle and vestibulocochlear ganglion at stage 35. Immunostaining for the cell polarity proteins Par3 ((A–C), (E–G)), aPKC ((I–K), (M–O)) and MLC (Q–S) in transverse sections through the center of the left otic vesicle of Xenopus embryos at stage 35 analyzed in single confocal planes (dorsal to the top, medial to the right). Sections have also been immunostained for membrane GFP (mGFP) following mGFP mRNA injection. DAPI was used to label nuclei. Different channels of same section and cell shapes (shown in alternating blue and purple colors for clarity) reconstructed from mGFP staining of a z-stack are shown in (A–D), (I–L), and (Q–S) with boxed regions shown magnified in (E–H) and (M–P). (A–H) Par3 staining at stage 35 is strongly reduced in the otic epithelium and is mostly found localized to basal protrusions and to the membranes of vestibulocochlear ganglion cells. (I–O) aPKC is still localized to the apical side of the otic epithelium at stage 35, but is also enriched in membranes of basal protrusions and the leading edge of delaminating ganglion cells. (Q–S) MLC immunostaining at stage 35 is strongly reduced in the apical and apicolateral part of otic epithelial cells (single asterisks), but some staining is found in lateral cell membranes (arrowhead) and in the cytoplasm of vestibulocochlear ganglion cells (arrow). White arrowheads indicate apical staining; white arrows: apicolateral (junctional) staining; white or black open arrowheads: basal protrusions; colored arrows: leading edge (axon forming) of vestibulocochlear ganglion cells; colored arrowheads: trailing edge (dendrite forming) of vestibulocochlear ganglion cells; colored asterisks: nuclei. Individual cells are indicated by different colors. Triangles indicate imaging artifacts (absence of signal in single confocal plane due to bends in section). Scale bars (A) 25 μm (for (A–D), (I–L), (Q–S)); (E) 10 μm (for (E–G), (M–O)).
FIGURE 5
FIGURE 5
Changing distribution of proliferative and non-proliferative progenitors during development of the otic vesicle. Distribution of proliferative (EdU-positive) cells and Sox3−immunopositive sensorineural progenitors in transverse sections through the center of the left otic vesicle of Xenopus embryos from stage 26 to 35 (dorsal to the top, medial to the right). DAPI was used to label nuclei. Different channels of same section shown in (A–C), (D–F) and (G–I). g, vestibulocochlear ganglion (outlined with hatched lines); hb, hindbrain. At stage 26 (A–C), Sox3-immunopositive cells are confined to the ventromedial part of the otic vesicle (between arrowheads), located within a broader domain of EdU staining. Most Sox3–immunopositive cells are also labeled with EdU (asterisks indicate double-labeled cells). At stages 29 (D–F) and 35 (G–I), most cells in the ventromedial region are immunopositive for Sox3 (region between arrowheads) but are no longer proliferative as indicated by lack of EdU staining. A few cells, which are both EdU- and Sox3-positive remain at the upper and lower border of this domain (white asterisks). From stage 33 on, a region of Sox3-immunonegative nuclei (yellow arrows) separates a dorsal from a ventral domain of Sox3-positive cells within the ventromedial domain as shown here for stage 35. Occasionally single EdU-positive cells, which may also be weakly Sox3-positive as shown here, are found in the region between the dorsal and ventral Sox3 domain (yellow asterisks). Proliferative, EdU-positive cells in the vestibulocochlear ganglion (arrows) are confined to the periphery of the ganglion and do not co-express Sox3. Scale bar in (A): 25 μm (for all panels).
FIGURE 6
FIGURE 6
Distribution of neurogenic markers at different levels of the otic vesicle at stage 28/29. Distribution of Neurog1, Atoh1, Sox2 mRNAs, and Sox3 immunostaining in the left otic vesicle of stage 28 or 29 Xenopus embryos showing three approximately equidistant transverse vibratome sections (A–L) and a superimposition of Neurog1 expression with Sox3 immunostaining at a posterior level (M). DAPI was used to label nuclei. Arrowheads indicate extent of region containing cells expressing Neurog1 (yellow), Atoh1 (orange), Sox2 (blue), and Sox3 (white). g, vestibulocochlear ganglion (outlined with hatched lines); hb, hindbrain. Levels: ant.: anterior; mid.: midline; post.: posterior. (A–C) Note that at anterior levels, Neurog1 is expressed throughout the ventral and ventromedial otic epithelium, while it is confined to the central part of the medial otic epithelium further posterior. In the vestibulocochlear ganglion, Neurog1 is expressed only in the distal part next to the otic epithelium but is absent from the proximal part (asterisk). (D–F) Atoh1 overlaps widely with Neurog1, but does not extend as far lateral as the latter in the ventral anterior and more lateral than Neurog1 in the ventral posterior otic vesicle; it is not expressed in the ganglion. (G–I) Sox2 is expressed very broadly in the central otic vesicle, where its expression extends from midlateral to dorsomedial. Its expression is more restricted anteriorly and posteriorly but always reaches further dorsal in the medial otic epithelium than Sox3. It is also weakly expressed in the distal part of the vestibulocochlear ganglion. (J–L) Sox3 immunostaining is confined to the ventromedial otic epithelium reaching its largest dorsal extent in the center of the otic vesicle. (M) shows that Neurog1 expression (between yellow arrowheads in (M)) is located slightly more dorsal than Sox3 and is overlapping with the dorsal but not ventral part of the Sox3-domain (between white arrowheads) in the posterior otic vesicle. Scale bar in (A): 25 μm (for all panels).
FIGURE 7
FIGURE 7
Changing distribution of sensorineural progenitors and differentiating neurons during development of the otic vesicle. Distribution of Sox3-immunopositive sensorineural progenitors in relation to Islet1/2-immunopositive differentiating neurons in transverse sections through the center of the left otic vesicle of Xenopus embryos from stage 26 to 40 (dorsal to the top, medial to the right). DAPI was used to label nuclei. Different channels of same section shown in (A–C), (D–F), (G–I), and (J–L) (slightly posterior of center). g, vestibulocochlear ganglion (outlined with hatched lines); hb, hindbrain. At stage 26, no Islet1/2 positive cells can be seen. From stage 29 on, strongly Islet1/2 positive cells are evident in the vestibulocochlear ganglion. Note the absence of Islet1/2 staining in the peripheral cells of the ganglion (mint arrowheads). In addition, a subset of Sox3-positive cells in the otic epithelium shows weak Islet1/2 staining (white and orange arrowheads), whereas other Sox3-positive cells do not express Islet1/2 (white and orange arrows) (another more dorsal domain of Sox3 + and weakly Islet1/2 + cells present at stage 40 is only visible in more anterior sections; see Supplementary Figure 3). (D–F) Show same section as Figure 6K. Scale bar in (A): 25 μm (for all panels).
FIGURE 8
FIGURE 8
Changing distribution of Eya1 protein during development of the otic vesicle. Distribution of Eya1-immunopositive cells in transverse sections through the center of the left otic vesicle of Xenopus embryos from stage 21 to 40 (dorsal to the top, medial to the right). For each stage, Eya1 staining is shown alone (left panel) as well as superimposed onto nuclear DAPI staining (right panel). Insets in (G–J) show boxed areas of same or adjacent section at higher magnification and with increased brightness (boxed area not shown in (J) for clarity). (A,B) At stage 21, Eya1 is expressed in the invaginating otic vesicle and in the adjacent posterior placodal area (asterisk). (C–F) At stages 26 (C,D) to 28 (E,F), Eya1 immunostaining persists throughout the otic vesicle except for dorsomedial and dorsolateral regions. (G–J) From stage 32 (G,H) on, additional weak Eya1 staining is found throughout the vestibulocochlear ganglion (arrows in insets, which show boxed regions with increased brightness), while strong Eya1-immunostaining persist in the otic epithelium and in peripheral cells of the ganglion. From stage 32 on, Eya1-immunostaining decreases in a ventromedial region of the otic epithelium (flanked by arrowheads), while it remains high in adjacent regions. From stage 35 (I,J) onward, hair cells (open arrowheads) become apparent as a separate layer. While most hair cells do not express Eya1 (yellow open arrowheads), a few hair cells show weak Eya1 staining (white open arrowheads). (K,L) At stage 40, Eya1 is still weakly expressed in the vestibulocochlear ganglion (not shown here; see Supplementary Figure 6). In the otic epithelium Eya1 levels are low in the developing sensory areas (between arrowheads) but Eya1 remains strongly expressed in adjacent regions. g, vestibulocochlear ganglion (outlined with hatched lines); hb, hindbrain; vOt, otic vesicle. Scale bar in (A): 25 μm (for all panels).
FIGURE 9
FIGURE 9
Subcellular localization of Eya1 protein in otic vesicle and vestibulocochlear ganglion at stage 29. (A–G) Immunostaining for Eya1 in a transverse section through the center of the left otic vesicle of Xenopus embryos at stage 29 analyzed by confocal microscopy (dorsal to the top, medial to the right). DAPI was used to label nuclei. (A) Overview showing the same confocal plane as (B2–G2). (B–G) Magnified views of the small (B–D) and large (E–G) boxed area shown in different channels (columns B–G) and in three different confocal planes (rows 1–3; 0.9 μm between adjacent planes). Nuclear staining indicated by asterisks; cytoplasmic staining indicated by arrows. White asterisks show nuclear Eya1 staining in the otic epithelium; orange asterisk indicate Eya1-immunopositive nuclei in periphery of the vestibulocochlear ganglion. White arrows show cytoplasmic staining in the otic epithelium; orange arrows show cytoplasmic Eya1 staining in the ganglion. White arrowheads highlight Eya1-positive protrusions of delaminating or migrating cells. Mint arrowheads indicate cytoplasmic Eya1 staining in a dividing cell of the otic epithelium with the mint arrow indicating the division plane. Note that at this stage cells have begun to delaminate from the otic epithelium to form the vestibulocochlear ganglion. Eya1 shows mostly nuclear but also some cytoplasmic localization in the otic epithelium and vestibulocochlear ganglion. (H–J) Immunostaining for Eya1 and Sox3 in a single confocal plane of another transverse section through the center of the left otic vesicle at stage 29. Note that the Eya1 domain includes but extends further dorsally and ventrolaterally than the Sox3 immunopositive domain (between arrowheads). g, vestibulocochlear ganglion (outlined with hatched lines); hb, hindbrain. Scale bar in (A): 25 μm (for (A,H–J)).
FIGURE 10
FIGURE 10
Subcellular localization of Eya1 protein in otic vesicle and vestibulocochlear ganglion at stage 35. Immunostaining for Eya1 and Sox3 in a transverse section through the center of the left otic vesicle of Xenopus embryos at stage 35 analyzed by confocal microscopy (dorsal to the top, medial to the right). DAPI was used to label nuclei. (A) Overview showing the same confocal plane as (B2–F2). (B–F) Magnified views of the boxed area shown in different channels (columns B–F) and in three different confocal planes (rows 1–3; 0.9 μm between adjacent planes). Putative hair cells indicated by white open arrowheads. Nuclear staining indicated by asterisks; cytoplasmic staining indicated by arrows. White asterisks show nuclear Eya1 staining in the otic epithelium; yellow asterisks indicate nuclei that are immunopositive for both Eya1 and Sox3. Orange asterisk indicate Eya1-immunopositive nuclei in the vestibulocochlear ganglion. White arrows show cytoplasmic staining in the otic epithelium; orange arrows show cytoplasmic Eya1 staining in the ganglion. White arrowheads highlight Eya1-positive protrusions of delaminating cells. Mint arrowheads indicate cytoplasmic Eya1 staining in a dividing cell of the otic epithelium with the mint arrow indicating the division plane. Note that Eya1 shows mostly nuclear but also some cytoplasmic localization in the otic epithelium. Sox3-immunopositive nuclei also co-express Eya1, but at lower levels than adjacent cells. A subset of putative hair cells shows weak nuclear Eya1 staining and a subset of the latter also is weakly Sox3-immunopositive. In the vestibulocochlear ganglion, nuclear Eya1 is mostly found in cells located at the periphery (probably corresponding to proliferative cells), while in the center of the ganglion, Eya1 is mostly cytoplasmic. g, vestibulocochlear ganglion (outlined with hatched lines); hb, hindbrain. Scale bar in (A): 25 μm.
FIGURE 11
FIGURE 11
Role of Eya1 for otic neurogenesis in comparisons of embryos injected with Eya1 MOs or Control MOs. (A) pH3-immunopositive (mitotic) cells in the stage otic vesicle are unchanged after injection of Control MO (ns, not significant) but are significantly reduced after Eya1 MO injection and significantly increased after GR-Eya1 injection and DEX treatment from stage 16–18 compared to uninjected embryos (Uninj.) (asterisk: p < 0.05, t-test; n = 3 for each condition; standard deviations are indicated). (B–M) Changes of EdU-positive proliferative progenitors (B–E), and Sox3- (F–I), and Islet1/2-immunopositive cells (J–M) in transverse sections through the central otic vesicle of stage 35 Xenopus embryos injected with Eya1 MOs (left two columns; different channels of same section) or control MOs (right two columns; different channels of same section) (dorsal to the top, medial to the right). DAPI was used to label nuclei. Reductions of EdU labeling and Sox3- or Islet1/2-immunoreactive cells in otic vesicle of Eya1 MO injected embryos are indicated by green arrows (compare to white arrows for otic vesicle in Control MO injected embryos). Residual EdU labeling in otic vesicle of Eya1 MO injected embryo is indicated by a green asterisk (compare to white asterisk for otic vesicle in Control MO injected embryo). Vestibulocochlear ganglion outlined with hatched lines in (J–M). Scale bar in (B): 25 μm (for (B–M)).
FIGURE 12
FIGURE 12
Role of Eya1 for otic cell polarity in comparisons of embryos injected with Eya1 MOs or Control MOs. Changes of Par3- (A–D), aPKC- (E–H), MLC- (I–L), and N-Cadherin (M–P) immunostaining in transverse sections through the central otic vesicle of stage 26 Xenopus embryos injected with Eya1 MOs (left two columns; different channels of same section) or control MOs (right two columns; different channels of same section) (dorsal to the top, medial to the right). DAPI was used to label nuclei. Embryos injected with Control MOs show a normal pattern of protein distribution (see Figure 2). Boxed areas are shown at higher magnification in insets. Protein distribution in the apical and apicolateral membrane (arrows), cytoplasm (asterisks) and between nuclei and membrane (open arrowheads) are indicated. Green symbols indicate protein distribution in Eya1 MO injected embryos and white symbols in Control MO injected embryos. Note that Par3, aPKC, and MLC remain apically localized after Eya1 MO injection, although apical protein levels of Par3 and aPKC are often reduced compared to embryos injected with Control MO. Apicolateral staining of N-cadherin is completely abolished after Eya1 MO injections but not affected after injection with Control MOs. Increasing cytoplasmic and perinuclear distribution of Par3 and MLC is observed in embryos injected with Eya1 MO as compared to Control MO injected embryos. Scale bar in (A): 25 μm (for all panels).
FIGURE 13
FIGURE 13
Neurogenesis and sensory area formation in the otic vesicle of Xenopus laevis. Schematic diagrams of central sections through otic vesicles are shown with proliferation zones (EdU/PCNA) and approximate extent of marker expression domains in the otic vesicle and the vestibulocochlear ganglion (g) indicated by colored lines. Faint red and yellow colors indicate domains of weak expression of Eya1 and Islet1/2, respectively. Data from previous publications suggest that Six1 is expressed in similar domains to Eya1 (Pandur and Moody, 2000; David et al., 2001; Schlosser and Ahrens, 2004). All other data are based on the current study. Green question marks indicate that the precise position of the expression boundaries for Neurog1 are not known. The hatched part of the line for Neurog1 indicates that its expression extends more ventrally in the anterior otic vesicle at stage 28. The broken white line indicates the extent of the breach in the basal lamina. Thick black lines indicate the developing sensory areas (maculae) of the saccule (S) in the pars inferior (PI) and of the utricle (U) in the pars superior (PS) of the otic vesicle. Asterisks indicate regions of neuronal delamination. These extend broadly throughout the ventromedial part of the otic vesicle at early stages but probably become restricted to the ventral and dorsal borders of sensory areas at stage 35. Black arrows in the right panel indicate putative cell state transitions. See text for details.

References

    1. Abdelhak S., Kalatzis V., Heilig R., Compain S., Samson D., Vincent C., et al. (1997). A human homologue of the Drosophila eyes absent gene underlies Branchio-Oto-Renal (BOR) syndrome and identifies a novel gene family. Nat. Genet. 15 157–164. 10.1038/ng0297-157 - DOI - PubMed
    1. Abelló G., Khatri S., Radosevic M., Scotting P. J., Giráldez F., Alsina B. (2010). Independent regulation of Sox3 and Lmx1b by FGF and BMP signaling influences the neurogenic and non-neurogenic domains in the chick otic placode. Dev. Biol. 339 166–178. 10.1016/j.ydbio.2009.12.027 - DOI - PubMed
    1. Adam J., Myat A., Leroux I., Eddison M., Henrique D., Ishhorowicz D., et al. (1998). Cell fate choices and the expression of Notch, Delta and Serrate homologues in the chick inner ear: parallels with Drosophila sense-organ development. Development 125 4645–4654. - PubMed
    1. Ahmed M., Wong E. Y., Sun J., Xu J., Wang F., Xu P. X. (2012a). Eya1-Six1 interaction is sufficient to induce hair cell fate in the cochlea by activating atoh1 expression in cooperation with Sox2. Dev. Cell 22 377–390. 10.1016/j.devcel.2011.12.006 - DOI - PMC - PubMed
    1. Ahmed M., Xu J., Xu P. X. (2012b). EYA1 and SIX1 drive the neuronal developmental program in cooperation with the SWI/SNF chromatin-remodeling complex and SOX2 in the mammalian inner ear. Development 139 1965–1977. 10.1242/dev.071670 - DOI - PMC - PubMed