. 2022 Feb;61(2):307-320.
doi: 10.1007/s40262-021-01072-4. Epub 2021 Oct 7.

Development and Evaluation of a Virtual Population of Children with Obesity for Physiologically Based Pharmacokinetic Modeling

Collaborators, Affiliations

Development and Evaluation of a Virtual Population of Children with Obesity for Physiologically Based Pharmacokinetic Modeling

Jacqueline G Gerhart et al. Clin Pharmacokinet. 2022 Feb.

Abstract

Background and objective: While one in five children in the USA are now obese, and more than three-quarters receive at least one drug during childhood, there is limited dosing guidance for this vulnerable patient population. Physiologically based pharmacokinetic modeling can bridge the gap in the understanding of how pharmacokinetics, including drug distribution and clearance, changes with obesity by incorporating known obesity-related physiological changes in children. The objective of this study was to develop a virtual population of children with obesity to enable physiologically based pharmacokinetic modeling, then use the novel virtual population in conjunction with previously developed models of clindamycin and trimethoprim/sulfamethoxazole to better understand dosing of these drugs in children with obesity.

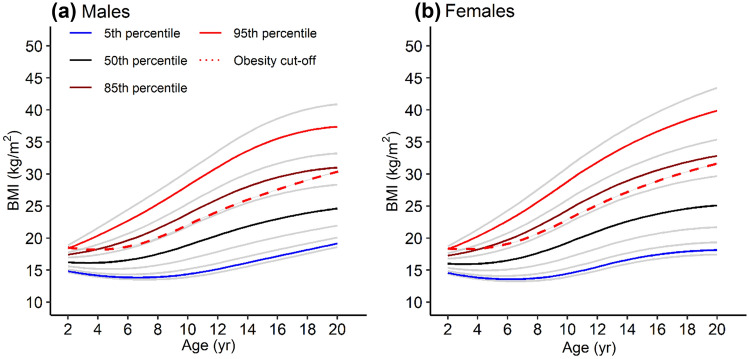
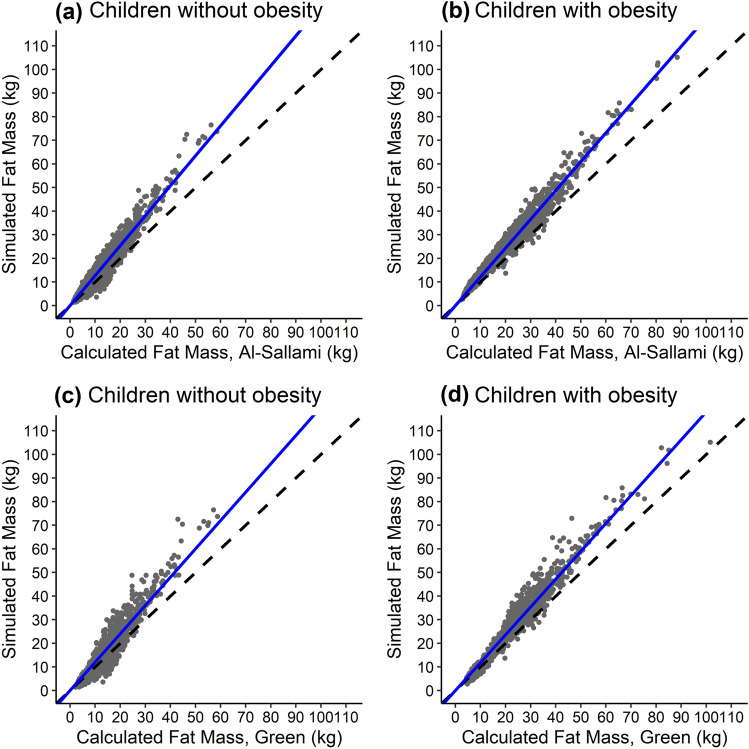
Methods: To enable physiologically based pharmacokinetic modeling, a virtual population of children with obesity was developed using national survey, electronic health record, and clinical trial data, as well as data extracted from the literature. The virtual population accounts for key obesity-related changes in physiology relevant to pharmacokinetics, including increased body size, body composition, organ size and blood flow, plasma protein concentrations, and glomerular filtration rate. The virtual population was then used to predict the pharmacokinetics of clindamycin and trimethoprim/sulfamethoxazole in children with obesity using previously developed physiologically based pharmacokinetic models.

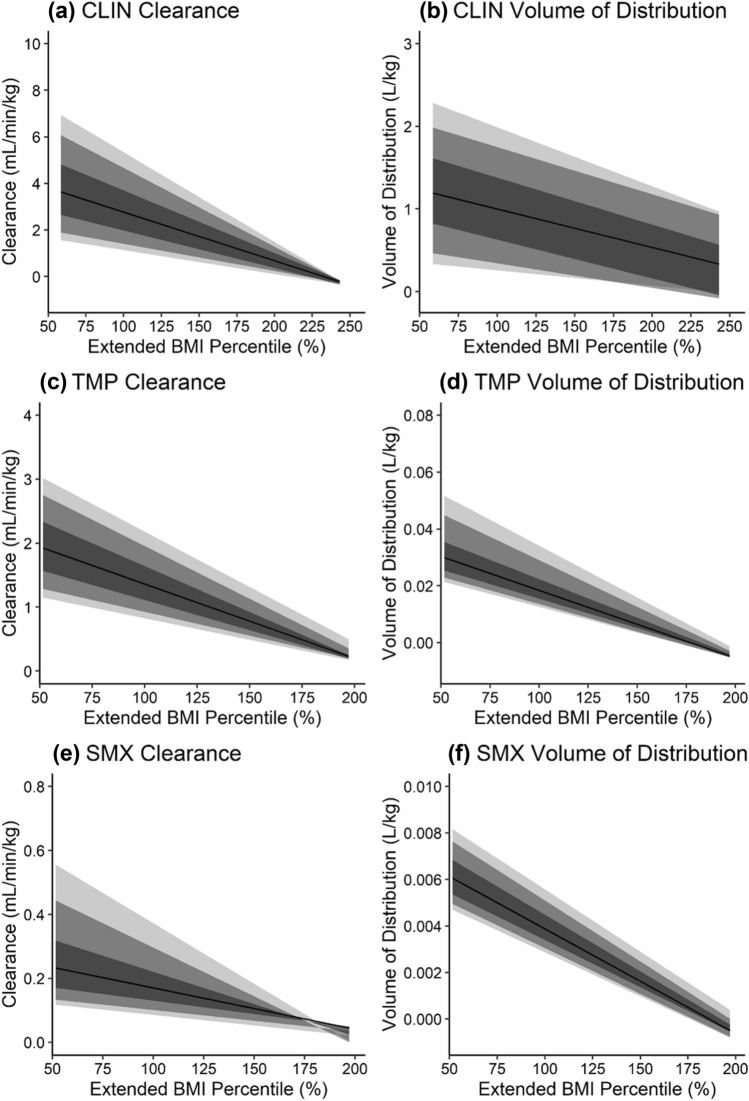
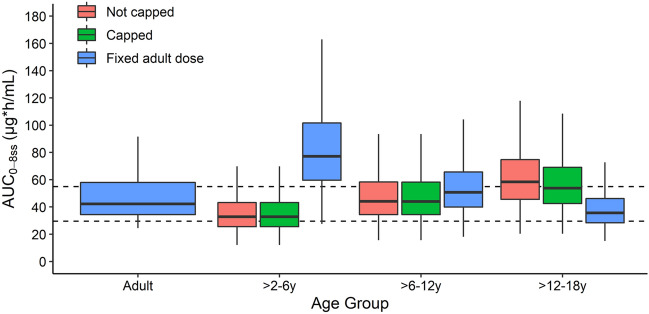
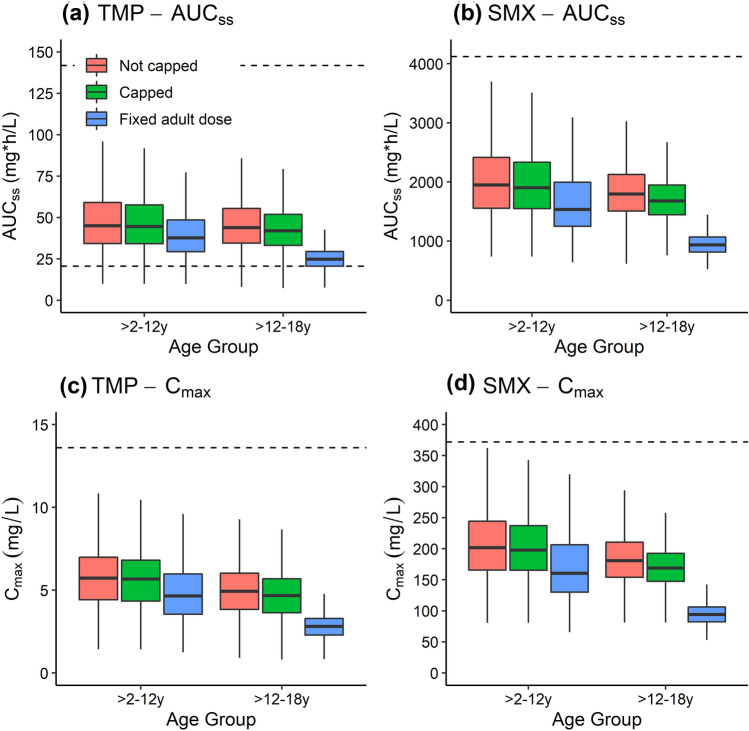
Results: Model simulations predicted observed concentrations well, with an overall average fold error of 1.09, 1.24, and 1.53 for clindamycin, trimethoprim, and sulfamethoxazole, respectively. Relative to children without obesity, children with obesity experienced decreased clindamycin and trimethoprim/sulfamethoxazole weight-normalized clearance and volume of distribution, and higher absolute doses under recommended pediatric weight-based dosing regimens.

Conclusions: Model simulations support current recommended weight-based dosing in children with obesity for clindamycin and trimethoprim/sulfamethoxazole, as they met target exposure despite these changes in clearance and volume of distribution.


Conflict of interest statement

M.C.-W. received support from the NICHD (HHSN275201000003I), the National Center for Advancing Translational Sciences [1U24TR001608]), and the FDA (1U18FD006298); he also receives research support from industry for neonatal and pediatric drug development, https://dcri.org/about-us/conflict-of-interest/. The remaining authors have no relevant conflicts of interest to disclose.

Figures

Fig. 1
Fig. 1
Updated growth curves based on National Health and Nutrition Examination Survey (NHANES) pooled data for male and female groups. Key body mass index (BMI) percentiles are highlighted in blue (5th percentile), black (50th percentile), dark red (85th percentile), and red (95th percentile). The BMI cut-off for obesity as defined by the Centers for Disease Control and Prevention (CDC) is represented by the bold red dashed line, such that children with a BMI above that line for a given age are considered obese. Files with lambda-mu-sigma (LMS) parameters for plotting the updated growth curves and calculating updated BMI percentiles are provided in the ESM
Fig. 2
Fig. 2
Simulated vs calculated fat mass for 1500 virtual children without (a and c) and 1500 virtual children with (b and d) obesity. Simulated fat mass was determined from the volume of the adipose organ generated for each virtual child in PK-Sim®. Calculated fat mass was determined using each virtual child’s demographic information and the fat mass equations derived from Al-Sallami et al. (a and b) and Green et al. (c and d) [33, 34]. Each point represents a single virtual child. Dashed lines represent the lines of unity for reference, and blue lines represent a linear regression passing through the origin for better visualization of misspecification. The slope of this regression line is 1.26, 1.22, 1.20, and 1.18 for (ad), respectively
Fig. 3
Fig. 3
Changes in simulated weight-normalized clearance (a, c, e) and weight-normalized volume of distribution (b, d, f) for clindamycin (a, b), trimethoprim (c, d), and sulfamethoxazole (e, f) with increasing body size, i.e., extended body mass index (BMI) percentile. Extended BMI percentile is calculated as BMI divided by the 95th BMI percentile for a subject’s age and sex, where children with an extended BMI percentile ≥ 100% are considered obese. Clearance and volume of distribution were calculated from virtual children aged 12–18 years with and without obesity (similar plots for virtual children aged 2–6 years and 6–12 years are presented in Figs. 14 and 15 of the ESM). Virtual children received single doses of 600 mg intravenous (IV) infusion (30 min) clindamycin (CLIN), 160 mg oral (PO) trimethoprim (TMP), and 800 mg PO sulfamethoxazole (SMX). The shaded regions denote the 90% (95th and 5th percentiles), 80% (90th and 10th percentiles), and 50% (75th and 25th percentiles) prediction intervals from lightest to darkest color intensity, respectively. The black line denotes the median prediction. Note that variability in pharmacokinetic parameters appears decreased at the upper extremity of extended BMI percentile owing to a lower number of virtual subjects in this range
Fig. 4
Fig. 4
Boxplots of simulated clindamycin steady-state area under the concentration–time curve from 0 to 8 h (AUC0–8,ss) in virtual healthy adults (reference) and virtual children with obesity following population simulations (n = 1000 per age group). Adults received the reference clindamycin dose of 600 mg intravenously (IV). Children received either the total weight-based recommended dose (12 mg/kg IV for children aged > 2–6 years and 10 mg/kg IV for children aged > 6–18 years) or the recommended dosing capped at 900 mg IV, or a fixed adult dose of 600 mg IV. Boxes represent the median and interquartile range (IQR), and whiskers extend to 1.5*IQR. Dashed lines represent the AUC0–8,ss range that is within 30% of the adult median AUC0–8,ss value
Fig. 5
Fig. 5
Boxplots of simulated trimethoprim (TMP) and sulfamethoxazole (SMX) steady-state area under the concentration–time curve (AUCss) and maximum concentration (Cmax) in virtual children with obesity following population simulations (n = 1000 per age group). Virtual children received either the total weight-based recommended dose (6 and 30 mg/kg orally [PO] for children aged > 2–12 years and 4 and 20 mg/kg PO for children aged > 12–18 years) or the recommended dosing with a cap of 320 and 1600 mg PO, as per the US Food and Drug Administration (FDA) maximum recommended dose, or a fixed adult dose of 160 and 800 mg PO for TMP and SMX, respectively. Boxes represent the median and interquartile range (IQR), and whiskers extend to 1.5*IQR. The solid line represents the target AUCss efficacy threshold for TMP, and the dashed lines represent the toxicity AUCss and Cmax thresholds for both TMP and SMX

References

    1. Skinner AC, Ravanbakht SN, Skelton JA, Perrin EM, Armstrong SC. Prevalence of obesity and severe obesity in US children, 1999–2016. Pediatrics. 2018;141:e20173459. - PMC - PubMed
    1. World Health Organization. Report of the commision on ending childhood obesity. WHO Doc Prod Serv. 2016. https://apps.who.int/iris/bitstream/handle/10665/204176/9789241510066_en.... Accessed 14 Nov 2020.
    1. (NCD-RisC) NRFC Worldwide trends in body-mass index, underweight, overweight, and obesity from 1975 to 2016: a pooled analysis of 2416 population-based measurement studies in 128.9 million children, adolescents, and adults. Lancet. 2017;390:2627–2642. - PMC - PubMed
    1. Solmi F, Morris S. Association between childhood obesity and use of regular medications in the UK: longitudinal cohort study of children aged 5–11 years. BMJ Open. 2015;5:e007373. - PMC - PubMed
    1. Vernacchio L, Kelly JP, Kaufman DW, Mitchell AA. Medication use among children < 12 years of age in the United States: results from the Slone Survey. Pediatrics. 2009;124:446–454. - PubMed

Publication types

Substances