. 2022 Feb 9;115(2):456-470.
doi: 10.1093/ajcn/nqab339.

Joint temporal dietary and physical activity patterns: associations with health status indicators and chronic diseases

Affiliations

Joint temporal dietary and physical activity patterns: associations with health status indicators and chronic diseases

Luotao Lin et al. Am J Clin Nutr. .

Abstract

Background: Diet and physical activity (PA) are independent risk factors for obesity and chronic diseases including type 2 diabetes mellitus (T2DM) and metabolic syndrome (MetS). The temporal sequence of these exposures may be used to create patterns with relations to health status indicators.

Objectives: The objectives were to create clusters of joint temporal dietary and PA patterns (JTDPAPs) and to determine their association with health status indicators including BMI, waist circumference (WC), fasting plasma glucose, glycated hemoglobin, triglycerides, HDL cholesterol, total cholesterol, blood pressure, and disease status including obesity, T2DM, and MetS in US adults.

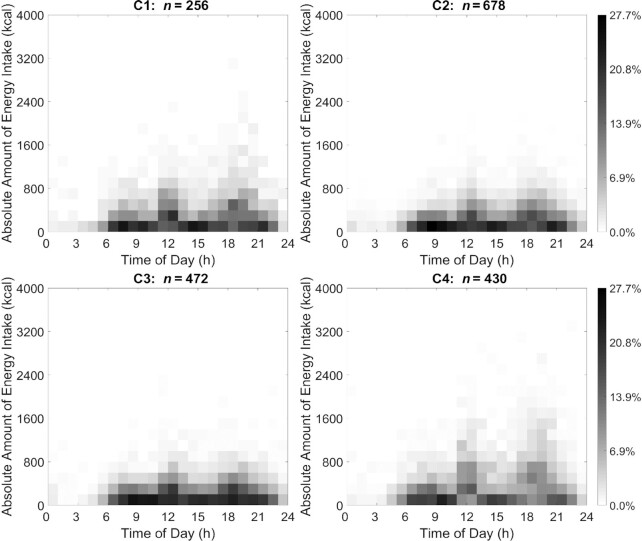
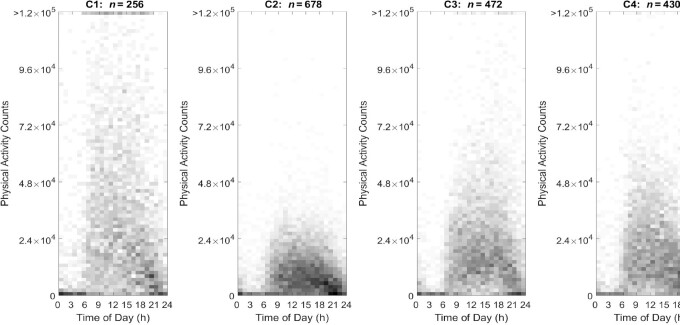
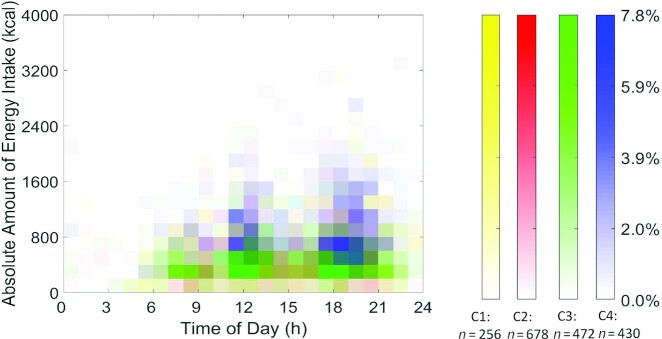
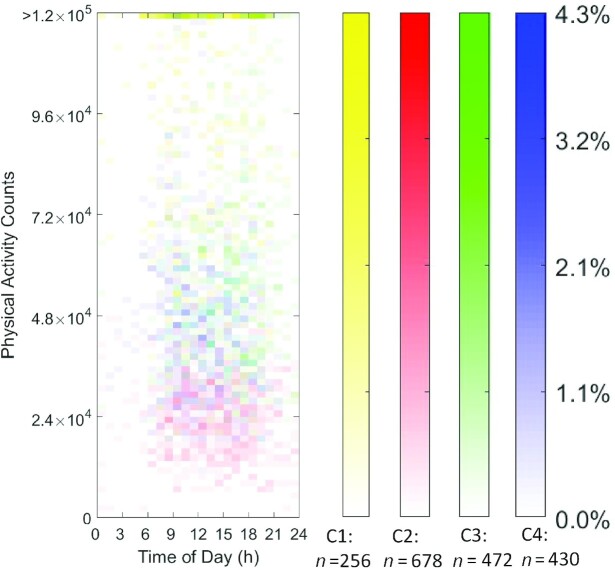
Methods: A 24-h dietary recall and random day of accelerometer data of 1836 participants from the cross-sectional NHANES 2003-2006 data were used to create JTDPAP clusters by constrained dynamic time warping, coupled with a kernel k-means clustering algorithm. Multivariate regression models determined associations between the 4 JTDPAP clusters and health and disease status indicators, controlling for potential confounders and adjusting for multiple comparisons.

Results: A JTDPAP cluster with proportionally equivalent energy consumed at 2 main eating occasions reaching ≤1600 and ≤2200 kcal from 11:00 to 13:00 and from 17:00 to 20:00, respectively, and the highest PA counts among 4 clusters from 08:00 to 20:00, was associated with significantly lower BMI (P < 0.0001), WC (P = 0.0001), total cholesterol (P = 0.02), and odds of obesity (OR: 0.2; 95% CI: 0.1, 0.5) than a JTDPAP cluster with proportionally equivalent energy consumed reaching ≤1600 and ≤1800 kcal from 11:00 to 14:00 and from 17:00 to 21:00, respectively, and high PA counts from 09:00 to 12:00.

Conclusions: The joint temporally patterned sequence of diet and PA can be used to cluster individuals with meaningful associations to BMI, WC, total cholesterol, and obesity. Temporal patterns hold promise for future development of lifestyle patterns that integrate additional temporal and contextual activities.

Keywords: BMI; adults; chrono-nutrition; dietary patterns; obesity; physical activity patterns; temporal pattern; waist circumference.


Figures

FIGURE 1
FIGURE 1
EI heat maps representing 4 distinct JTDPAPs for US adults aged 20–65 y drawn from NHANES 2003–2006 (C1: n = 256; C2: n = 678; C3: n = 472; C4: n = 430). Distribution of 1836 participants’ EI in 4 JTDPAP clusters generated through the dependent constrained band dynamic time warping method is shown. The absolute EI ranging from 0 to 4000 kcal (y axis) ranging from 00:00 to 24:00 at the hourly level (x axis) for nonpregnant US adults aged 20–65 y as drawn from NHANES 2003–2006 is depicted. The proportion of participants in each of 4 JTDPAP clusters reporting EI is represented through shading ranging from 0.0% to 27.7% of participants. Darker shading represents a greater percentage of participants in the cluster reporting the same amount of EI at that time. C1, Cluster 1; C2, Cluster 2; C3, Cluster 3; C4, Cluster 4; EI, energy intake; JTDPAP, joint temporal dietary and physical activity pattern.
FIGURE 2
FIGURE 2
PA heat maps representing 4 distinct JTDPAPs for US adults aged 20–65 y drawn from NHANES 2003–2006 (C1: n = 256; C2: n = 678; C3: n = 472; C4: n = 430). Distribution of PA of 4 JTDPAP clusters generated through the dependent constrained band dynamic time warping method is shown. PACs ranging from 0 cph to 1.2 × 105 cph (y axis, truncated) ranging from 00:00 to 24:00 (x axis) for US adults aged 20–65 y as drawn from NHANES 2003–2006 are depicted. The proportion of participants in each of 4 JTDPAP clusters reporting PA is represented through shading ranging from 0.0% to 13.9% of participants. Darker shading represents a greater percentage of participants in the cluster reporting the same number of PACs at that time. cph, counts per hour; C1, Cluster 1; C2, Cluster 2; C3, Cluster 3; C4, Cluster 4; JTDPAP, joint temporal dietary and physical activity pattern; PA, physical activity; PAC, physical activity count.
FIGURE 3
FIGURE 3
The largest EI heat maps representing 4 distinct JTDPAPs for US adults aged 20–65 y drawn from NHANES 2003–2006. Heat maps (distribution) of the highest EI of 1836 participants in 4 JTDPAP clusters (C1: n = 256; C2: n = 678; C3: n = 472; C4: n = 430). The clusters were generated through the dependent constrained band dynamic time warping method for nonpregnant US adults aged 20–65 y as drawn from NHANES 2003–2006. The absolute EI (blocks in heat map) is characterized by amount (y axis: ranging from 0 to 4000 kcal) ranging from 00:00 to 24:00 at the hourly level (x axis). The shading of blocks (ranging from 0.0% to 7.8%) represents the proportion of participants in each cluster whose highest EI is characterized by the corresponding amount and timing. Darker shading represents a greater percentage of participants in the cluster reporting the same amount of EI at that time. C1, Cluster 1; C2, Cluster 2; C3, Cluster 3; C4, Cluster 4; EI, energy intake; JTDPAP, joint temporal dietary and physical activity pattern.
FIGURE 4
FIGURE 4
The largest PA heat maps representing 4 distinct JTDPAPs for US adults aged 20–65 y drawn from NHANES 2003–2006. Heat maps (distribution) of the highest PA of participants in 4 JTDPAP clusters (C1: n = 256; C2: n = 678; C3: n = 472; C4: n = 430). The clusters were generated through the dependent constrained band dynamic time warping method for US adults aged 20–65 y as drawn from NHANES 2003–2006. The PA (blocks in heat map) is characterized by counts (y axis: ranging from 0 cph to 1.2 × 105 cph, truncated) ranging from 00:00 to 24:00 at the hourly level (x axis). The shading of blocks (ranging from 0.0% to 13.9%) represents the proportion of participants in each cluster whose highest PAC is characterized by the corresponding amount and timing. Darker shading represents a greater percentage of participants in the cluster reporting the same number of PACs at that time. cph, counts per hour; C1, Cluster 1; C2, Cluster 2; C3, Cluster 3; C4, Cluster 4; JTDPAP, joint temporal dietary and physical activity pattern; PA, physical activity; PAC, physical activity count.

References

    1. Dietary Guidelines Advisory Committee. Scientific Report of the 2015 Dietary Guidelines Advisory Committee: advisory report to the Secretary of Health and Human Services and the Secretary of Agriculture. Washington (DC): USDA Agricultural Research Service; 2015.
    1. 2018 Physical Activity Guidelines Advisory Committee. 2018 Physical Activity Guidelines Advisory Committee scientific report. Washington (DC): US Department of Health and Human Services; 2018.
    1. Busch V, Van Stel HF, Schrijvers AJ, de Leeuw JR. Clustering of health-related behaviors, health outcomes and demographics in Dutch adolescents: a cross-sectional study. BMC Public Health. 2013;13(1):1118. - PMC - PubMed
    1. Elliot CA, Hamlin MJ. Combined diet and physical activity is better than diet or physical activity alone at improving health outcomes for patients in New Zealand's primary care intervention. BMC Public Health. 2018;18(1):230. - PMC - PubMed
    1. Aqeel MM, Forster A, Richards EA, Hennessy E, McGowan B, Bhadra A, Guo J, Gelfand SB, Delp EJ, Eicher-Miller HA. The effect of timing of exercise and eating on postprandial response in adults: a systematic review. Nutrients. 2020;12(1):221. - PMC - PubMed

Publication types

MeSH terms