. 2022 Feb 9;115(2):432-443.
doi: 10.1093/ajcn/nqab332.

A posteriori dietary patterns better explain variations of the gut microbiome than individual markers in the American Gut Project

Affiliations

A posteriori dietary patterns better explain variations of the gut microbiome than individual markers in the American Gut Project

Aurélie Cotillard et al. Am J Clin Nutr. .

Abstract

Background: Individual diet components and specific dietary regimens have been shown to impact the gut microbiome.

Objectives: Here, we explored the contribution of long-term diet by searching for dietary patterns that would best associate with the gut microbiome in a population-based cohort.

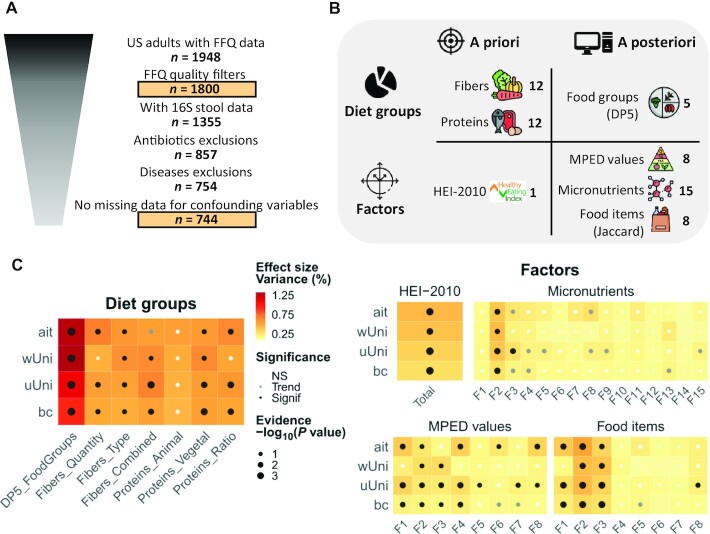
Methods: Using a priori and a posteriori approaches, we constructed dietary patterns from an FFQ completed by 1800 adults in the American Gut Project. Dietary patterns were defined as groups of participants or combinations of food variables (factors) driven by criteria ranging from individual nutrients to overall diet. We associated these patterns with 16S ribosomal RNA-based gut microbiome data for a subset of 744 participants.

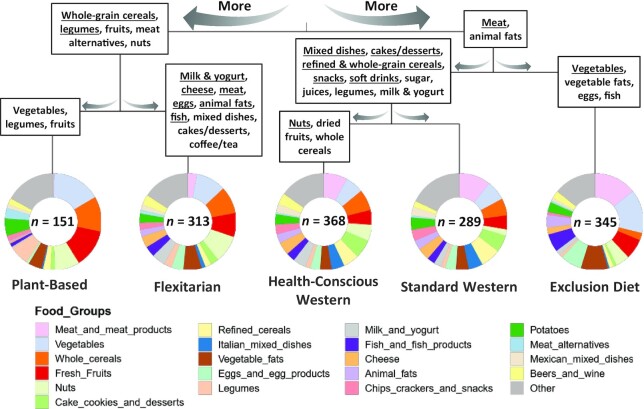
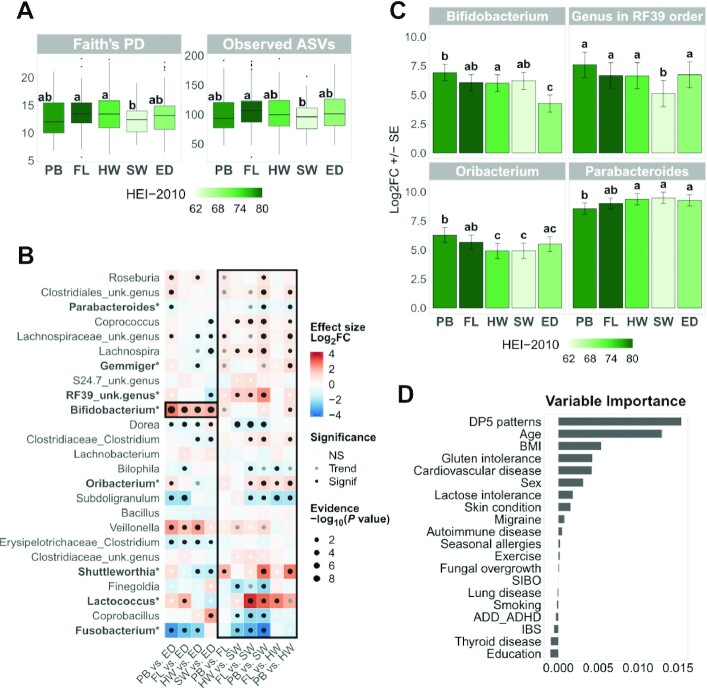
Results: Compared to individual features (e.g., fiber and protein), or to factors representing a reduced number of dietary features, 5 a posteriori dietary patterns based on food groups were best associated with gut microbiome beta diversity (P ≤ 0.0002). Two patterns followed Prudent-like diets-Plant-Based and Flexitarian-and exhibited the highest Healthy Eating Index 2010 (HEI-2010) scores. Two other patterns presented Western-like diets with a gradient in HEI-2010 scores. A fifth pattern consisted mostly of participants following an Exclusion diet (e.g., low carbohydrate). Notably, gut microbiome alpha diversity was significantly lower in the most Western pattern compared to the Flexitarian pattern (P ≤ 0.009), and the Exclusion diet pattern was associated with low relative abundance of Bifidobacterium (P ≤ 1.2 × 10⁻⁷), which was better explained by diet than health status.

Conclusions: We demonstrated that global-diet a posteriori patterns were more associated with gut microbiome variations than individual dietary features among adults in the United States. These results confirm that evaluating diet as a whole is important when studying the gut microbiome. It will also facilitate the design of more personalized dietary strategies in general populations.

Keywords: 16S rRNA gene sequencing; American Gut Project; Healthy Eating Index; alpha diversity; beta diversity; cohort study; dietary patterns; food frequency questionnaire; gut microbiome.


Figures

FIGURE 1
FIGURE 1
Summary of the exploration of dietary patterns and their associations with gut microbiome beta-diversity. (A) Population selection. Populations used for main analyses (dietary patterns and associations with microbiome) are surrounded by boxes. Some outliers were removed for 16S rRNA-based microbiome data (Supplemental Methods). No antibiotics were taken in the last year. No cases of diabetes, liver disease, or IBD were diagnosed by a medical practitioner. There were no declared cases of multiple sclerosis, Hashimoto's, Graves’, Behcet's, Lupus, hyperthyroidism, or chronic Lyme disease. Confounding variables were age, sex, and BMI. (B) Numbers of dietary patterns obtained with a priori or a posteriori approaches counting either diet groups or factors (61 in total). For dietary fibers, there are quartiles of quantity, type (soluble:insoluble) and combined quantity and type (quantity:type). For dietary proteins, there are quartiles of animal and vegetable proteins, as well as their ratio. The food groups analysis was based on data in kcal and focused on core diet groups: that is, participants with a probability ≥80% of belonging to his/her partition, referred to as DP5 patterns. The food items analysis was based on the presence/absence of data using the Jaccard distance. This image has been designed using resources from Flaticon.com made by Freepik, Good Ware, Eucalyp, DinosoftLabs, iconixar and surang. (C) The 16S rRNA-based gut microbiome beta-diversity analyses. Partial db-RDA models with diet groups/factors as explanatory variable and confounding variables (age, sex, and BMI) partialled out. We used permutation tests (9999 permutations). There was multiple testing adjustment by Benjamini-Hochberg on the global effects obtained with the 4 indices (diet groups) or on the global effects obtained with the 5 indices * k factors (factors). Evidence [–log10(P value)] cannot be higher than 4 due to the permutation scheme. The Fk factors are from the corresponding data set as described in Supplemental Tables 4–6. NS: P value ≥ 0.1; trend: 0.05 ≤ P value < 0.1; significance: P value < 0.05. Abbreviations: ait, Aitchison distance; bc, Bray-Curtis dissimilarity; db-RDA, distance-based redundancy analysis; DP5, 5 dietary patterns; Fk, factor number k; HEI-2010, Healthy Eating Index 2010; IBD, inflammatory bowel disease; MPED, MyPyramid Equivalents Database; NS, not significant; rRNA, ribosomal RNA; uUni, unweighted UniFrac distance; wUni, weighted UniFrac distance.
FIGURE 2
FIGURE 2
Contribution of food groups to DP5 patterns. Pie charts represent Dirichlet scaled contributions of food groups for each dietary pattern. Food groups are ordered by their contribution to the clustering. Patterns are grouped together using a hierarchical ascending clustering on standardized data. Food groups were mentioned in each branch if their Dirichlet contribution was higher in all left/right patterns compared with right/left patterns and if their Cliff's Delta effect size was medium (≥0.33; bold) or large (≥0.47; bold underlined). Cliff's Delta effect sizes were computed based on individual relative kcal intakes. n is the size of the pattern. Abbreviations: DP5, 5 dietary patterns.
FIGURE 3
FIGURE 3
Associations of DP5 patterns with gut microbiome. (A) Box plots for significant alpha-diversity indices. Plotted values are adjusted for age, sex, and BMI with a linear model. We performed Kruskal-Wallis tests with multiple testing adjustment by Benjamini-Hochberg on the global effects obtained with the 5 alpha diversity indices. If the global effect was significant (P value < 0.05), post hoc comparisons were performed using Mann-Whitney tests with a Benjamini-Hochberg adjustment for each alpha diversity index separately. Groups with the same letter are not significantly different (Pvalue ≥ 0.05). Boxes are colored by median HEI-2010 total score. (B) Heat map of 2 x 2 comparison results for significant genera. Genera are ordered from bottom to top by increasing abundance. Genera below the dotted grey line have mean relative abundances below 0.5% in the analyzed data set. Results for the Bifidobacterium genus and the Prudent/Western framework are highlighted in black boxes. Unknown genera are annotated at the lower available taxonomic level. DESeq2 (v1.28.1) models include pattern, age, sex, and BMI effects. The global pattern effect (likelihood ratio tests) was adjusted with the Benjamini-Hochberg procedure for multiple testing. If the global effect was significant (P value < 0.05), all 2 x 2 comparisons (Wald tests) were reported using a Benjamini-Hochberg adjustment for each genus separately. For example, for PB vs. ED, if the Log2FC is positive, then the genus' relative abundance is higher in the PB pattern. Genera in bold with a star were found in Songbird Top10 differentials for at least 50% of DESeq2 significant results (Supplemental Figure 6). NS: P value ≥ 0.1; trend: 0.05 ≤ P value < 0.1; and significance: P value < 0.05. (C) Bar plots for selected DESeq2 genera results. Log2FC ± SE values were estimated by a DESeq2 model with no intercept. Groups with the same letter are not significantly different (Pvalue ≥ 0.05). Bars are colored by the median HEI-2010 total score. (D) Variable importance in a random forest model for prediction of “low” or “high” Bifidobacterium status (see Supplemental Methods). Abbreviations: ADD, attention deficit disorder; ADHD, attention deficit hyperactivity disorder; ASV, amplicon sequence variant; DP5, 5 dietary patterns; ED, Exclusion diet; FL, Flexitarian diet; HEI-2010, Healthy Eating Index 2010; HW, Health-Conscious Western diet; IBS, irritable bowel syndrome; Log2FC, log2 fold change; NS, not significant; PB, Plant-Based diet; PD, phylogenetic diversity; SIBO, small intestinal bacterial overgrowth; SW, Standard Western diet; unk., unknown.

Comment in

References

    1. Sommer F, Bäckhed F. The gut microbiota—masters of host development and physiology. Nat Rev Microbiol. 2013;11(4):227–38. - PubMed
    1. Zinöcker MK, Lindseth IA. The Western diet–microbiome-host interaction and its role in metabolic disease. Nutrients. 2018;10:365. - PMC - PubMed
    1. Johnson AJ, Vangay P, Al-Ghalith GA, Hillmann BM, Ward TL, Shields-Cutler RR, Kim AD, Shmagel AK, Syed AN Personalized Microbiome Class Students, et al., Personalized Microbiome Class Students Daily sampling reveals personalized diet-microbiome associations in humans. Cell Host Microbe. 2019;25(6):789–802.e5.e5. - PubMed
    1. Hemler EC, Hu FB. Plant-based diets for personal, population, and planetary health. Adv Nutr. 2019;10(Suppl 4):S275–83. - PMC - PubMed
    1. US Department of Agriculture and US Department of Health and Human Service Dietary Guidelines for Americans, 2020–2025. 9th Edition [Internet]. 2020. Available from: https://www.dietaryguidelines.gov/resources/2020-2025-dietary-guidelines....

Publication types

Substances