. 2021 Nov 19;6(65):eabl9105.
doi: 10.1126/sciimmunol.abl9105. Epub 2021 Nov 19.

SARS-CoV-2 infection generates tissue-localized immunological memory in humans

Affiliations

SARS-CoV-2 infection generates tissue-localized immunological memory in humans

Maya M L Poon et al. Sci Immunol. .

Abstract

Adaptive immune responses to SARS-CoV-2 infection have been extensively characterized in blood; however, most functions of protective immunity must be accomplished in tissues. Here, we report from examination of SARS-CoV-2 seropositive organ donors (ages 10 to 74) that CD4+ T, CD8+ T, and B cell memory generated in response to infection is present in the bone marrow, spleen, lung, and multiple lymph nodes (LNs) for up to 6 months after infection. Lungs and lung-associated LNs were the most prevalent sites for SARS-CoV-2–specific memory T and B cells with significant correlations between circulating and tissue-resident memory T and B cells in all sites. We further identified SARS-CoV-2–specific germinal centers in the lung-associated LNs up to 6 months after infection. SARS-CoV-2–specific follicular helper T cells were also abundant in lung-associated LNs and lungs. Together, the results indicate local tissue coordination of cellular and humoral immune memory against SARS-CoV-2 for site-specific protection against future infectious challenges.


Conflict of interest statement

Competing interests: A.S. is a consultant for Gritstone, Flow Pharma, Merck, Epitogenesis, Gilead, and Avalia. S.C has consulted for Avalia, Roche and GSK. L.J.I. has filed for patent protection for various aspects of T cell epitope and vaccine design work. All remaining authors declare no competing interests.

Figures

Fig. 1.
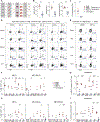
Fig. 1.. SARS-CoV-2-specific CD4+ and CD8+ T cells in blood and tissues of previously infected organ donors.
(A) SARS-CoV-2 seropositive donors and tissues used from each donor for this study. (B) Anti-SARS-CoV-2 antibody reactivities for seropositive and seronegative donors. Graphs show endpoint titers (ET) of IgG specific for SARS-CoV-2 Spike, RBD, and Nucleocapsid. (C) SARS-CoV-2 Spike pseudovirus (PSV) neutralizing titers for seropositive and seronegative donors. Serology statistical analyses were performed using Mann-Whitney U test. * p ≤ 0.05; ** p ≤ 0.01; *** p ≤ 0.001; **** p ≤ 0.0001. (D) Identification of SARS-CoV-2-specific CD4+ T cells using the activation-induced marker (AIM) assay. Mononuclear cells isolated from blood, bone marrow (BM), spleen, lung, and lung-associated lymph node (LLN) were stimulated with SARS-CoV-2 peptide pools (See Materials and Methods) and responding CD4+ T cells were identified based on induction of OX40, 4–1BB, and CD40L as shown in representative flow cytometry plots from D498 reactive to MP_CD4_S. SARS-CoV-2-specific CD4+ T cells were defined based on combined gates CD40L+4–1BB+ (left), OX40+4–1BB+ (middle), or CD40L+OX40+ (right) of total CD4+ T cells for each stimulation condition and tissue site (see Figure S1 for gating strategy). (E) AIM assay for detection of SARS-CoV-2-specific CD8+ T cells in blood, BM, lung, LLN, and gut-associated lymph node (GLN), showing induction of 4–1BB and CD25 in representative flow cytometry plots from D495 reactive to MP_CD4_S. AIM+ CD8 T cells were defined based on frequency 4–1BB+CD25+ from total CD8+ T cells for each stimulation condition and tissue site (see figure S1 for gating strategy). (F) SARS-CoV-2 epitope-specific CD4+T cells identified following stimulation with MP_S (left) and MP_CD4_R (right) peptide megapools (MPs) from indicated tissues sites of seropositive and seronegative donors. (G) Total SARS-CoV-2-specific CD4+ T cells in each site from individual donors based on responses to all epitopes. (H) SARS-CoV-2 epitope-specific CD8+ T cells identified following stimulation with MP_S (left), MP_CD8_A (middle), and MP_CD8_B (right) peptide MPs from indicated sites of seropositive and seronegative donors. (I) Total SARS-CoV-2-specific CD8+ T cells in each site from individual donors based on compiled responses to all epitopes. n=4 SARS-CoV-2 seropositive subjects (n=4 for blood, lung, LLN; n=3 for spleen and GLN; n=2 for BM). n=10 for seronegative subjects (n=4 for BM, LLN, and GLN; n=3 for blood, spleen, and lung). Statistical analysis was performed using one-way ANOVA, corrected for multiple comparisons by false discovery rate (FDR) using two-stage linear step-up procedure of Benjamini, Krieger, and Yekutieli. * q ≤ 0.05; ** q ≤ 0.01; *** q ≤ 0.001; **** q ≤ 0.0001. Datasets were log-transformed before statistical analysis. ET, endpoint titer; RBD, receptor-binding domain; PSV, pseudovirus; AIM, activation-induced marker; BM, bone marrow; LLN, lung-associated lymph node; GLN, gut-associated lymph node.
Fig. 2.
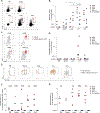
Fig. 2.. SARS-CoV-2-specific T cells are maintained as memory subsets in diverse tissues of seropositive donors.
(A) Subset phenotypes of total (grey contour) and SARS-CoV-2-specific (red dots) CD4+ (top row) and CD8+ (bottom row) T cells based on CD45RA and CCR7 expression (CD45RA+CCR7+; CD45RACCR7+, TCM; CD45RACCR7, TEM; CD45RA+CCR7, TEMRA) shown in representative flow cytometry plots. (B) T cell subset delineation of SARS-CoV-2-specific CD4+ T cells in blood and indicated tissues of seropositive organ donors. (C) T cell memory subset delineation of SARS-CoV-2-specific CD8+ T cells in blood and indicated tissues of seropositive organ donors. (D) Expression of tissue residency markers CD69 and CD103 by SARS-CoV-2-specific CD4+ T cells in indicated sites of seropositive donors. (E) Expression of tissue residency markers CD69 and CD103 by SARS-CoV-2-specific CD8+ T cells in indicated sites of seropositive donors. Memory subset differentiation and residency marker analysis was conducted on tissue sites for which number of SARS-CoV-2-specific T cells was ≥ 5 based on AIM assays. SARS-CoV-2-specific CD8+ T cells in the blood were not detected above this threshold. n=4 SARS-CoV-2 seropositive subjects (n=4 for blood, lung, LLN; n=3 for spleen and GLN; n=2 for BM). n=10 for seronegative subjects (n=4 for BM, LLN, and GLN; n=3 for blood, spleen, and lung). Statistical analysis was performed using one-way ANOVA, corrected for multiple comparisons by FDR using two-stage linear step-up procedure of Benjamini, Krieger, and Yekutieli. * q ≤ 0.05; ** q ≤ 0.01; *** q ≤ 0.001; **** q ≤ 0.0001. Datasets were log-transformed before statistical analysis. SARS-2, SARS-CoV-2; TCM, central memory T cell; TEM, effector memory T cell, TEMRA, terminally-differentiated effector T cell; Bld, blood; BM, bone marrow; SP, spleen; LLN, lung-associated lymph node; GLN, gut-associated lymph node.
Fig. 3.
Fig. 3.. Heterogeneity and tissue specificity of functional responses to SARS-CoV-2 epitopes.
(A) Profiles of immune mediators produced for multiple tissue sites within SARS-CoV-2 seropositive donors following stimulation with peptide MPs MP_S (S), MP_CD4_R (R), MP_CD8_A (A), and MP_CD8_B (B), shown as a heatmap. The color intensity of each cell represents DMSO-background-subtracted analyte concentration (max absolute scaled per row) within each donor (See Materials and Methods). (B) Concentration of indicated immune mediators measured within supernatants from in vitro stimulations of blood, BM, spleen, lung, LLN, and GLN mononuclear cells with SARS-CoV-2 MPs for which SARS-CoV-2-specific T cells were identified based on DMSO-background-subtracted frequencies of AIM+ CD4+ and CD8+ T cells. Statistical analysis was performed using one-way ANOVA, corrected for multiple comparisons by Tukey’s multiple comparisons test. *, p ≤ 0.05; **, p ≤ 0.01; ***, p ≤ 0.001, ****, p ≤ 0.0001. (C) Immune mediator milieu for each site. Heatmap showing log (Mean x + 1) pg/mL levels of immune mediators averaged across donors and stimulation conditions for each tissue site, derived from samples for which significant frequencies of SARS-CoV-2-specific T cells were identified above background in Figure 1. BL, blood; BM, bone marrow; SP, spleen; LG, lung; LLN, lung-associated lymph node; GLN, gut-associated lymph node.
Fig. 4.
Fig. 4.. SARS-CoV-2-specific memory B cells in tissues.
(A) Representative flow cytometry plots showing staining patterns of probes for SARS-CoV-2 Spike (upper panel) and RBD (lower panel) on memory B cells, defined here as CD19+CD20+IgD non-GC B cells (see Figure S5A for gating). Memory B cells in BM, spleen, lung, LLN, and GLN from a SARS-CoV-2 Spike seropositive subject (D498) and memory B cells in lung from a seronegative subject (D340). Percentages are indicated. (B) SARS-CoV-2-specific memory B cells in tissues. Graph shows frequency of memory B cells specific to Spike and/or RBD (S/RBD) in indicated sites expressed as a percentage of CD19+CD20+ total B cells. (C) Fraction of SARS-CoV-2 S/RBD-specific memory B cells that belong to indicated Ig isotypes. (D) Frequency (percentage) of IgG+ memory B cells that are specific to S/RBD. (E) Representative flow cytometry plots showing CD69 expression on memory B cells specific to S/RBD. Percentages are indicated. (F) Frequency (percentage) of SARS-CoV-2 S/RBD-specific memory B cells that are CD69+. n=4 Seropositive subjects (n=4 for lung, LLN, GLN; n = 3 for spleen; n = 2 for BM). n=7 Seronegative donors (n = 4 for lung, spleen; n = 5 for LLN, GLN, BM). Statistical analysis was performed using one-way ANOVA, corrected for multiple comparisons by FDR using two-stage linear step-up procedure of Benjamini, Krieger, and Yekutieli. * q ≤ 0.05; ** q ≤ 0.01; *** q ≤ 0.001; **** q ≤ 0.0001. For (B) and (D), datasets were log-transformed before statistical analysis. S/RBD, SARS-CoV-2 Spike and/or RBD; RBD, receptor-binding domain; BM, bone marrow; LLN, lung-associated lymph node; GLN, gut-associated lymph node.
Fig. 5.
Fig. 5.. SARS-CoV-2-specific germinal center B cells and follicular helper T cells in seropositive donors.
(A) Bcl6+Ki67+ germinal center (GC) B cells in different tissues, shown in representative flow cytometry plots from seropositive donor D498. See Figure S5 for gating. (B) Frequency of Bcl6+Ki67+ GC B cells in tissue sites of seropositive and seronegative donors expressed as a percentage of total CD19+CD20+ total B cells. (C) GC B cells in the LLN for each donor shown in representative flow cytometry plots. GC B cells specific to S/RBD are depicted in red. (D) Frequency of S/RBD-specific GC B cells as a percentage of total B cells. (E) TFH phenotype and frequency among NN CD4+ T cells per tissue as depicted by the rectangle gate, shown in representative flow cytometry plots from seropositive donor D498 (lung, LLN, spleen, BM) and D495 (GLN); see Materials and Methods for gating strategy. SARS-CoV-2-specific NN CD4+ T cells are highlighted in orange. (F) Frequency of CXCR5+PD-1+ TFH cells per tissue as percentage of SARS-CoV-2-specific CD4+ T cells. (G) Frequency of SARS-CoV-2-specific TFH cells per tissue as percentage of total NN CD4+ T cells. Statistical analysis was performed on log-transformed datasets using one-way ANOVA, corrected for multiple comparisons by FDR using two-stage linear step-up procedure of Benjamini, Krieger, and Yekutieli. * q ≤ 0.05, ** q ≤ 0.01; **** q ≤ 0.0001. SARS-2, SARS-CoV-2; S/RBD, SARS-CoV-2 Spike and/or RBD; GC, germinal center; BM, bone marrow; LLN, lung-associated lymph node; GLN, gut-associated lymph node; NN, non-naïve; Follicular helper T cell, TFH.
Fig. 6.
Fig. 6.. SARS-CoV-2-specific immune memory relationships across organs.
(A) Correlation between SARS-CoV-2 Spike-specific CD4+ T cells as frequency of total CD4+ T cells and Spike-specific CD8+ T cells as frequency of total CD8+ T cells. (B) Correlation between the frequency of SARS-CoV-2-specific CD4+ T cells and SARS-CoV-2 S/RBD-specific memory B cells. (C) Correlation between SARS-CoV-2-specific CD4+ T cells and IgG+ SARS-CoV-2 S/RBD-specific memory B cells. (D) Correlation between SARS-CoV-2-specific CD8+ T cells and SARS-CoV-2 S/RBD-specific memory B cells within lymphoid tissues. (E) Correlation between SARS-CoV-2-specific CD69+CD103+ CD8+ TRM cells and CD69+ SARS-CoV-2 S/RBD-specific BRM. (F) Correlation between SARS-CoV-2-specific PD-1+CXCR5+ TFH cells as frequency of NN CD4+ T cells and SARS-CoV-2 S/RBD-specific memory B cells as frequency of total memory B cells. (G) Correlogram of SARS-CoV-2-specific lung and LLN lymphocyte populations. Pearson R coefficients are shown from blue (−1.0) to red (1.0); R values are indicated by color and circle size. SARS-CoV-2-specific lymphocyte frequencies are depicted as a percentage of the parent population (%) or as counts per million PBMCs (/M); SARS-CoV-2-specific TFH cells are a percentage of total NN CD4+ T cells. Statistical analysis was performed on datasets using Pearson correlation. *, p ≤ 0.05; **, p ≤ 0.01; ***, p ≤ 0.001. SARS-2, SARS-CoV-2; S/RBD, SARS-CoV-2 Spike and/or RBD; BM, bone marrow; LLN, lung-associated lymph node; GLN, gut-associated lymph node; TFH, follicular helper T cell; GCB, germinal center B cell; MB, memory B cell; TRM, CD69+CD103+ resident memory T cell; BRM, CD69+ resident memory B cell; S+, Spike-protein-specific; S2+, SARS-CoV-2-specific.

References

    1. Dan JM, Mateus J, Kato Y, Hastie KM, Yu ED, Faliti CE, Grifoni A, Ramirez SI, Haupt S, Frazier A, Nakao C, Rayaprolu V, Rawlings SA, Peters B, Krammer F, Simon V, Saphire EO, Smith DM, Weiskopf D, Sette A, Crotty S, Immunological memory to SARS-CoV-2 assessed for up to 8 months after infection. Science 371, (2021). - PMC - PubMed
    1. Grifoni A, Weiskopf D, Ramirez SI, Mateus J, Dan JM, Moderbacher CR, Rawlings SA, Sutherland A, Premkumar L, Jadi RS, Marrama D, de Silva AM, Frazier A, Carlin AF, Greenbaum JA, Peters B, Krammer F, Smith DM, Crotty S, Sette A, Targets of T Cell Responses to SARS-CoV-2 Coronavirus in Humans with COVID-19 Disease and Unexposed Individuals. Cell 181, 1489–1501 e1415 (2020). - PMC - PubMed
    1. Gaebler C, Wang Z, Lorenzi JCC, Muecksch F, Finkin S, Tokuyama M, Cho A, Jankovic M, Schaefer-Babajew D, Oliveira TY, Cipolla M, Viant C, Barnes CO, Bram Y, Breton G, Hagglof T, Mendoza P, Hurley A, Turroja M, Gordon K, Millard KG, Ramos V, Schmidt F, Weisblum Y, Jha D, Tankelevich M, Martinez-Delgado G, Yee J, Patel R, Dizon J, Unson-O’Brien C, Shimeliovich I, Robbiani DF, Zhao Z, Gazumyan A, Schwartz RE, Hatziioannou T, Bjorkman PJ, Mehandru S, Bieniasz PD, Caskey M, Nussenzweig MC, Evolution of antibody immunity to SARS-CoV-2. Nature, (2021). - PMC - PubMed
    1. Wang Z, Muecksch F, Schaefer-Babajew D, Finkin S, Viant C, Gaebler C, Hoffmann HH, Barnes CO, Cipolla M, Ramos V, Oliveira TY, Cho A, Schmidt F, Da Silva J, Bednarski E, Aguado L, Yee J, Daga M, Turroja M, Millard KG, Jankovic M, Gazumyan A, Zhao Z, Rice CM, Bieniasz PD, Caskey M, Hatziioannou T, Nussenzweig MC, Naturally enhanced neutralizing breadth against SARS-CoV-2 one year after infection. Nature 595, 426–431 (2021). - PMC - PubMed
    1. Rodda LB, Netland J, Shehata L, Pruner KB, Morawski PA, Thouvenel CD, Takehara KK, Eggenberger J, Hemann EA, Waterman HR, Fahning ML, Chen Y, Hale M, Rathe J, Stokes C, Wrenn S, Fiala B, Carter L, Hamerman JA, King NP, Gale M Jr., Campbell DJ, Rawlings DJ, Pepper M, Functional SARS-CoV-2-Specific Immune Memory Persists after Mild COVID-19. Cell 184, 169–183 e117 (2021). - PMC - PubMed

Publication types

Substances