. 2021 Oct 8;374(6564):201-206.
doi: 10.1126/science.abi7852. Epub 2021 Oct 7.

Population-specific neuromodulation prolongs therapeutic benefits of deep brain stimulation

Affiliations

Population-specific neuromodulation prolongs therapeutic benefits of deep brain stimulation

Teresa A Spix et al. Science. .

Abstract

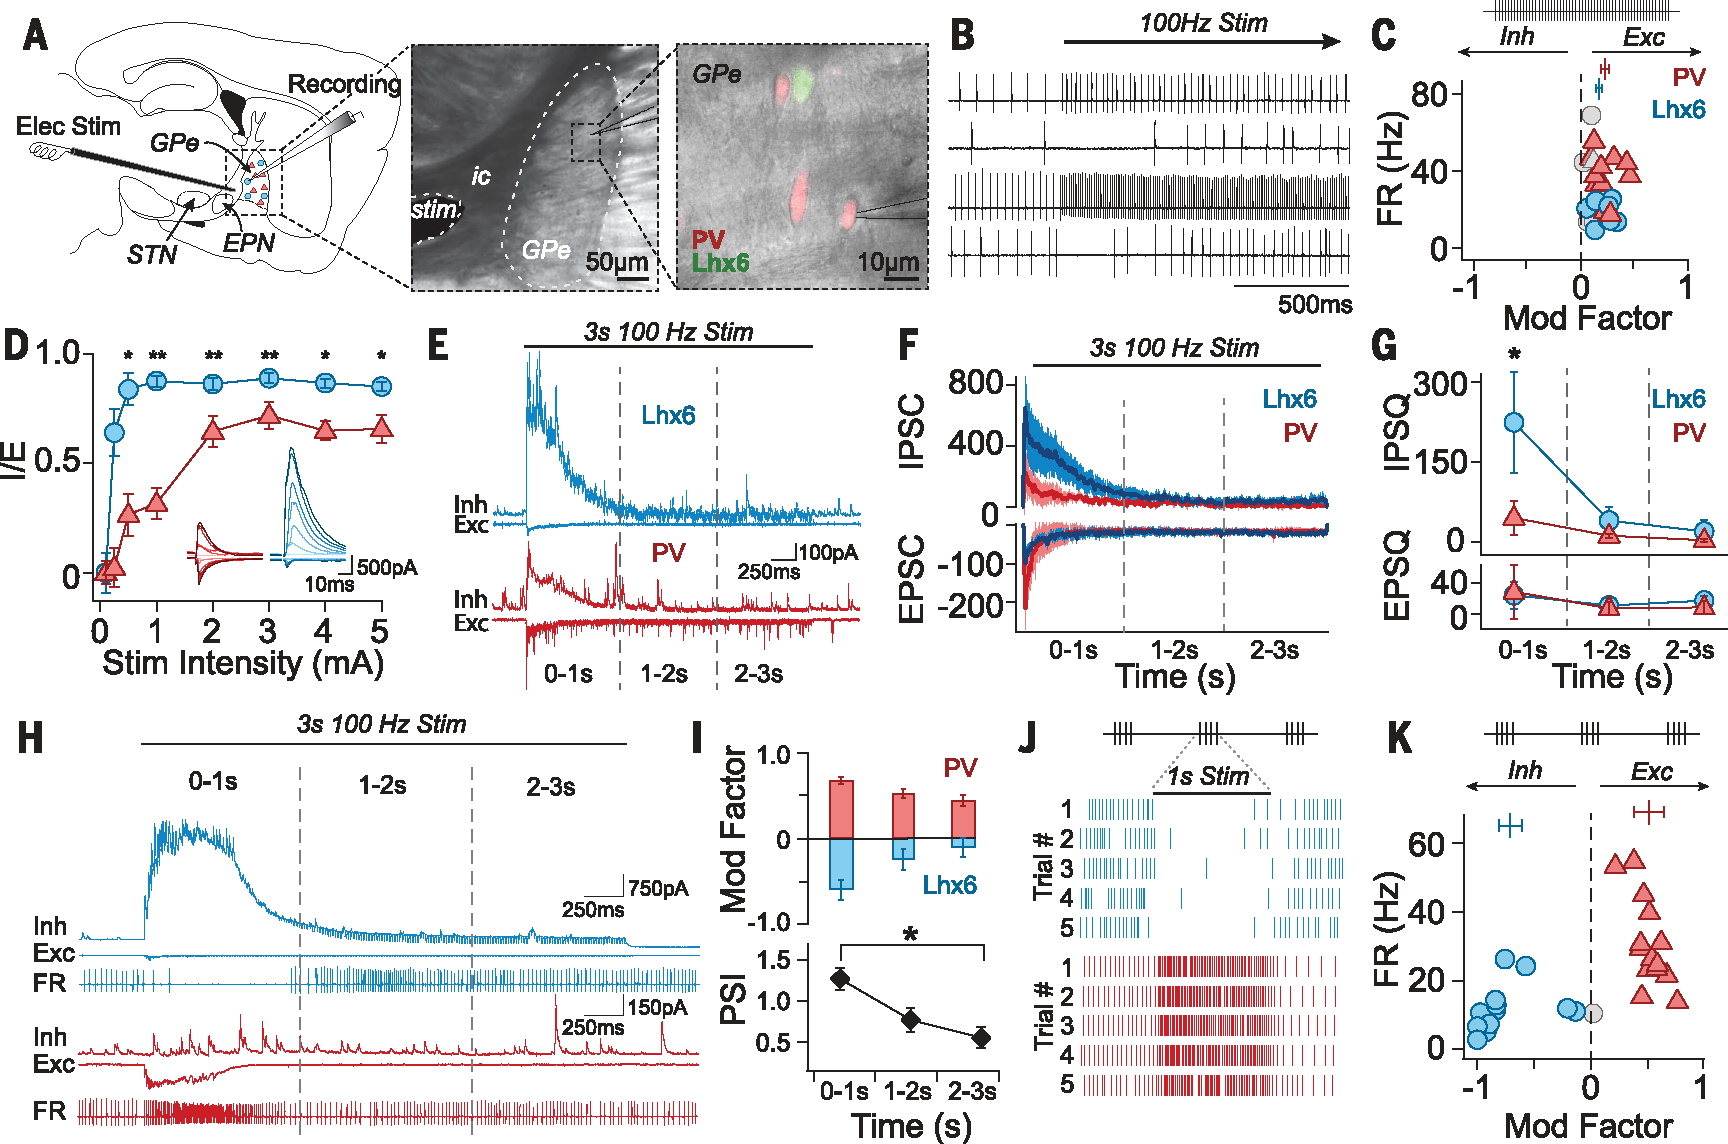
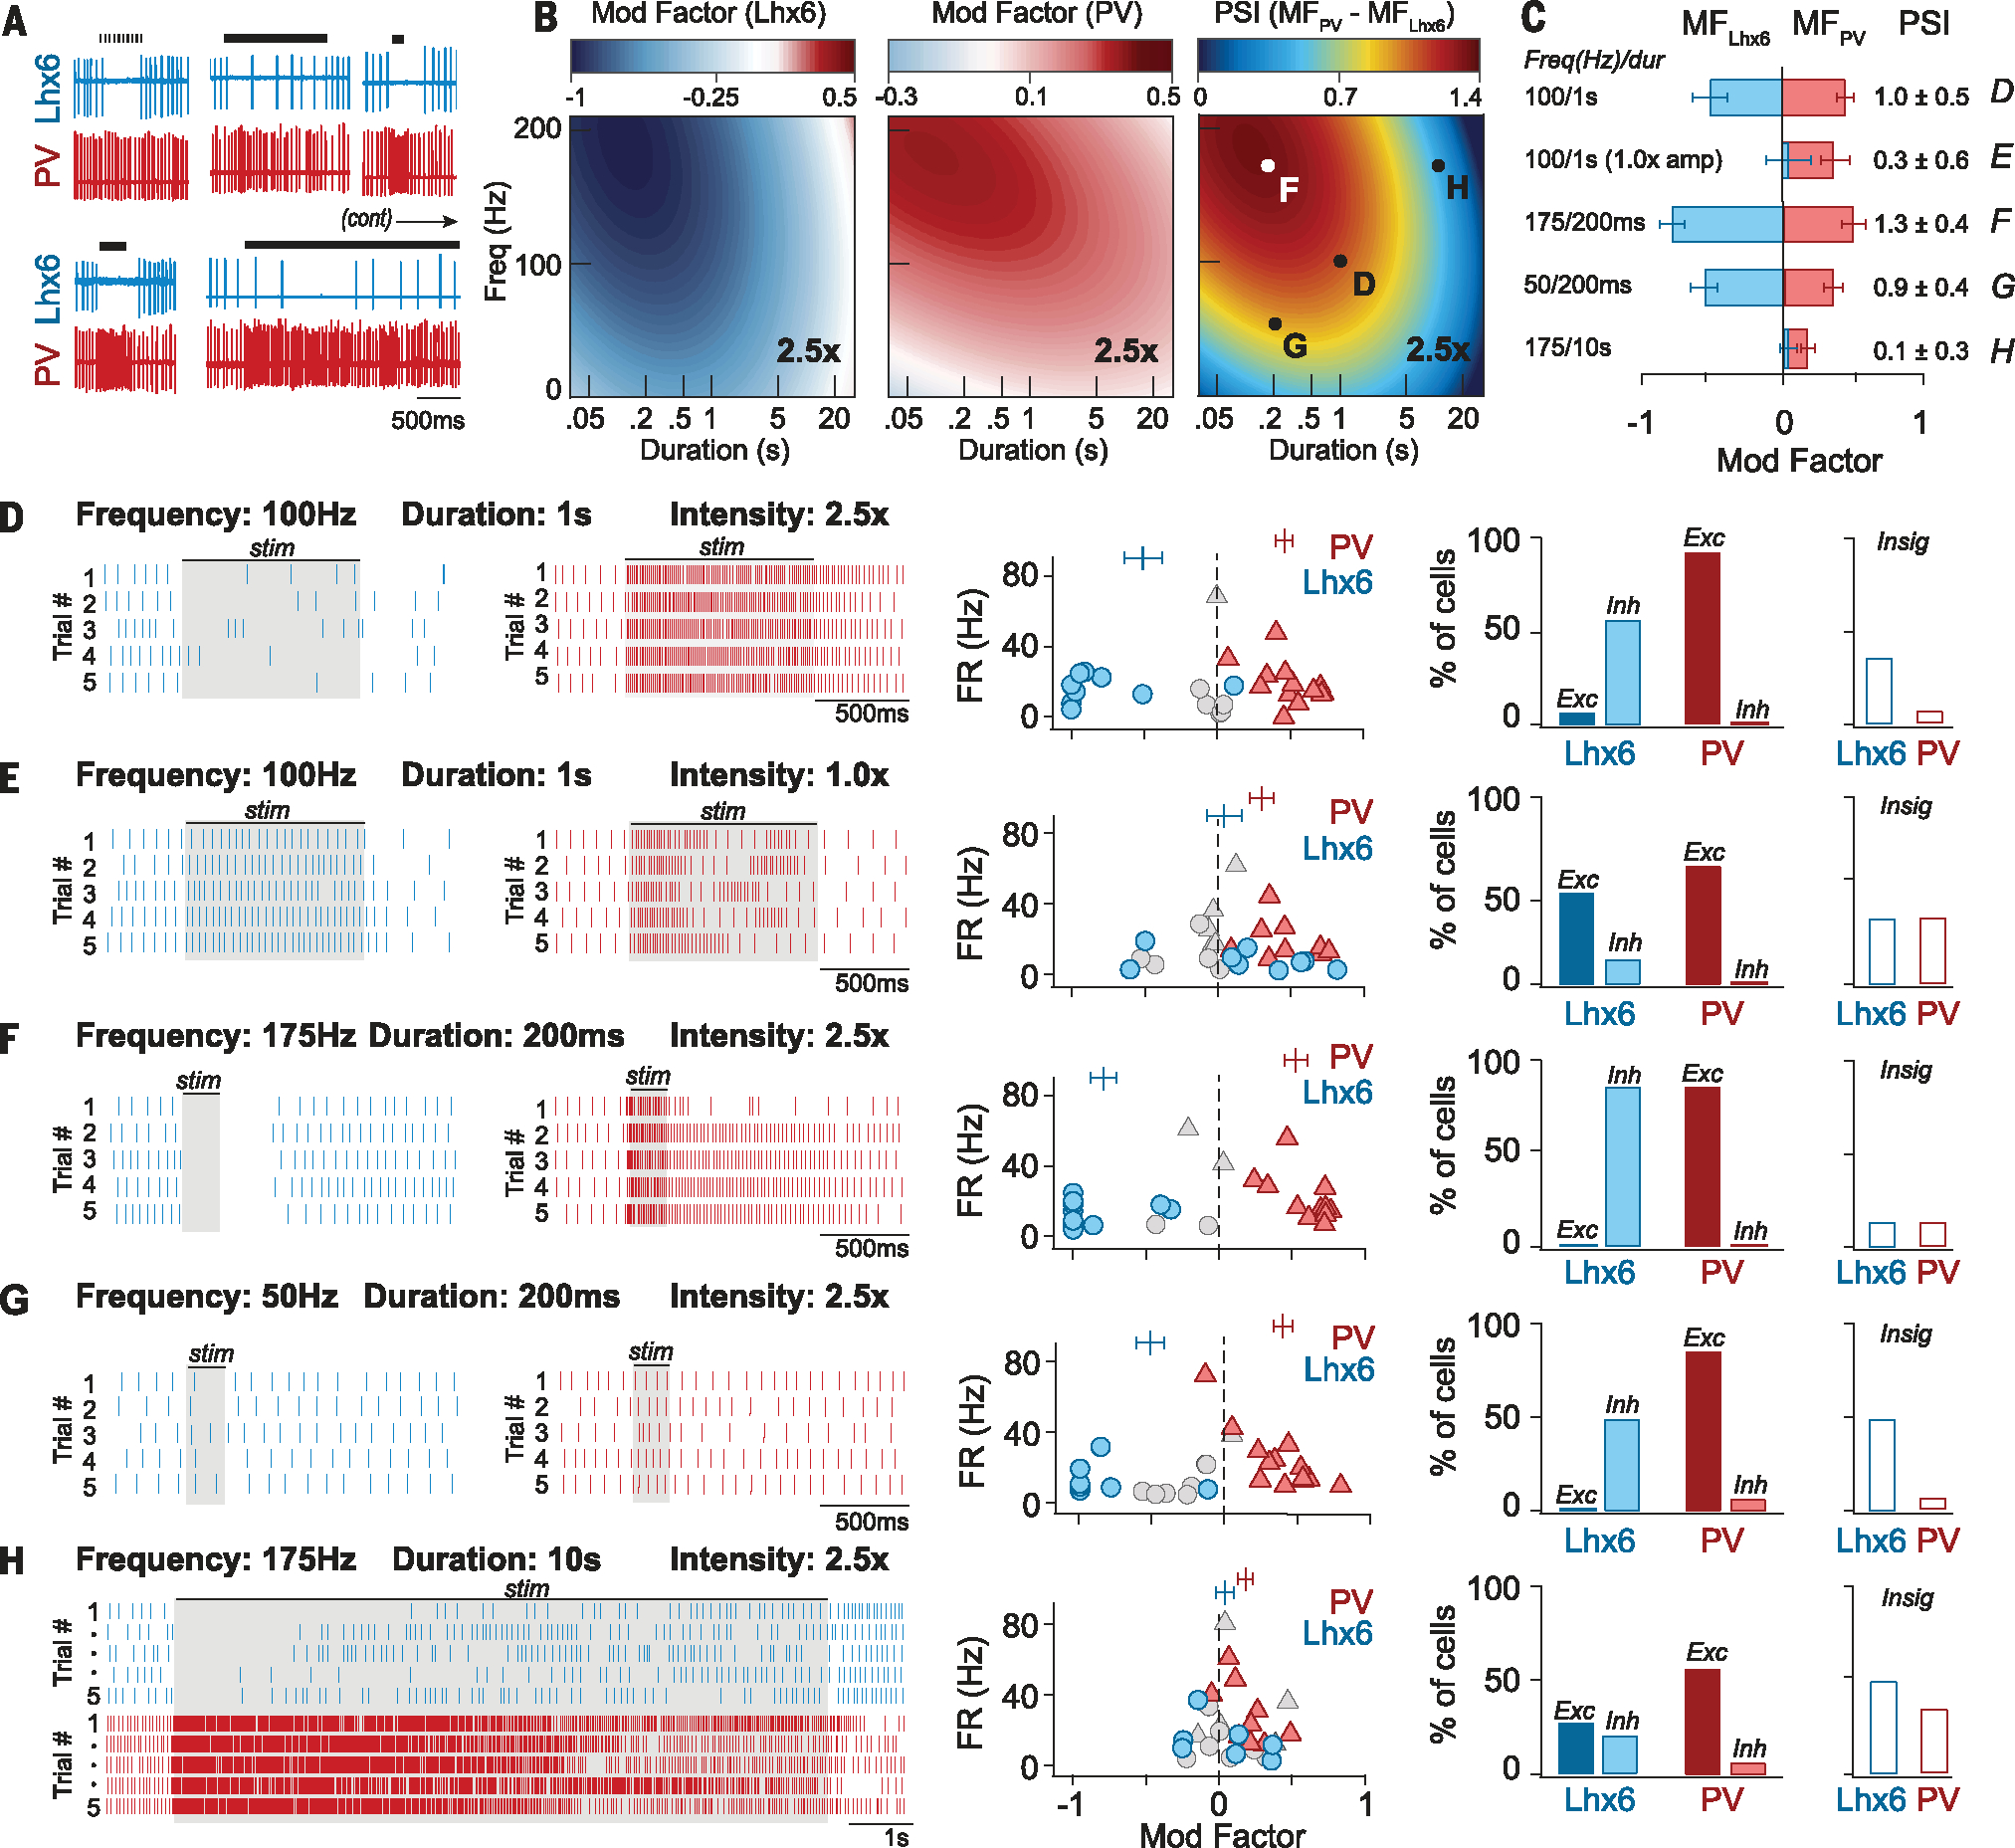
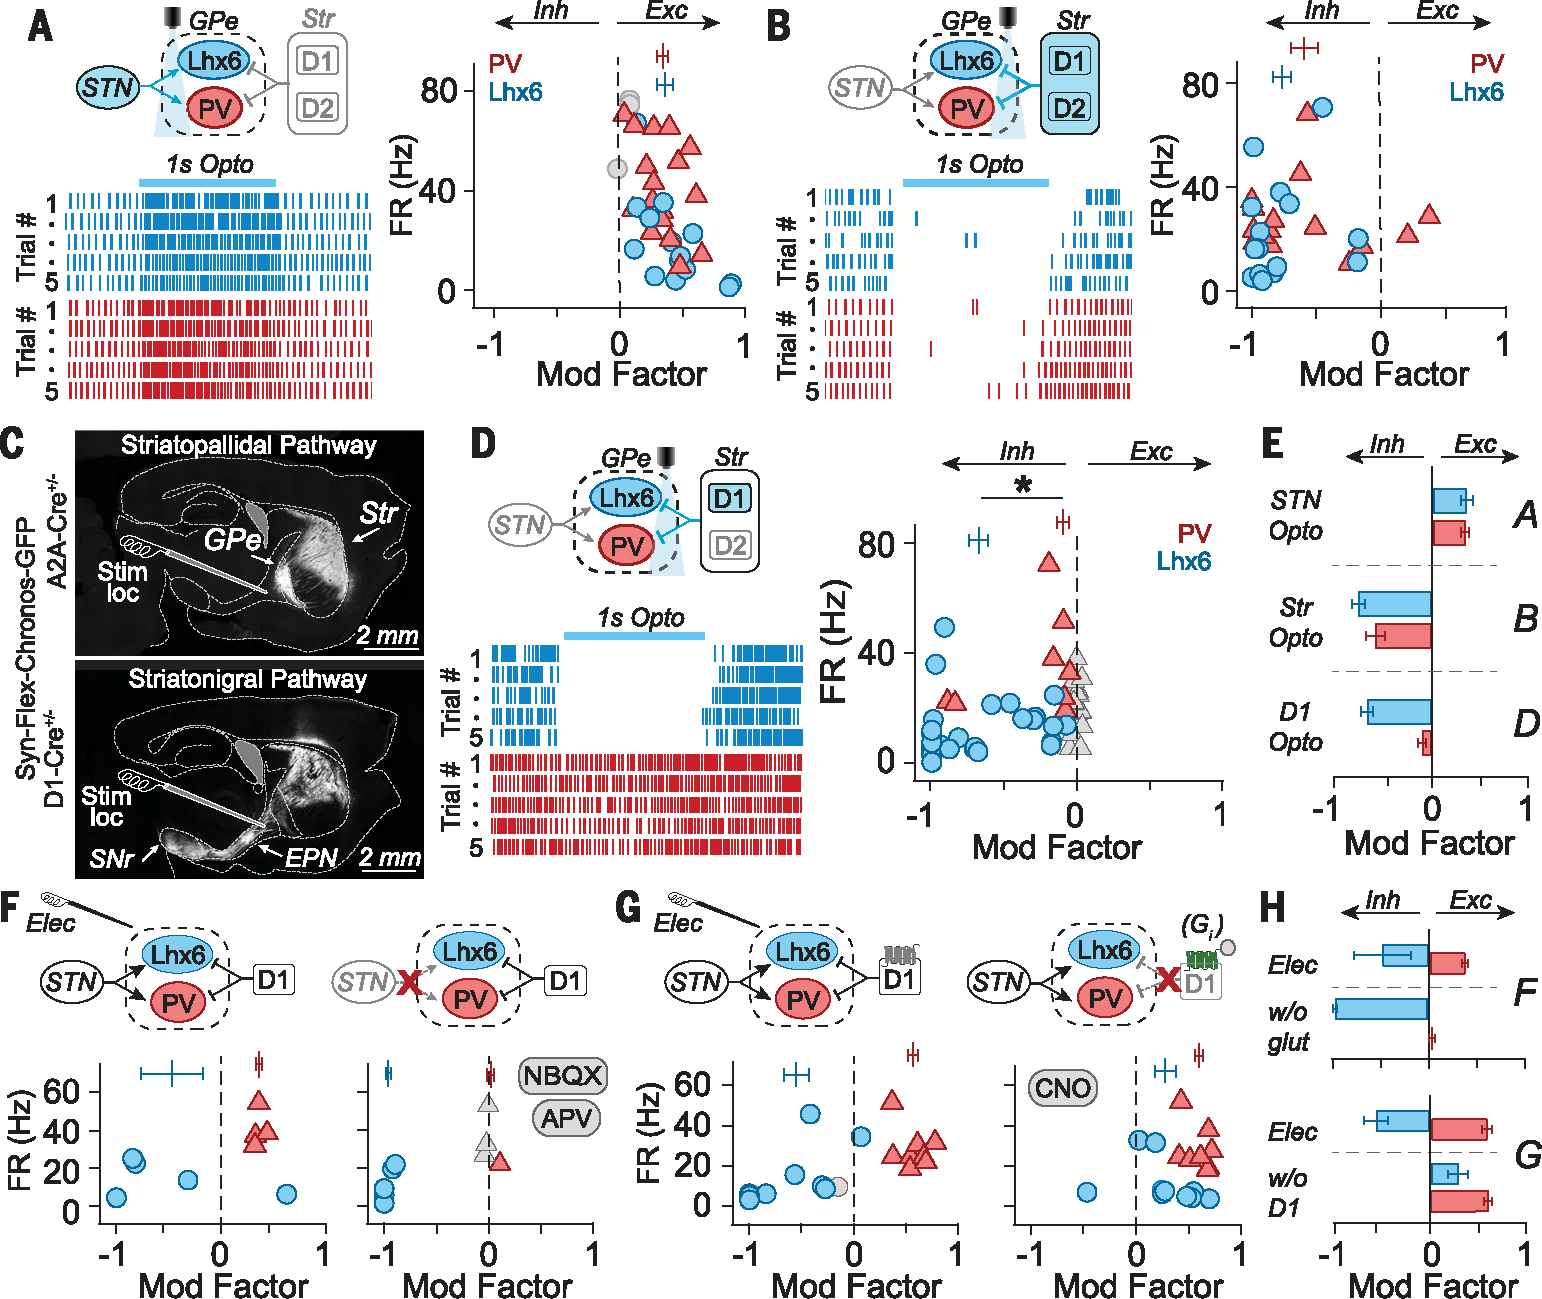
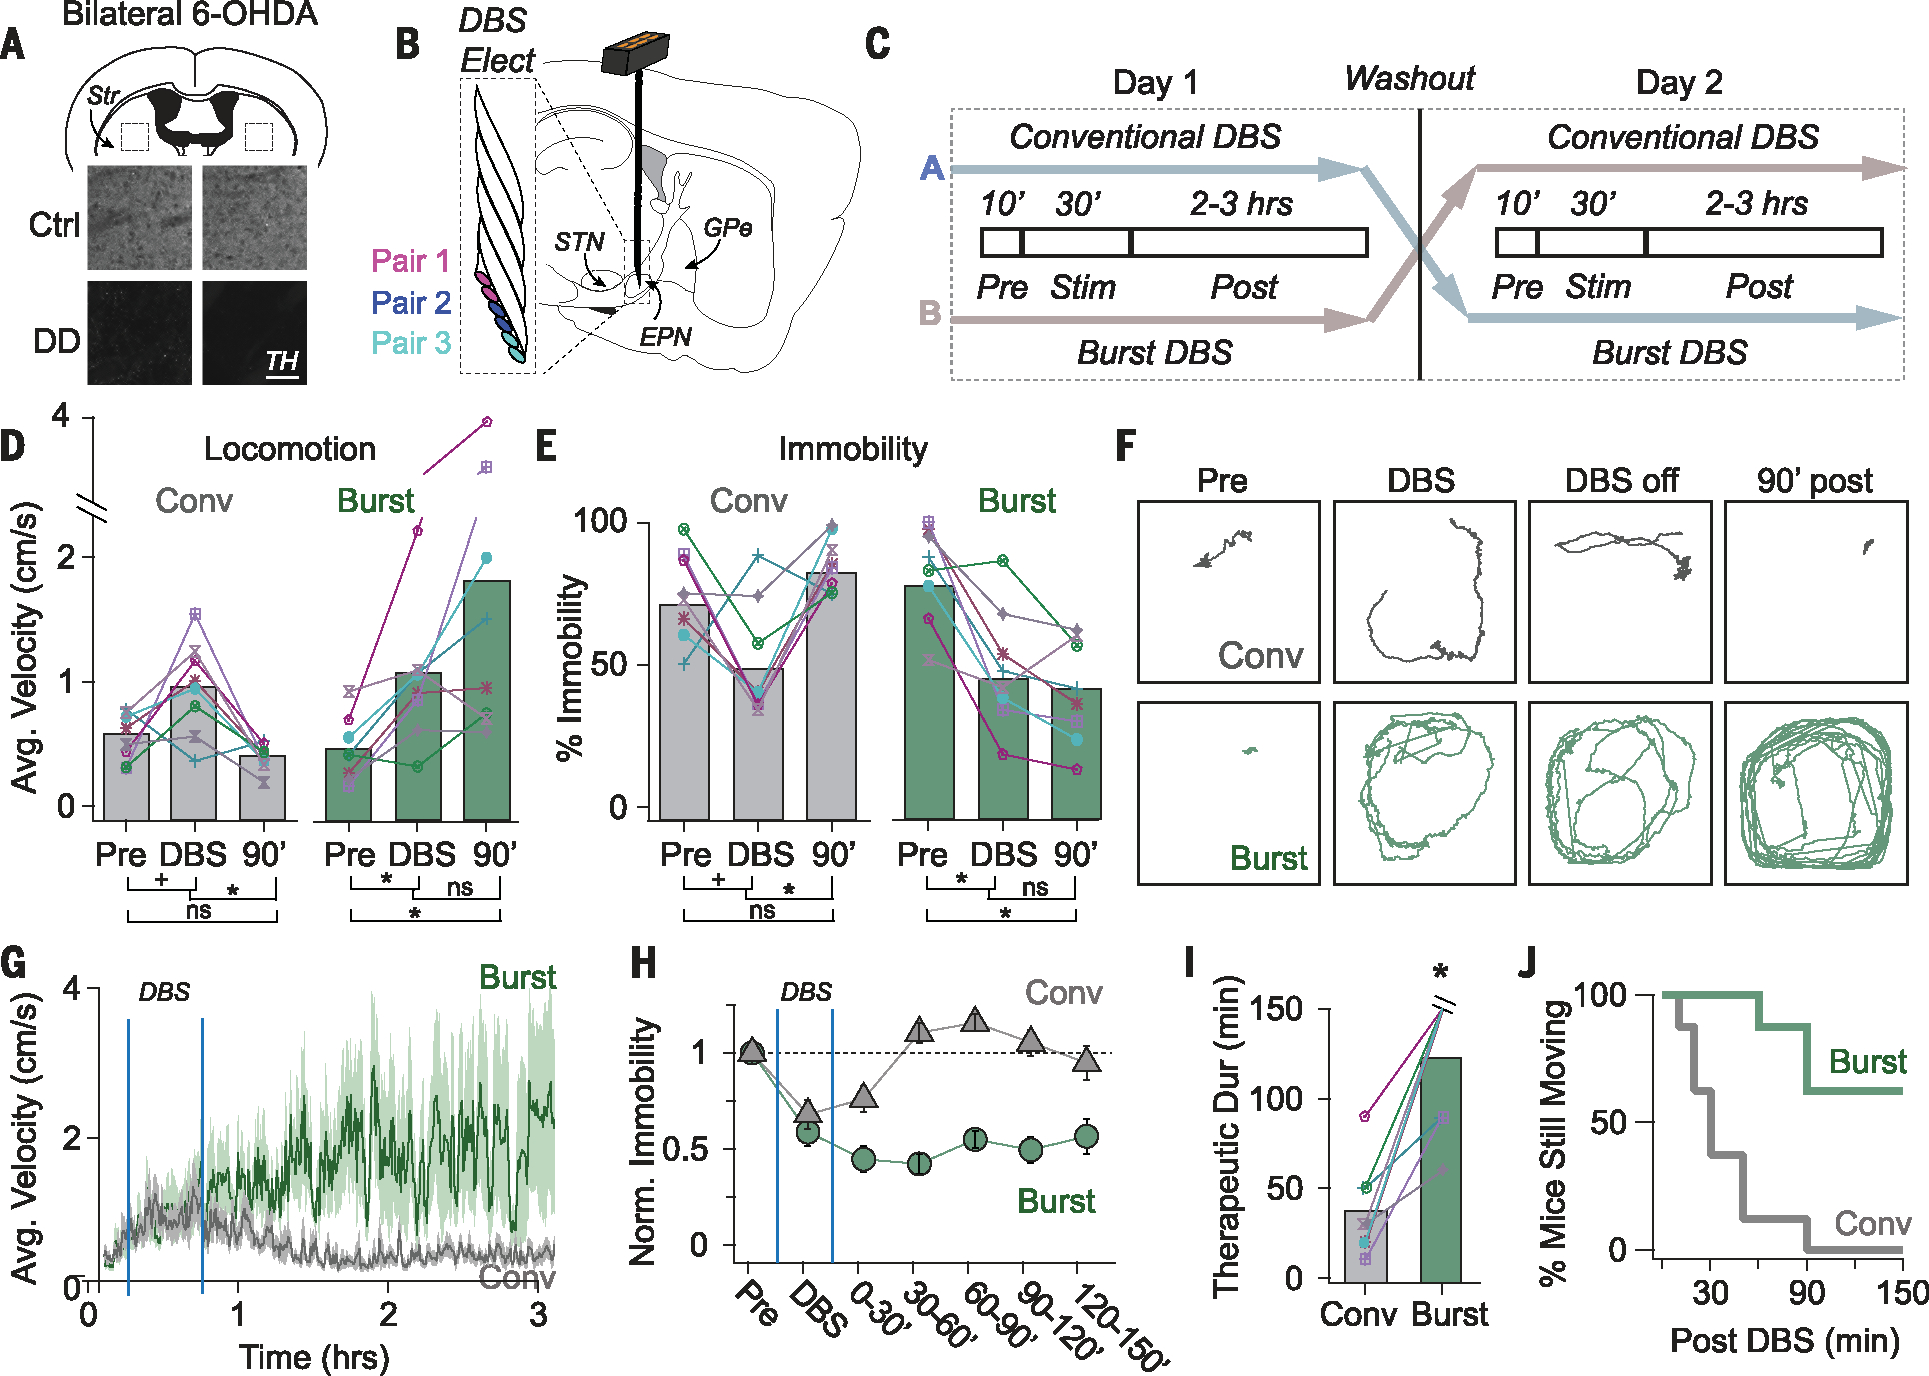
Symptoms of neurological diseases emerge through the dysfunction of neural circuits whose diffuse and intertwined architectures pose serious challenges for delivering therapies. Deep brain stimulation (DBS) improves Parkinson’s disease symptoms acutely but does not differentiate between neuronal circuits, and its effects decay rapidly if stimulation is discontinued. Recent findings suggest that optogenetic manipulation of distinct neuronal subpopulations in the external globus pallidus (GPe) provides long-lasting therapeutic effects in dopamine-depleted (DD) mice. We used synaptic differences to excite parvalbumin-expressing GPe neurons and inhibit lim-homeobox-6–expressing GPe neurons simultaneously using brief bursts of electrical stimulation. In DD mice, circuit-inspired DBS provided long-lasting therapeutic benefits that far exceeded those induced by conventional DBS, extending several hours after stimulation. These results establish the feasibility of transforming knowledge of circuit architecture into translatable therapeutic approaches.


Conflict of interest statement

Competing interests: The authors declare that they have no competing interests.

Figures

Fig. 1.
Fig. 1.. Bursts of stimulation segregate the firing responses of PV-GPe and Lhx6-GPe neurons.
(A) Experimental configuration and fluorescent identification of GPe subpopulations (ic, internal capsule). (B) Extracellular traces during stimulation (100 Hz for 30 s) after artifact removal. (C) Stimulation at 100 Hz for 30 s modestly excited both populations; this was quantified as “modulation factor” (MF) of the firing rate (FR) for each neuron: FRstimFRbaseline/FRstim+FRbaseline (bars: MFLhx6 = 0.16 ± 0.11; MFPV = 0.22 ± 0.12; Mann-Whitney (MWU) P = 0.29; 12 pairs of neurons; six mice, error bars: SEM). Colored symbols indicate neurons significantly modulated during stimulation (paired t test, P < 0.05), and gray symbols indicate neurons not significantly modified. (D) Ratios of postsynaptic currents for inhibition (IPSC) and excitation (EPSC) were calculated with peak current amplitudes as [(IPSC)/(IPSC + EPSC)], showing that Lhx6-GPe neurons receive more inhibition than PV-GPe neurons [Kruskal-Wallis test (KW), χ2(7) = 57.4, P < 0.00001, post hoc pairwise MWU, *P < 0.05, **P < 0.001; 15 pairs; nine mice)]. Insets show currents from representative neurons. (E and F) Rapid depression of synaptic currents during 100-Hz stimulation (1 mA), from representative neurons (E) and across the population (F) (10 pairs; four mice; medians, error bars: SEM). (G) Synaptic charges [inhibitory postsynaptic charge (IPSQ) and excitatory postsynaptic charge (EPSQ)] transferred during the first, second, and third seconds of stimulation. IPSQ was larger in Lhx6-GPe neurons than in PV-GPe neurons during the initial second of stimulation (IPSQLhx6 = 284 ± 300 pC, IPSQPV = 98± 103 pC, MWU, *P = 0.023) (10 pairs; four mice). (H) Three-part recordings with 3 s of 100-Hz stimulation. (Bottom) Extracellular recording traces. (Middle and top) Whole-cell recordings of EPSCs (Exc, middle, Vhold = −70 mV), and IPSCs (Inh, top, Vhold =0 mV) (I). (Top) MF by cell type in 1 s time bins. (Bottom) Modulation was most segregated in the initial second of stimulation (PSI = MFPV − MFLhx6, see supplementary methods) [PSI0–1s = 1.27 ± 0.49; PSI1–2s = 0.77± 0.54; PSI2–3s = 0.55 ± 0.49; KW, χ2(2) = 12.0, *P = 0.003; 14 pairs; three mice]. (J) Raster plots of extracellular modulation by 1 s bursts of stimulation (100 Hz, 1 mA, 30 s intertrial interval). (K) PV-GPe neurons are excited whereas Lhx6-GPe neurons are inhibited (MFPV = 0.5 ± 0.1; MFLhx6 = −0.7 ± 0.3; 14 pairs; three mice).
Fig. 2.
Fig. 2.. Stimulus optimization with a machine learning approach accurately predicts burst designs that achieve population-specific neuromodulation in the GPe using electrical stimulation.
(A) Samples of neural response data used to train models (supplementary methods). (B) Surface plots (2.5× intensity) showing predicted FR responses of Lhx6-GPe (MFLhx6, left) and PV-GPe (MFPV, middle) populations across a range of stimulus parameters. Predicted increases in FR are shown in red, and predicted decreases in FR are shown in blue. (Right) Surface plot showing the degree to which stimulus parameters are predicted to segregate the responses of PV-GPe and Lhx6-GPe populations (PSI: red, more segregation; blue, less segregation). Lettered points indicate burst combinations selected for experimental validation [(D) to (G)]. (C) Experimentally measured responses of PV-GPe and Lhx6-GPe populations to burst protocols developed using our model (B). The degree to which burst designs segregated the responses of PV-GPe and Lhx6-GPe neurons (PSI) is shown to the right, with letters on right referencing matching panel letters. Error bars, SEM. (D to H) Experimental validation of model predictions. (Left) Rasters of extracellularly recorded FR from Lhx6-GPe (blue) and PV-GPe (red) neurons responding to burst designs drawn from regions of parameter space indicated in (B). Shaded boxes denote the time bin used to calculate modulation factors. (Middle) Modulation factors for each neuron (averaged across five trials), plotted against its baseline firing rate (14 pairs of neurons; four mice). Gray symbols, neurons in which firing rate was not significantly modified from baseline (P > 0.05, paired t test, FRbaseline versus FRstim, trials 1 to 5). Vertical markers show average MFLhx6 and MFPV, error bars: SEM. (Right) Bar graphs indicating the percentage of Lhx6-GPe and PV-GPe neurons that were excited (Exc), inhibited (Inh), or had no significant change in firing rate (Insig) during stimulation.
Fig. 3.
Fig. 3.. Population-specific neuromodulation in the GPe is driven by convergent excitation from the STN and inhibition from D1-SPNs.
(A) (Left) Schematic and rasters from two representative GPe neurons during optogenetic stimulation of STN fibers (100 Hz for 1 s). (Right) Modulation factors (MFs) for individual neurons (symbols) and populations (vertical bars), showing that PV-GPe and Lhx6-GPe neurons are similarly excited (MFLhx6 = 0.36 ± 0.27, MFPV = 0.34 ± 0.17; MWU P = 0.976; 17 pairs of neurons; three mice). (B) (Left) Schematic and rasters from two neurons during striatal fiber stimulation (100 Hz for 1 s). (Right) MFs show that both PV-GPe and Lhx6-GPe neurons are similarly inhibited by striatal fiber stimulation (MFLhx6 = −0.77 ± 0.29, MFPV: −0.59 ± 0.41; MWU P = 0.25; 16 pairs; two mice). (C) (Top) Fluorescent image of striatopallidal pathway. (Bottom) Fluorescent image of striatonigral pathway. Typical placement of the stimulating electrode is shown for reference. (D) (Left) Schematic and rasters from two neurons during D1-SPN striatal fiber stimulation. (Right) MFs show that Lhx6-GPe neurons are preferentially inhibited (MFLhx6 = −0.68 ± 0.34; MFPV = −0.1 ± 0.23; MWU *P < 0.00001; 27 pairs; four mice). (E) Summary of MFLhx6 (blue) and MFPV (red) for experiments A to D; error bars: SEM. (F) MFs in response to electrical stimulation before (left) and after (right) application of 10 mM NBQX/50 mM APV. Excitation of PV-GPe neurons was blocked (MFCtrl: 0.36 ± 0.05, MFNBQX/APV: 0.01 ± 0.07, paired t test, P = 0.0001), but not Lhx6-GPe inhibition (MFCtrl: −0.47 ± 0.66, MFNBQX/APV: −0.96 ± 0.05, paired t test, P = 0.18) (5 Lhx6-GPe neurons, 4 PV-GPe neurons; two mice). (G) MFs in response to electrical stimulation before (left) and after (right) chemogenetic inhibition of D1-SPN fibers [AAV2-hsyn-DIO-hM4D(Gi)-mCherry + CNO, see methods]. Inhibition of Lhx6-GPe neurons was blocked (MFpre = −0.54 ± 0.39, MFCNO = 0.28 ± 0.33, paired t test, P = 0.003), but excitation of PV-GPe neurons was not (MFpre = 0.57 ± 0.15, MFCNO = 0.59 ± 0.13, paired t test, P = 0.7) (n = 10 Lhx6-GPe neurons, n= 8 PV-GPe neurons; n = five mice). (H) Summary of MFLhx6 (blue) and MFPV (red) for experiments F to G. Error bars: SEM.
Fig. 4.
Fig. 4.. Burst stimulation restores movement persistently in parkinsonian mice.
(A) Schematic showing bilateral dopamine depletion (6.43 ± 0.09% tyrosine hydroxylase (TH) remaining compared with littermate controls). (B) Schematic showing DBS electrode placement near the EPN. (C) Cross-over design illustrating a pseudorandom experimental protocol in which DD mice receive conventional or burst DBS on alternate days. (D) Average velocity of DD mice increased during conventional DBS (gray) but did not persist after stimulation (Pre: 0.54 ± 0.07, Stim: 0.94 ± 0.13, Post: 0.40 ± 0.06 cm/s) [Wilcoxon signed rank (WSR): Pre versus Stim, +P = 0.055; Stim versus 90 min (90’) *P = 0.008; Pre versus 90’. P = 0.195, n = eight mice]. Average velocity increased during burst DBS (green) and was still elevated 90 min after stimulation (Pre: 0.47 ± 0.09, Stim: 1.03 ± 0.19, Post: 1.77 ± 0.54 cm/s) (WSR: Pre versus Stim *P = 0.016; Stim versus 90’ P = 0.195; Pre versus. 90’ *P = 0.008). Data from individual mice are shown, and colors and symbols are consistent throughout (ns, not significant). (E) Immobility of DD mice decreased during conventional DBS (gray) but did not persist (Pre: 75 ± 6 Stim: 51 ± 7, Post: 87 ± 4% time immobile) (WSR: Pre versus Stim, +P = 0.056 Stim versus 90’ *P = 0.008, Pre versus 90’ = 0.195). Immobility decreased during burst DBS (green) and was still low 90 min after stimulation (Pre: 82 ± 6, Stim: 48 ± 7, Post: 45 ± 9% time immobile) (WSR: Pre versus Stim, *P = 0.016; Stim versus 90’; P = 0.641; Pre versus. 90’ *P = 0.016). (F) Movement paths over 8-min intervals throughout one trial. Data are from the same mouse treated with conventional DBS (gray) or burst DBS (green). (G to H) Average movement velocities (G) and immobility (H) are plotted for the duration of behavioral trials. Movement velocities were averaged over 30-s time bins and percent immobility was averaged over 30-min time bins. Gray, conventional DBS; green, burst DBS (n = eight mice). (I to J) Amount of time after DBS before mice returned to pre-stim levels of immobility (“therapeutic duration”). Therapeutic duration was significantly longer after burst DBS (123.8 ± 37.4 min, green) than after conventional DBS (37.5 ± 25.5 min, gray) (WSR, *P = 0.012, n = eight mice), shown for individual mice (I) and cumulatively across the population (J).

Comment in

References

    1. Guo T et al., Front. Neurosci. 13, 413 (2019). - PMC - PubMed
    1. Anastassiou CA, Montgomery SM, Barahona M, Buzsáki G, Koch C, J. Neurosci. 30, 1925–1936 (2010). - PMC - PubMed
    1. McIntyre CC, Grill WM, Ann. Biomed. Eng. 28, 219–233 (2000). - PubMed
    1. Radman T, Ramos RL, Brumberg JC, Bikson M, Brain Stimul. 2, 215–228.e3 (2009). - PMC - PubMed
    1. McIntyre CC, Grill WM, J. Neurophysiol. 88, 1592–1604 (2002). - PubMed

Publication types