. 2021 Nov 22;6(22):e136147.
doi: 10.1172/jci.insight.136147.

Microglia regulate brain progranulin levels through the endocytosis/lysosomal pathway

Affiliations

Microglia regulate brain progranulin levels through the endocytosis/lysosomal pathway

Tingting Dong et al. JCI Insight. .

Abstract

Genetic variants in Granulin (GRN), which encodes the secreted glycoprotein progranulin (PGRN), are associated with several neurodegenerative diseases, including frontotemporal lobar degeneration, neuronal ceroid lipofuscinosis, and Alzheimer's disease. These genetic alterations manifest in pathological changes due to a reduction of PGRN expression; therefore, identifying factors that can modulate PGRN levels in vivo would enhance our understanding of PGRN in neurodegeneration and could reveal novel potential therapeutic targets. Here, we report that modulation of the endocytosis/lysosomal pathway via reduction of Nemo-like kinase (Nlk) in microglia, but not in neurons, can alter total brain Pgrn levels in mice. We demonstrate that Nlk reduction promotes Pgrn degradation by enhancing its trafficking through the endocytosis/lysosomal pathway, specifically in microglia. Furthermore, genetic interaction studies in mice showed that Nlk heterozygosity in Grn haploinsufficient mice further reduces Pgrn levels and induces neuropathological phenotypes associated with PGRN deficiency. Our results reveal a mechanism for Pgrn level regulation in the brain through the active catabolism by microglia and provide insights into the pathophysiology of PGRN-associated diseases.

Keywords: Dementia; Mouse models; Neurodegeneration; Neuroscience.


Figures

Figure 1
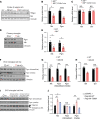
Figure 1. Loss of Nlk regulates Pgrn levels in the mouse cortex.
(A–D) Expression levels of Pgrn were significantly decreased in the mouse cortex of Nlk+/– Grn+/- mice compared with their littermate controls. Representative Western blot images (A) and quantification (B) of Pgrn and Nlk expression in the 1-year-old mouse cortex. Normalized protein levels of Nlk and Pgrn signals to Vinculin are shown in this and all following graphs. Error bars represent standard error of the mean (SEM) in this and all following graphs. **P < 0.01, ****P < 0.0001; 1-way ANOVA with Tukey’s multiple comparisons post hoc test; F(3,19)=15.45, P < 0.0001. Representative confocal images (C) and quantification (D) of Pgrn immunofluorescent staining in a 1-year-old mouse cortex. Total fluorescence intensity quantification across the image field was automated using Volocity software. *P < 0.05, **P < 0.01, ***P < 0.001, ****P < 0.0001; 1-way ANOVA with Tukey’s multiple comparisons post hoc test; F(3,19)=26.11, P < 0.0001. (E–G) Temporal deletion of Nlk in all cell types reduces Pgrn protein levels in the mouse cortex. Protein and mRNA expression levels were analyzed in the 7-week-old cortex of Nlkfl/fl and Nlkfl/fl Actin-creERT2 mice after tamoxifen (TMX) injection. Representative Western blot images (E) and quantification (F) showing the reduced Nlk and Pgrn expression in the mouse cortex. **P < 0.01, ****P < 0.0001 (nonparametric Mann-Whitney t test, n = 8 animals for Nlkfl/fl, n = 9 for Nlkfl/fl Actin-creERT2). (G) Quantification of Grn mRNA expression levels in Nlk-deleted mouse cortex, showing no transcriptional effects. Normalized levels of Nlk and Grn mRNA to mouse ACTB are shown in this and all following graphs. ***P < 0.001, NS, nonsignificant (nonparametric Mann-Whitney t test, n = 3). In this and all following figures, mouse genotypes are color-coded. Black represents WT, pink for Nlk+/–, yellow for Grn+/–, and blue for Nlk+/– Grn+/– unless otherwise mentioned.
Figure 2
Figure 2. Nlk does not regulate Pgrn levels in neurons.
(A–C) Nlk does not regulate Pgrn levels through neurons in vivo. Protein and mRNA expression levels were analyzed in the 6-week-old cortex of Nlkfl/fl and Nlkfl/fl Nex-cre mice. Representative Western blot images (A) and quantification (B and C) showing that the expression levels of Pgrn protein or Grn mRNA in the whole cortex were not altered by Nlk deletion specifically in the principal neurons. ***P < 0.001 (nonparametric Mann-Whitney t test, n = 5). (D–F) Nlk does not regulate Pgrn levels in primary neurons in vitro. Expression levels of Nlk and Pgrn were analyzed in cultured primary cortical neurons from WT, Nlk+/–, and Nlk–/– mice. Representative Western blot images (D) and quantification (E and F) showing that the expression levels of Pgrn or Grn mRNA were not altered by Nlk expression levels in neurons. As previously reported (48), a small amount of residual Nlk remained (~10%) in Nlk–/– animals due to limitations of gene trap technology. **P < 0.01, ****P < 0.0001; 1-way ANOVA with Tukey’s post hoc testing, n = 3; Nlk F(2,6)=109.8, P < 0.0001; Grn F(2,6)=0.01789, P = 0.9823.
Figure 3
Figure 3. Nlk regulates Pgrn levels in microglia in a kinase activity-dependent manner.
(A–C) Nlk regulates Pgrn levels in microglia in vivo. Protein and mRNA expression levels were analyzed in the 6-week-old cortex of Nlkfl/fl and Nlkfl/fl Cx3cr1-cre mice. Representative Western blot images (A) and quantification (B) showing that the protein expression levels of Pgrn are significantly decreased by Nlk deletion in microglia. Grn–/– is shown as a negative control. *P < 0.05, ****P < 0.0001 (nonparametric Mann-Whitney t test, n = 4–6 animals per group). Quantification (C) of Nlk and Grn mRNA expression levels in the cortex from microglia-specific Nlk deletion mice. NS, nonsignificant (nonparametric Mann-Whitney t test, n = 6). (D and E) Reduced Nlk expression significantly decreased Pgrn expression levels in primary microglia. Representative Western blot images (D) and quantification (E) of Nlk and Pgrn expression levels in primary microglia at DIV-16 from WT and Nlk+/– mice. *P < 0.05 (nonparametric Mann-Whitney t test, n = 5). (F–H) Nlk reduction resulted in decreased Pgrn levels in BV2 microglial cells. Protein and mRNA expression levels were analyzed in WT and Nlk-KD BV2 cells. Representative Western blot images (F) and quantification (G and H) showing the expression levels of Nlk and Pgrn proteins and their corresponding mRNAs. ***P < 0.001 (nonparametric Mann-Whitney t test, n = 4). (I and J) Increased expression of Nlk upregulated Pgrn levels in the media in a kinase activity–dependent manner in BV2 microglial cells. Representative Western blot images (I) and quantification (J) of Nlk and Pgrn levels in BV2 cells by Nlk overexpression. Nlk-T298A is a kinase-inactive form of Nlk. *P < 0.05, **P < 0.01, ***P < 0.001; 1-way ANOVA with Tukey’s post hoc testing; n = 3; Nlk F(2,6)=14.91, P = 0.0047; Pgrn (intracellular) F(2,6)=1.190, P = 0.3670; Pgrn (media) F(2,6)=30.16, P = 0.0007.
Figure 4
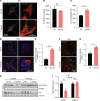
Figure 4. Nlk deficiency increases clathrin-dependent Pgrn endocytosis in microglia.
(A) Nlk reduction resulted in the increased localization of Pgrn to endosomes. Representative images of WT and Nlk-KD BV2 cells costained for Pgrn/Rab11 demonstrated colocalization of Pgrn with recycling endosomes. Right panels are magnified views of areas marked in the left panels. (B and C) Quantification of Rab11 puncta (B) and colocalization Pgrn and Rab11 (C) are shown. **P < 0.01 (2-tailed, unpaired Student’s t test, n = 3 wells, average of ~10 cells sampled per well). (D and E) Enhanced uptake of the extracellularly provided dextran in Nlk-KD BV2 cells. Representative images (D) and quantification (E) of WT and Nlk-KD BV2 cells after 20 minutes’ incubation with 647-dextran. ***P < 0.001 (2-tailed, unpaired Student’s t test, n = 3 wells, average of ~50 cells sampled per well). (F and G) Enhanced uptake of the extracellularly provided transferrin in Nlk-KD BV2 cells. Representative images (F) and quantification (G) of WT and Nlk-KD BV2 cells after 15 minutes’ incubation with Alexa 568–transferrin. *P < 0.05 (2-tailed, unpaired Student’s t test, n = 3). (H and I) Representative Western blot images (H) and quantification (I) showing the enhanced clathrin-dependent endocytosis of Flag-tagged PGRN provided exogenously in BV2 microglial cells. Cells were treated with DMSO or the clathrin-dependent endocytosis inhibitor Pitstop 2 for 1 hour and incubated with the recombinant Flag-PGRN (1 nM) for 15 minutes. **P < 0.01; 2-way ANOVA with post hoc Bonferroni correction, n = 3; F(1,8)=11.85, P = 0.0088.
Figure 5
Figure 5. Microglial Nlk-mediated regulation of Pgrn levels is dependent on lysosomal degradation.
(A and B) Representative Western blot images (A) and quantification (B) showing the enhanced degradation of the exogenously provided recombinant Flag-PGRN protein in Nlk-KD BV2 cells, which is lysosome activity dependent. Cells were treated with DMSO or BafA1 for 4 hours and incubated with the recombinant Flag-PGRN (20 nM) for 15 minutes. *P < 0.05, ***P < 0.001; 2-way ANOVA, n = 3; F(1,8)=17.12, P = 0.0033.
Figure 6
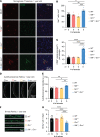
Figure 6. Nlk+/– Grn+/– mice display FTLD-like neuropathological phenotypes.
(A–C) Increased microglial activation in Nlk+/– Grn+/– mice compared with their littermates. Representative confocal images (A) and quantification (B and C) of Iba1 and CD68 staining from the thalamus of 1-year-old mice. (B) The number of Iba1-positive microglia was increased in the thalamus of Nlk+/– Grn+/– mice. *P < 0.05, **P < 0.01, ***P < 0.001; 1-way ANOVA with Tukey’s multiple comparisons post hoc test; F(3,18)=10.72, P = 0.0003. (C) CD68-positive vesicle volume in Iba1-positive microglia was also increased in Nlk+/– Grn+/– mice. ****P < 0.0001; 1-way ANOVA with Tukey’s multiple comparisons post hoc test; F(3,19)=82.22, P < 0.0001. (D and E) Representative images (D) and quantification (E) of autofluorescence using 488 nm excitation in the retina of 1-year-old WT, Nlk+/–, Grn+/–, and Nlk+/– Grn+/– mice. *P < 0.05, **P < 0.01; 1-way ANOVA with Tukey’s multiple comparisons post hoc test; F(3,19)=8.327, P = 0.0010. (F and G) Representative images (F) and quantification (G) of 1-year old WT, Nlk+/–, Grn+/–, and Nlk+/– Grn+/– mouse retinas stained for Brn3a (green) and DAPI (blue). ****P < 0.0001; 1-way ANOVA with Tukey’s multiple comparisons post hoc test; F(3,40)=20.52, P < 0.0001.

References

    1. Toh H, et al. Structure, function, and mechanism of progranulin; the brain and beyond. J Mol Neurosci. 2011;45(3):538–548. doi: 10.1007/s12031-011-9569-4. - DOI - PubMed
    1. Cenik B, et al. Progranulin: a proteolytically processed protein at the crossroads of inflammation and neurodegeneration. J Biol Chem. 2012;287(39):32298–32306. doi: 10.1074/jbc.R112.399170. - DOI - PMC - PubMed
    1. Baker M, et al. Mutations in progranulin cause tau-negative frontotemporal dementia linked to chromosome 17. Nature. 2006;442(7105):916–919. doi: 10.1038/nature05016. - DOI - PubMed
    1. Chen-Plotkin AS, et al. Brain progranulin expression in GRN-associated frontotemporal lobar degeneration. Acta Neuropathol. 2010;119(1):111–122. doi: 10.1007/s00401-009-0576-2. - DOI - PMC - PubMed
    1. Cruts M, et al. Null mutations in progranulin cause ubiquitin-positive frontotemporal dementia linked to chromosome 17q21. Nature. 2006;442(7105):920–924. doi: 10.1038/nature05017. - DOI - PubMed

Publication types