. 2021 Nov 22;6(22):e148768.
doi: 10.1172/jci.insight.148768.

Tumor-propagating side population cells are a dynamic subpopulation in undifferentiated pleomorphic sarcoma

Affiliations

Tumor-propagating side population cells are a dynamic subpopulation in undifferentiated pleomorphic sarcoma

Yuning Jackie Tang et al. JCI Insight. .

Abstract

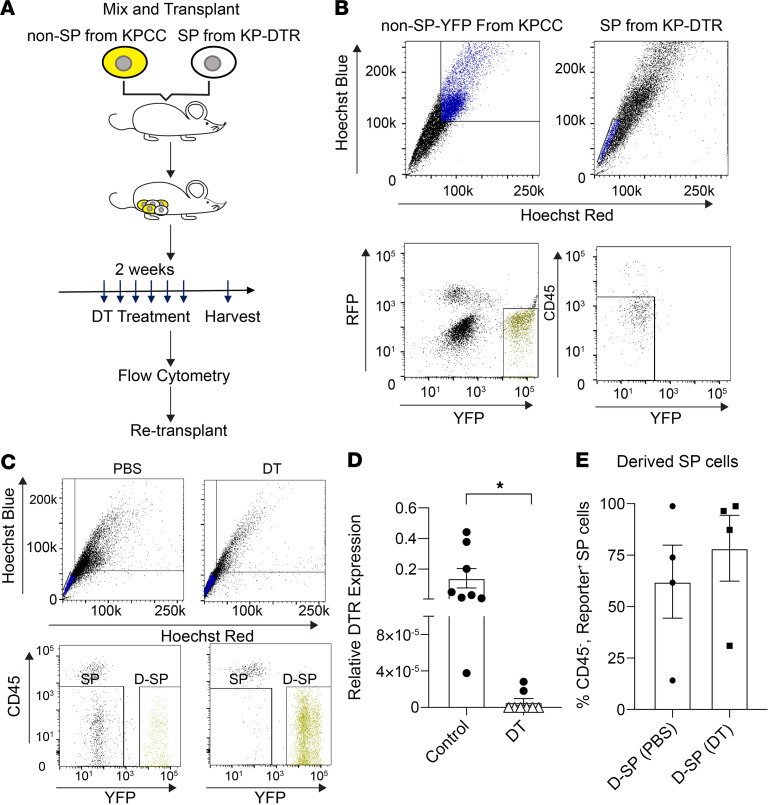
Sarcomas contain a subpopulation of tumor-propagating cells (TPCs) with enhanced tumor-initiating and self-renewal properties. However, it is unclear whether the TPC phenotype in sarcomas is stable or a dynamic cell state that can derive from non-TPCs. In this study, we utilized a mouse model of undifferentiated pleomorphic sarcoma (UPS) to trace the lineage relationship between sarcoma side population (SP) cells that are enriched for TPCs and non-SP cells. By cotransplanting SP and non-SP cells expressing different endogenous fluorescent reporters, we show that non-SP cells can give rise to SP cells with enhanced tumor-propagating potential in vivo. Lineage trajectory analysis using single-cell RNA sequencing from SP and non-SP cells supports the notion that non-SP cells can assume the SP cell phenotype de novo. To test the effect of eradicating SP cells on tumor growth and self-renewal, we generated mouse sarcomas in which the diphtheria toxin receptor is expressed in the SP cells and their progeny. Ablation of the SP population using diphtheria toxin did not impede tumor growth or self-renewal. Altogether, we show that the sarcoma SP represent a dynamic cell state and targeting TPCs alone is insufficient to eliminate tumor progression.

Keywords: Cancer; Mouse models; Oncology.


Conflict of interest statement

Conflict of interest: DGK is a cofounder of and has received research support from XRad Therapeutics, which is developing radiosensitizers. DGK is on the scientific advisory board of and owns stock in Lumicell Inc., which is developing intraoperative imaging technology. DGK receives research support from Merck, Bristol-Myers Squibb, and Varian Medical Systems.

Figures

Figure 1
Figure 1. Side population cells in KPCC tumors enrich for TPCs.
(A) Representative FACS gating schematic for side population (SP) and non-SP cells in KPCC tumors (n > 3). (B) Average percentage of CD45 SP cells in KPCC tumors (n = 3). Error bars represent mean ± SEM. (C) SP and non-SP cells in KPCC tumors express different florescent reporters (n = 3). (D) Extreme limiting dilution analysis (ELDA) shows that SP cells are significantly enriched for tumor-propagating potential compared with non-SP cells in nude mice (χ2 = 87.7, df = 1, P = 7.74 × 10⁻²¹). The dotted line indicates the 95% confidence interval. (E) ELDA shows that SP cells are significantly enriched for tumor-propagating potential compared with non-SP cells in NSG mice (χ2 = 30.4, df = 1, P = 3.45 × 10⁻⁸). The dotted line indicates the 95% confidence interval.
Figure 2
Figure 2. Cotransplantation of SP and non-SP cells expressing different florescent reporters reveals that NSP cells can give rise to SP cells in vivo.
(A) Schematic of cotransplantation experiment. (B) FACS gating to sort for SP cells expressing YFP and non-SP cells expressing RFP from KPCC tumors (n = 4). (C–E) The percentages of cells expressing RFP and YFP within the total cell population, the SP compartment, and the non-SP compartment. Each dot represents a mouse. Error bars represent mean ± SEM.
Figure 3
Figure 3. RNA velocity analysis of SP and non-SP populations.
(A) Schematic of the scRNA-Seq experiment. (B) T-distributed stochastic neighbor embedding (tSNE) plot showing different clusters in the SP and non-SP cells from KPCC-844 tumor. (C) RNA velocity analysis showing predicted cell fate transition from non-SP to SP population. (D) Violin plot showing expressions of marker genes in SP and NSP cells. Cell clusters are arranged by decreasing gene expression. Each cell identity number corresponds to a cell identity number in the tSNE plot.
Figure 4
Figure 4. Cotransplantation and ablation of SP cells in vivo.
(A) Schematic of cotransplantation and genetic ablation of SP cells expressing diphtheria toxin receptor (DTR) gene. (B) FACS gating scheme to sort for non-SP cells from KPCC tumors and SP cells from KP-DTR tumors for cotransplantation (n = 4). (C) FACS gating of SP and non-SP cells after the tumors are treated with diphtheria toxin (DT) or PBS. (D) The relative expression of the DTR gene for tumors treated with DT compared with tumors treated with 1X PBS. Each symbol represent tumors from a cotransplanted mouse. Triangles represent mice with undetectable DTR expression (*P < 0.05, 2-tailed Student’s t test). Error bars represent mean ± SEM. (E) FACS analysis of mean SP cells expressing fluorescent reporters in cotransplanted tumors after DT or PBS treatment. Each dot represents the mean percentage of fluorescent SP cells from each set of cotransplantation experiments (n ≥ 3 for each set). Error bars represent mean ± SEM.

References

    1. Almendro V, et al. Cellular heterogeneity and molecular evolution in cancer. Annu Rev Pathol. 2013;8:277–302. doi: 10.1146/annurev-pathol-020712-163923. - DOI - PubMed
    1. Swanton C. Intratumor heterogeneity: evolution through space and time. Cancer Res. 2012;72(19):4875–4882. doi: 10.1158/0008-5472.CAN-12-2217. - DOI - PMC - PubMed
    1. Marusyk A, et al. Intra-tumour heterogeneity: a looking glass for cancer? Nat Rev Cancer. 2012;12(5):323–334. doi: 10.1038/nrc3261. - DOI - PubMed
    1. McGranahan N, Swanton C. Clonal heterogeneity and tumor evolution: past, present, and the future. Cell. 2017;168(4):613–628. doi: 10.1016/j.cell.2017.01.018. - DOI - PubMed
    1. Dagogo-Jack I, Shaw AT. Tumour heterogeneity and resistance to cancer therapies. Nat Rev Clin Oncol. 2018;15(2):81–94. doi: 10.1038/nrclinonc.2017.166. - DOI - PubMed

Publication types