. 2022 Feb 10;807(Pt 1):150786.
doi: 10.1016/j.scitotenv.2021.150786. Epub 2021 Oct 5.

Defining biological and biophysical properties of SARS-CoV-2 genetic material in wastewater

Affiliations

Defining biological and biophysical properties of SARS-CoV-2 genetic material in wastewater

Carolyn A Robinson et al. Sci Total Environ. .

Abstract

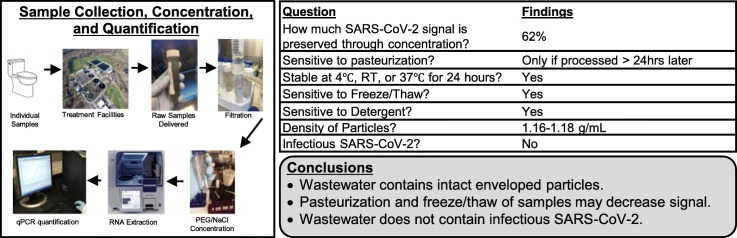
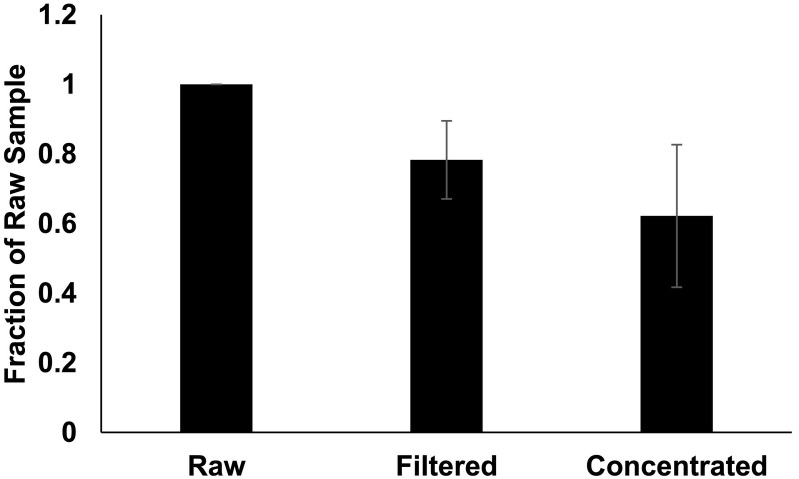
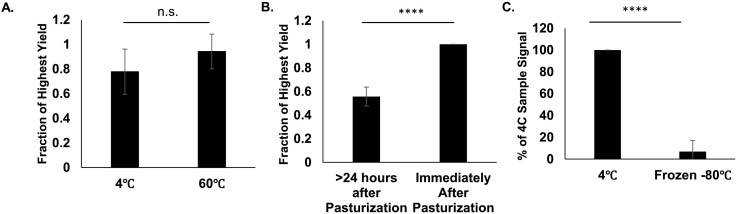
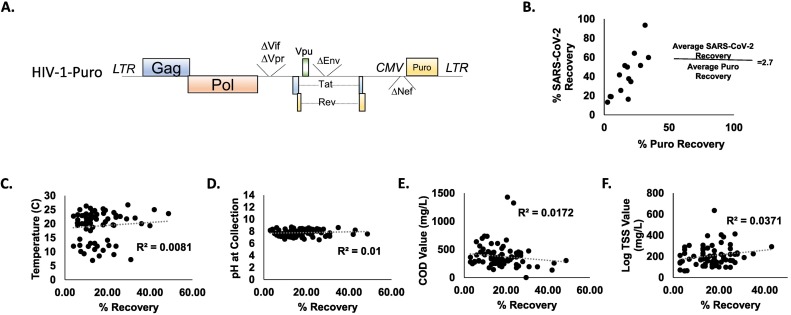
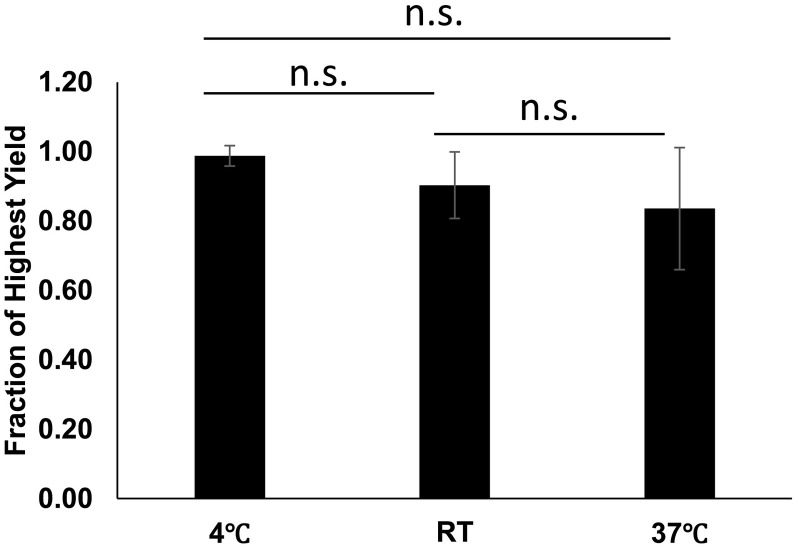
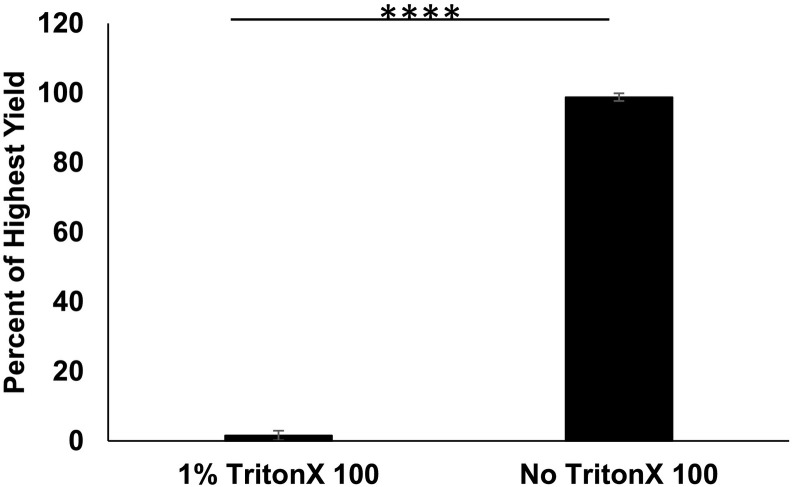
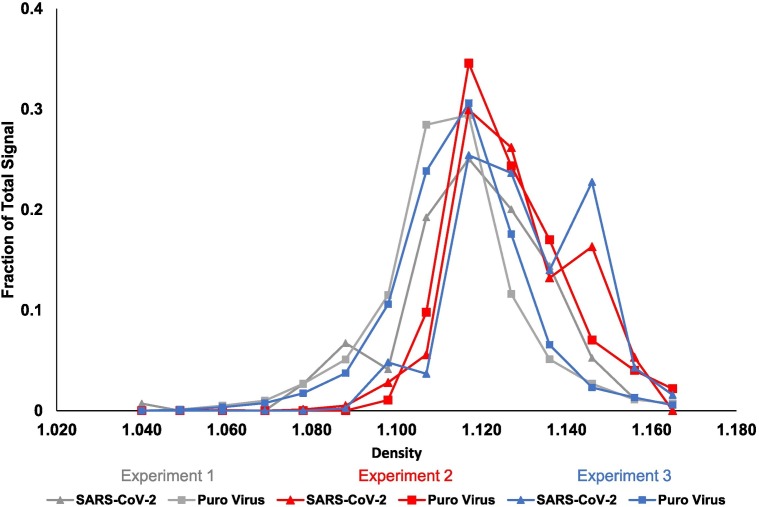
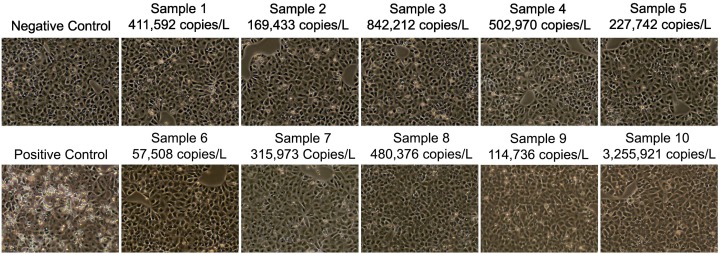
SARS-CoV-2 genetic material has been detected in raw wastewater around the world throughout the COVID-19 pandemic and has served as a useful tool for monitoring community levels of SARS-CoV-2 infections. SARS-CoV-2 genetic material is highly detectable in a patient's feces and the household wastewater for several days before and after a positive COVID-19 qPCR test from throat or sputum samples. Here, we characterize genetic material collected from raw wastewater samples and determine recovery efficiency during a concentration process. We find that pasteurization of raw wastewater samples did not reduce SARS-CoV-2 signal if RNA is extracted immediately after pasteurization. On the contrary, we find that signal decreased by approximately half when RNA was extracted 24-36 h post-pasteurization and ~90% when freeze-thawed prior to concentration. As a matrix control, we use an engineered enveloped RNA virus. Surprisingly, after concentration, the recovery of SARS-CoV-2 signal is consistently higher than the recovery of the control virus leading us to question the nature of the SARS-CoV-2 genetic material detected in wastewater. We see no significant difference in signal after different 24-hour temperature changes; however, treatment with detergent decreases signal ~100-fold. Furthermore, the density of the samples is comparable to enveloped retrovirus particles, yet, interestingly, when raw wastewater samples were used to inoculate cells, no cytopathic effects were seen indicating that wastewater samples do not contain infectious SARS-CoV-2. Together, this suggests that wastewater contains fully intact enveloped particles.

Keywords: COVID-19; Coronavirus; Pasteurization; Sewage; Surveillance; Wastewater.


Conflict of interest statement

Declaration of competing interest The authors declare that they have no known competing financial interests or personal relationships that could have appeared to influence the work reported in this paper.

Figures

Unlabelled Image
Graphical abstract
Fig. 1
Fig. 1
Recovery. N = 9. Raw samples were spun at 2000 ×g for 5 min to remove large particulates, then vacuum filtered through a 0.22 μm filter, and mixed with Polyethylene glycol (PEG) and NaCl solution for a final concentration of 12% PEG and 0.3 M NaCl. Samples were mixed thoroughly and kept at 4 °C for 1 h, then spun at 12,000 ×g at 4 °C for 2 h. RNA was extracted from pellet, and viral recovery was determined by qPCR. Wastewater was collected prior to filtering the sample, after filtration (before addition of PEG solution), and after concentration of virus. Signal from unconcentrated samples was multiplied based on the total volume of sample to be concentrated to allow for equal comparison at each step. Error bars represent standard deviation.
Fig. 2
Fig. 2
Impact of Pasteurization and Freeze-Thaw. A) N = 6. Duplicate samples were kept at 4 °C or incubated at 60 °C for 2 h. Raw samples were concentrated, and RNA was extracted from the pellet. Viral recovery was determined by qPCR. Fraction of Highest yield was calculated by the ratio signal between treatments. Error bars represent standard deviation. P-Value = 0.23 B) N = 6. Duplicate samples were kept at 4 °C or incubated at 60 °C for 2 h. RNA was extracted from raw samples either immediately after 2-hour incubation at 60 °C or 24–36 h after pasteurization. Viral recovery was determined by qPCR. Fraction of Highest yield was calculated by the ratio signal between treatments. Error bars represent standard deviation. P-Value = 2.05E−6. C) N = 6. Duplicate raw samples were kept at kept at 4 °C or −80 °C for 48 h. Raw Samples were concentrated, and RNA was extracted from the pellet. Viral recovery was determined by qPCR. Error bars represent standard deviation. P-Value = 3.13E−6.
Fig. 3
Fig. 3
A) Schematic of Puro Virus Control. NL4-3 derived HIV containing CMV driven, uniquely codon optimized, Puromycin resistance and lacking the accessory genes Vif, Vpr, Nef, and Env. B) Relative Recovery of Puro Virus Signal and SARS-CoV-2 Signal. Samples were spiked with Puro Virus at a concentration of 5.1 × 107 viral particles per sample. RNA was extracted from samples both before and after concentration, and viral recovery was determined by qPCR. C–F) Parameters at time of Collection in Relation to Control Recovery C) N = 68. Temperature D) N = 97 pH value E) N = 84. COD F) N = 69. log TSS value of wastewater at the end of 24-hour composite sample collection. R2 values for linear regression lines are 0.0081, 0.01, 0.0172, and 0.0371, respectively.
Fig. 4
Fig. 4
Temperature Stability. N = 6. Samples were mixed gently and split into 3 aliquots. Aliquots were stored at either 4 °C, RT, or 37 °C for 24 h. After 24 h, RNA was extracted, and viral recovery was determined by qPCR. Error bars represent standard deviation. P-Values: 4 °C to RT = 0.097, 4 °C to 37 °C = 0.108, RT to 37 °C = 0.363.
Fig. 5
Fig. 5
Detergent Sensitivity. N = 6. Duplicate samples were treated with either 1% Triton X 100 or PBS for 2 h at 37 °C. RNA was extracted from raw samples, and viral recovery was determined by qPCR. Error bars represent standard deviation. P-Value = 2.10E−20.
Fig. 6
Fig. 6
Density. N = 3. Puro Virus was added to raw wastewater samples at a concentration of 5.1 × 107 viral particles per sample. Raw samples were concentrated then added to a density gradient ranging from 0% to 28% iodixanol in a 0.25 M sucrose dilutant and spun in a Sorvall Discovery 100SE ultracentrifuge at 31,000 RPM for 3 h at 4 °C. RNA was extracted from fractions, and viral recovery was determined by qPCR.
Fig. 7
Fig. 7
Infectivity. CPE of Vero E6 cells 3 days post inoculation with fresh wastewater samples. Images taken 3 days after the 3rd inoculation. Ten total samples were tested. Numbers above each picture represent the copy number per liter from that sample as measured by qPCR.

References

    1. Agrawal S., Orschler L., Lackner S. Long-term monitoring of SARS-CoV-2 RNA in wastewater of the Frankfurt metropolitan area in southern Germany. Sci. Rep. 2021;11(1):5372. - PMC - PubMed
    1. Ahmed W., et al. Comparison of virus concentration methods for the RT-qPCR-based recovery of murine hepatitis virus, a surrogate for SARS-CoV-2 from untreated wastewater. Sci. Total Environ. 2020;739 - PMC - PubMed
    1. Asghar H., et al. Environmental surveillance for polioviruses in the global polio eradication initiative. J. Infect. Dis. 2014;210(Suppl. 1):S294–S303. - PMC - PubMed
    1. Baldovin T., et al. SARS-CoV-2 RNA detection and persistence in wastewater samples: an experimental network for COVID-19 environmental surveillance in Padua, Veneto region (NE Italy) Sci. Total Environ. 2021;760 - PMC - PubMed
    1. Bivins A., et al. Wastewater-based epidemiology: global collaborative to maximize contributions in the fight against COVID-19. Environ. Sci. Technol. 2020;54(13):7754–7757. - PubMed