. 2021:20:100159.
doi: 10.1016/j.mcpro.2021.100159. Epub 2021 Oct 5.

Metabolic Perturbation Associated With COVID-19 Disease Severity and SARS-CoV-2 Replication

Affiliations

Metabolic Perturbation Associated With COVID-19 Disease Severity and SARS-CoV-2 Replication

Shuba Krishnan et al. Mol Cell Proteomics. 2021.

Abstract

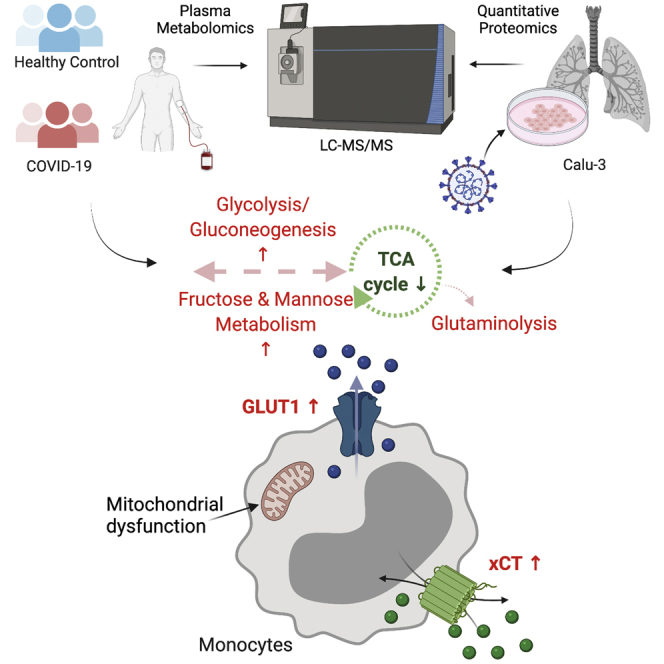
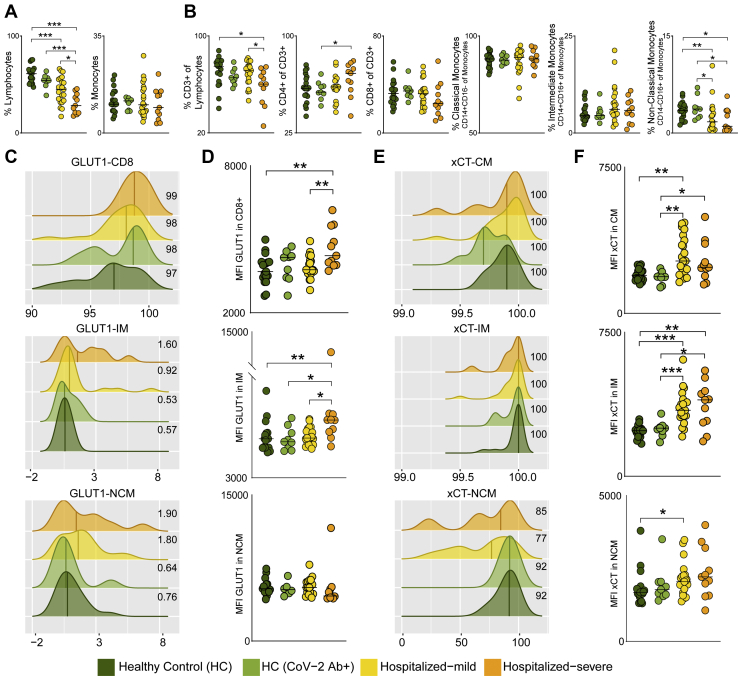
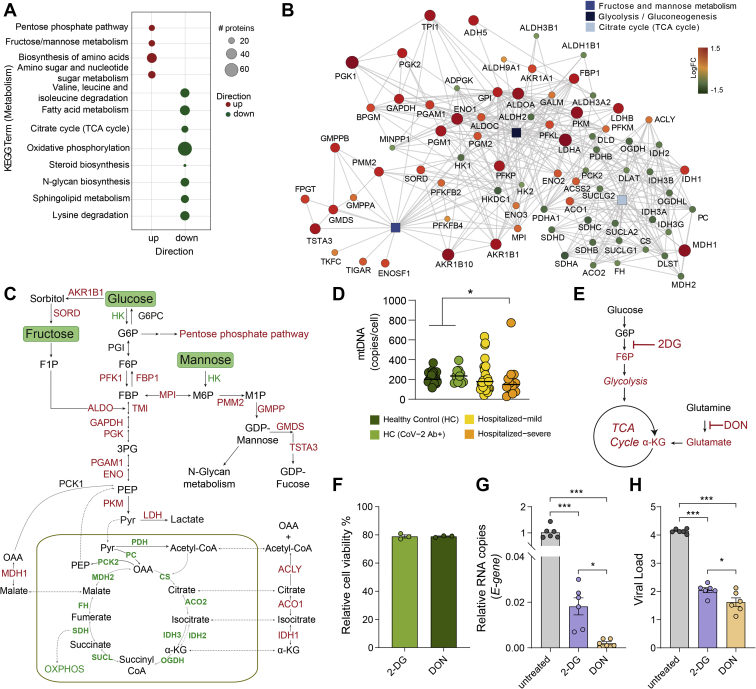
Viruses hijack host metabolic pathways for their replicative advantage. In this study, using patient-derived multiomics data and in vitro infection assays, we aimed to understand the role of key metabolic pathways that can regulate severe acute respiratory syndrome coronavirus-2 reproduction and their association with disease severity. We used multiomics platforms (targeted and untargeted proteomics and untargeted metabolomics) on patient samples and cell-line models along with immune phenotyping of metabolite transporters in patient blood cells to understand viral-induced metabolic modulations. We also modulated key metabolic pathways that were identified using multiomics data to regulate the viral reproduction in vitro. Coronavirus disease 2019 disease severity was characterized by increased plasma glucose and mannose levels. Immune phenotyping identified altered expression patterns of carbohydrate transporter, glucose transporter 1, in CD8+ T cells, intermediate and nonclassical monocytes, and amino acid transporter, xCT, in classical, intermediate, and nonclassical monocytes. In in vitro lung epithelial cell (Calu-3) infection model, we found that glycolysis and glutaminolysis are essential for virus replication, and blocking these metabolic pathways caused significant reduction in virus production. Taken together, we therefore hypothesized that severe acute respiratory syndrome coronavirus-2 utilizes and rewires pathways governing central carbon metabolism leading to the efflux of toxic metabolites and associated with disease severity. Thus, the host metabolic perturbation could be an attractive strategy to limit the viral replication and disease severity.

Keywords: COVID-19; mannose; metabolic transporters; metabolomics.


Conflict of interest statement

Conflict of interest The authors declare no competing interests.

Figures

None
Graphical abstract
Fig. 1
Fig. 1
Targeted plasma proteomics in COVID-19 patients.A, heatmap of Z-score transformed quantitative measurements of all proteins detected by the immuno-oncology panel. Column annotation represents each patient sample and their corresponding groups and pairs of statistical analysis. Rows are proteins hierarchically clustered based on the Euclidean distance and complete linkage method. Names of proteins that are identified as significant in any of the statistical analysis are printed. B, KEGG pathway enrichment analysis results of significantly changed proteins between HC (HC + HC-CoV-2 Ab+) and COVID-19 (hospitalized mild + hospitalized severe) groups. C, violin plot of significantly regulated (Mann–Whitney U test) proteins between hospitalized mild and hospitalized severe, ∗adjusted p < 0.05, ∗∗adjusted p < 0.01. COVID-19, coronavirus disease 2019; HC, healthy control; KEGG, Kyoto Encyclopedia of Genes and Genomes.
Fig. 2
Fig. 2
Untargeted global plasma metabolomics in COVID-19 patients.A, sample distribution for quantitative metabolite measurements plotted in 2D space after performing dimensionality reduction using UMAP. B, stacked bar plots visualizing percentage of metabolites significantly changed between HC (HC + HC-CoV-2 Ab+) and COVID-19 (hospitalized mild + hospitalized severe) group concerning their corresponding superpathways and subpathways. C, metabolic set enrichment analysis using the significantly enriched metabolites between HCs and COVID-19 patients. The size of the bubble indicates adjusted p values. D, heatmap of log2 scaled and Z-score transformed measurements of metabolites significantly changed between HC (HC + HC-CoV-2 Ab+) and COVID-19 (hospitalized mild + hospitalized severe) groups. Column annotation represents each patient sample and the corresponding groups. Row annotation represents superpathways of the metabolites. Rows are metabolites hierarchically clustered based on Euclidean distance and complete linkage method. COVID-19, coronavirus disease 2019; HC, healthy control; UMAP, uniform manifold approximation and projection.
Fig. 3
Fig. 3
Metabolic alterations in the mild and severe hospitalized COVID-19 patients and its role in viral replication.A, heatmap of log2 scaled and Z-score transformed significantly changed metabolites between hospitalized mild and hospitalized severe groups. Column annotation represents each patient sample and the corresponding groups. Rows are metabolites hierarchically clustered based on Euclidean distance and complete linkage method. B, alluvial plot representing pathways resulted from IPA pathway enrichment analysis using all metabolites that differ significantly between hospitalized mild and severe groups. C, volcano plot showing all the metabolites that differ significantly between hospitalized mild and hospitalized severe groups. D, box plots of key metabolites glutamate, glucose, and mannose. Adjusted p values determined by limma is shown. ∗adjusted p < 0.05 and ∗∗adjusted p < 0.001. E, box plots of soluble mannose-binding lectin levels in patients' plasma. p Values determined by Mann–Whitney U test. F and G, viral load of SARS-CoV-2 determined by RT–quantitative PCR targeting the viral E-gene is measured in (F) cell culture supernatants and (G) cell lysates at MOI 0.001 in Calu-3 cells grown in different glucose and mannose concentrations (millimolar) as indicated. The data are represented as mean ± SEM of two independent experiments, duplicates in each experiment. p Values are determined by Student's t test, ∗p < 0.05. COVID-19, coronavirus disease 2019; IPA, ingenuity pathway analysis; MOI, multiplicity of infection; SARS-CoV-2, severe acute respiratory syndrome coronavirus-2.
Fig. 4
Fig. 4
Glucose, mannose, and glutamate transporters in COVID-19 severity.A, percentage of total lymphocytes and monocytes in all four patient groups. B, percentage of PBMC subpopulations, CD3+ T cells of lymphocytes, CD4+ T cells (of CD3+ cells), CD8+ T cells (of CD3+ cells), classical monocytes (CM, CD14+CD16 of monocytes), intermediate monocytes (IM, CD14+CD16+ of monocytes), and nonclassical monocytes (NCM, CD14CD16+ of monocytes). Median values are indicated by lines. C, density plot of percentage of CD8+ T cells, IM, and NCM expressing GLUT1. Histograms show percentage of cells expressing GLUT1 (x-axis) and GLUT1 read density of each sample (y-axis). The median percentage of cells expressing GLUT1 is shown for each patient group. D, MFI of GLUT1 in CD8+ T cells, IM and NCM in all four patient groups. E, density plot of percentage of CM, IM, and NCM expressing xCT. Histograms show percentage of cells expressing xCT (x-axis) and xCT read density of each sample (y-axis). The median percentage of cells expressing xCT is shown for each patient group. F, MFI of xCT in CM, IM, and NCM in all four patient groups. In all the panels, the median values are indicated by lines, p values are determined by Mann–Whitney U test, ∗p < 0.05, ∗∗p < 0.01, and ∗∗∗p < 0.001. COVID-19, coronavirus disease 2019; GLUT1, glucose transporter 1; MFI, mean fluorescence intensity; PBMC, peripheral blood mononuclear cell.
Fig. 5
Fig. 5
Cell-specific regulation of central carbon metabolic pathways by SARS-CoV-2.A, bubble plots of protein set enrichment analysis (adjusted p < 0.1) restricted to metabolic pathways showing highly upregulated (red) and downregulated (green) proteins in SARS-CoV-2–infected Calu-3 cells compared with mock-infected cells. Bubble size is relative to number of proteins. B, network analysis of proteins from glycolysis/gluconeogenesis, fructose and mannose metabolism, and TCA cycle that were significantly different in SARS-CoV-2–infected and mock-infected Calu-3 cells. Rectangular shapes represent the three pathways. Circular shapes show each protein that is either upregulated (red) or downregulated (green) in infected cells compared with mock-infected cells. The size of the circle indicates fold change. Lines denote connection of each protein to its respective pathway and connection between each protein–protein (STRING, confidence > 0.7). C, schematic map of the glycolysis/gluconeogenesis, fructose and mannose metabolism, and TCA cycle. Red indicates significantly upregulated proteins, and green indicates significantly downregulated proteins in SARS-CoV-2–infected Calu-3 cells. D, mtDNA copy number in whole blood cells in all four patient groups. Median values are indicated by lines, p values are determined by Mann–Whitney U test, ∗p < 0.05. E, schematic of inhibitors of metabolic pathways, 2-DG inhibits glycolysis, and DON inhibits glutaminolysis. F, cell viability (percent relative to control) following treatment of Calu-3 cells with 2-DG (10 mM) and DON (200 μM). G and H, viral load of SARS-CoV-2 determined by RT–quantitative PCR targeting the viral E-gene is measured in (G) cell lysates and (H) cell culture supernatants, at MOI 0.001 in Calu-3 cells treated with 2-DG or DON as indicated. The data are represented as mean ± SEM of two individual experiments, triplicates in each experiment. p Values are determined by Student's t test, ∗p < 0.05, ∗∗∗p < 0.001. 2-DG, 2-deoxy-d-glucose; DON, 6-diazo-5-oxo-l-norleucine; MOI, multiplicity of infection; mtDNA, mitochondrial DNA; SARS-CoV-2, severe acute respiratory syndrome coronavirus-2; TCA, tricarboxylic acid.

References

    1. Thomas T., Stefanoni D., Reisz J.A., Nemkov T., Bertolone L., Francis R.O., Hudson K.E., Zimring J.C., Hansen K.C., Hod E.A., Spitalnik S.L., D'Alessandro A. COVID-19 infection alters kynurenine and fatty acid metabolism, correlating with IL-6 levels and renal status. JCI Insight. 2020;5 - PMC - PubMed
    1. Wu D., Shu T., Yang X., Song J.-X., Zhang M., Yao C., Liu W., Huang M., Yu Y., Yang Q., Zhu T., Xu J., Mu J., Wang Y., Wang H., et al. Plasma metabolomic and lipidomic alterations associated with COVID-19. Natl. Sci. Rev. 2020;7:1157–1168. - PMC - PubMed
    1. Shen B., Yi X., Sun Y., Bi X., Du J., Zhang C., Quan S., Zhang F., Sun R., Qian L., Ge W., Liu W., Liang S., Chen H., Zhang Y., et al. Proteomic and metabolomic characterization of COVID-19 patient sera. Cell. 2020;182:59–72.e15. - PMC - PubMed
    1. Su Y., Chen D., Yuan D., Lausted C., Choi J., Dai C.L., Voillet V., Duvvuri V.R., Scherler K., Troisch P., Baloni P., Qin G., Smith B., Kornilov S.A., Rostomily C., et al. Multi-omics resolves a sharp disease-state shift between mild and moderate COVID-19. Cell. 2020;183:1479–1495.e1420. - PMC - PubMed
    1. Maynard N.D., Gutschow M.V., Birch E.W., Covert M.W. The virus as metabolic engineer. Biotechnol. J. 2010;5:686–694. - PMC - PubMed

Publication types

MeSH terms