. 2021 Dec;600(7889):517-522.
doi: 10.1038/s41586-021-04060-7. Epub 2021 Oct 7.

Anti-SARS-CoV-2 receptor-binding domain antibody evolution after mRNA vaccination

Affiliations

Anti-SARS-CoV-2 receptor-binding domain antibody evolution after mRNA vaccination

Alice Cho et al. Nature. 2021 Dec.

Abstract

Severe acute respiratory syndrome coronavirus 2 (SARS-CoV-2) infection produces B cell responses that continue to evolve for at least a year. During that time, memory B cells express increasingly broad and potent antibodies that are resistant to mutations found in variants of concern1. As a result, vaccination of coronavirus disease 2019 (COVID-19) convalescent individuals with currently available mRNA vaccines produces high levels of plasma neutralizing activity against all variants tested1,2. Here we examine memory B cell evolution five months after vaccination with either Moderna (mRNA-1273) or Pfizer-BioNTech (BNT162b2) mRNA vaccine in a cohort of SARS-CoV-2-naive individuals. Between prime and boost, memory B cells produce antibodies that evolve increased neutralizing activity, but there is no further increase in potency or breadth thereafter. Instead, memory B cells that emerge five months after vaccination of naive individuals express antibodies that are similar to those that dominate the initial response. While individual memory antibodies selected over time by natural infection have greater potency and breadth than antibodies elicited by vaccination, the overall neutralizing potency of plasma is greater following vaccination. These results suggest that boosting vaccinated individuals with currently available mRNA vaccines will increase plasma neutralizing activity but may not produce antibodies with equivalent breadth to those obtained by vaccinating convalescent individuals.


Conflict of interest statement

The Rockefeller University has filed a provisional patent application in connection with this work on which M.C.N. is an inventor (US patent 63/021,387). The patent has been licensed by Rockefeller University to Bristol Meyers Squibb.

Figures

Fig. 1
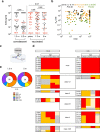
Fig. 1. Plasma ELISAs and neutralizing activity.
a, Graph showing area under the curve (AUC) for plasma IgG binding to SARS-CoV-2 RBD after prime and 1.3 and 5 months (m) after the second vaccine dose for n = 32 paired samples. Samples without a prime value are shown in black. b, NT50 values in plasma from pre-pandemic controls (Ctr, n = 3), convalescent individuals 1.3 months (ref. ) and 6.2 months (ref. ) after infection (grey), and vaccinated individuals (n = 32) after prime and 1.3 and 5 months after receiving two doses of mRNA vaccine. Samples without a prime value are shown in black. c, NT50 values (y axis) versus age (x axis) in n = 32 individuals after prime (black) and 1.3 months (orange) or 5 months (green) after boosting with an mRNA vaccine. d, Graph showing NT50 values (y axis) versus days after boost (x axis) in n = 32 individuals receiving two doses of an mRNA vaccine. Samples without a prime value are shown in black. e, Plasma neutralizing activity against the indicated SARS-CoV-2 variants of interest/concern (n = 15 paired samples at 1.3 and 5 months after full vaccination). Refer to the Methods for a list of all substitutions, deletions and insertions in the spike variants. All experiments were performed at least in duplicate. Red bars and values in a, b and e represent geometric mean values. Statistical significance in a, b and e was determined by two-tailed Kruskal–Wallis test with subsequent Dunn’s multiple-comparisons test and in c and d was determined by two-tailed Spearman correlation test.
Fig. 2
Fig. 2. Anti-SARS-CoV-2 RBD B cells after vaccination.
a, b, Graphs summarizing the number of Wuhan-Hu-1 RBD (WT)-specific memory B cells (a) and the number of antigen-specific memory B cells cross-reactive with both WT and K417N/E484K/N501Y mutant RBD (b) per 10 million B cells for n = 32 individuals after prime and 1.3 and 5 months after full vaccination. Samples without a prime value are shown in black. c, Pie charts showing the distribution of IgG antibody sequences obtained for memory B cells from three representative individuals after prime and 1.3 and 5 months after the boost. Additional pie charts can be found in Extended Data Fig. 3. The number inside the circle indicates the number of sequences analysed for the individual denoted above the circle, with Pfizer-BioNTech vaccine indicated by (P) and Moderna vaccine indicated by (M). Pie slice size is proportional to the number of clonally related sequences. The black outline and associated numbers indicate the percentage of clonally expanded sequences detected at each time point. Coloured slices indicate persisting clones (same IGHV and IGLV genes, with highly similar complementarity-determining region 3 sequences (CDR3s)) found at more than one time point within the same individual, grey slices indicate clones unique to the time point and white slices indicate repeating sequences isolated only once per time point. d, Number of nucleotide (nt) somatic hypermutations (SHM) in IGHV and IGLV genes combined (n = 2,050; Supplementary Table 4) in the antibodies illustrated in c and Extended Data Fig. 3, compared with the number of mutations obtained 1.3 months (ref. ) and 6.2 months (ref. ) after infection (grey). Horizontal bars and red numbers indicate the mean value at each time point. Samples without a prime value are shown in black. Statistical significance in a, b and d was determined by two-tailed Kruskal–Wallis test with subsequent Dunn’s multiple-comparisons test.
Fig. 3
Fig. 3. Anti-SARS-CoV-2 RBD monoclonal antibodies.
ac, Graphs showing the anti-SARS-CoV-2 neutralizing activity of monoclonal antibodies measured by SARS-CoV-2-pseudotyped virus neutralization assays using WT (Wuhan-Hu-1; ref. ) SARS-CoV-2 pseudovirus,. IC50 values for all antibodies (a), persisting clones (b) and unique clones (c) isolated from convalescent individuals 1.3 months (ref. ) and 6.2 months (ref. ) after infection or from vaccinated individuals after prime and 1.3 and 5 months after the boost are shown. Each dot represents one antibody; 451 total antibodies were tested, including the 430 reported herein (Supplementary Table 5) and 21 previously reported antibodies. Antibodies isolated from samples without a prime value are shown in black. Pie charts illustrate the fraction of non-neutralizing (IC50 > 1,000 ng ml–1) antibodies (grey slices); the inner circle shows the number of antibodies tested per group. Horizontal bars and red numbers indicate geometric mean values. Statistical significance was determined by two-tailed Kruskal–Wallis test with subsequent Dunn’s multiple-comparisons test and for ring plots was determined by two-tailed Fisher’s exact test with subsequent Bonferroni correction. All experiments were performed at least twice.
Fig. 4
Fig. 4. Affinity and breadth.
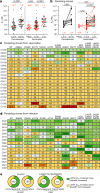
a, b, Graphs showing antibody dissociation constant (Kd) values for Wuhan-Hu-1 RBD measured by BLI. a, Antibodies isolated from convalescent individuals 1.3 months (n = 42) and 6.2 months (n = 45) after infection or from vaccinated individuals after prime (n = 36) and 1.3 months (n = 74) and 5 months (n = 43) after the second vaccination. b, Clonally paired antibodies isolated from convalescent individuals 1.3 months (ref. ) and 6.2 months (ref. ) after infection (n = 15) or vaccinated individuals at prime and 1.3 months (n = 3), at prime and 5 months (n = 3), or at 1.3 and 5 months after full vaccination (n = 26). Antibodies isolated from samples without a prime value are shown in black. Red horizontal bars and numbers indicate median values. c, d, Heat maps showing inhibitory concentrations of antibodies isolated 5 months after vaccination (c) or 6.2 months (ref. ) after infection (d) normalized to their shared clone isolated 1.3 months after vaccination (c) or 1.3 months (ref. ) after infection (d), expressed as %IC50, against the indicated WT or mutant SARS-CoV-2 pseudoviruses (Supplementary Table 8). Antibodies with improved (<30%) IC50 compared with their clonal relative isolated at an earlier time point are shown in shades of green with the most improved antibodies in dark green. Antibodies with worse (>300%) IC50 than their clonal relative isolated at an earlier time point are shown in red with the most worsened antibodies in dark red. Antibodies for which IC50 did not change by more than around 3-fold are shown in yellow. e, Pie charts illustrating the fraction of antibodies showing improved (<30%, green) versus not improved (yellow) IC50 values compared with their clonal relative isolated at an earlier time point. The inner circle shows the number of antibody–mutant combinations analysed per group. Statistical significance in a and b was determined using two-tailed Kruskal–Wallis test with subsequent Dunn’s multiple-comparisons test and in e was determined by two-tailed Fisher’s exact test with subsequent Bonferroni correction.
Extended Data Fig. 1
Extended Data Fig. 1. Plasma ELISA and neutralization.
a,b, Graph shows area under the curve (AUC, Y-axis) for plasma IgM (a) or IgA (b) antibody binding to SARS-CoV-2 RBD after prime, and 1.3- and 5-months post-boost for paired samples from n=32 vaccinated individuals. Samples without a prime value are shown in black. c, Graph shows plasma IgG antibody binding (AUC, Y-axis) plotted against age (X-axis) after prime (black), and 1.3 months (orange) and 5 months (green) post-second vaccination in n=32 vaccinated individuals. d, Graph shows age (years, X-axis) vs. fold-change of IgG-binding titers (AUC, Y-Axis) between prime and 1.3m (orange) or 5m (green) post-boost in n=32 vaccinated individuals. e, Graph shows plasma IgG antibody binding AUC values (Y-axis) plotted against time after vaccination (day, X-axis) from n=32 vaccinated individuals. Samples without a prime value are shown in black. f, IgG antibody binding after prime (AUC, X-axis) vs. IgG antibody binding after 1.3 months post-boost (AUC, Y-axis) (n=26). g, NT50 values after prime (X-axis) vs. NT50 values after 1.3 months post-boost (Y-axis) in individuals receiving two doses of an mRNA vaccine (n=26). h, NT50 values after prime and 1.3 months post-boost in females and males receiving 2 doses of an mRNA vaccine (n=26).i, Graph shows age (years, X-axis) vs fold-change of NT50 (X-axis) between prime and 1.3m (orange) or 5m (green) post-boost (n=26). j, NT50 values (Y-axis) vs. IgG antibody binding (AUC, X-axis) 1.3 months after 2 doses of an mRNA vaccine (n=26). k, NT50 values (Y-axis) vs. IgG antibody binding (AUC, X-axis) 5 months after boost in individuals receiving two doses of an mRNA vaccine (n=28). l, Ratio of anti-RBD IgG antibody (AUC) to NT50 values (Y-axis) plotted for convalescent infected individuals (grey) 1.3m3 or 6.2m7 after infection, and from n=32 vaccinated individuals after the prime, and 1.3m and 5m after receiving 2 doses of an mRNA vaccine. Samples without a prime value are shown in black. All experiments were performed at least in duplicate. Red values or bar in a, b, h and l represent geometric mean values. Statistical significance in a, b, h, and l was determined by two-tailed Kruskal-Wallis test with subsequent Dunn’s multiple comparisons, or by two-tailed Spearman correlation test in c, d, e, f, g, i, j, and k.
Extended Data Fig. 2
Extended Data Fig. 2. Flow Cytometry.
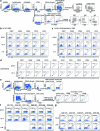
a, Gating strategy for phenotyping. Gating was on singlets that were CD19+ or CD20+ and CD3-CD8-CD16-Ova-. Anti-IgG, IgM, IgA, IgD, CD71 and CD27 antibodies were used for B cell phenotype analysis. Antigen-specific cells were detected based on binding to RBD WT-PE+ and RBD WT/KEN (K417N/E484K/N501Y)-AF647+. b-c, Flow cytometry plots showing the frequency of b, RBD WT-binding memory B cells, and c, RBD-binding memory B cells cross-reactive with WT and K417N/E484K/N501Y mutant RBD in 5 selected individuals, after prime, 1.3 months, and 5 months post-second vaccination. d, Flow cytometry plots showing frequency of RBD-binding plasmablasts, in 10 selected vaccinees after prime or 1.3 months post-boost. e, Gating strategy for single-cell sorting for CD20+ memory B cells (top panel) or CD19+CD20- plasmablasts (bottom panel) which were double positive for RBD-PE and RBD-AF647. f-g, Representative flow cytometry plots showing dual AlexaFluor-647-RBD and PE-RBD-binding, single-cell sorted B cells from f, 6 individuals after prime and 1.3 months or 5 months post-boost and g, 5 individuals from 1.3- or 5-months post-boost. Percentage of RBD-specific B cells is indicated.
Extended Data Fig. 3
Extended Data Fig. 3. anti-SARS-CoV-2 RBD-specific plasmablast and memory B cells responses after vaccination.
a-b, Graph showing the a, frequency of IgM, IgG, or IgA isotype expression by Wuhan-Hu RBD-specific memory B cells after prime or 1.3 months post-boost (n=10), and b, number of Wuhan-Hu RBD-binding plasmablasts per 10 million B cells (n=26) after prime or 1.3 months post-boost. Red numbers indicate geometric means. Gating strategy is in Extended Data Fig. 2. c-e, Pie charts show the distribution of IgG antibody sequences obtained from c, 6 individuals after prime (upper panel) or 1.3 months post-boost (lower panel). Sequences derived from IgG plasmablast (PB), IgM memory B cells (MBC), and IgG MBC compartments were analyzed after prime, while only IgG MBCs were analyzed at 1.3 months after boost, as indicated to the left of the plots. Pie charts showing only IgG memory B cells from 8 individuals (in additional to the 3 vaccinees shown in Fig. 2c) after d, prime and 1.3-months post-boost and e, 1.3- and 5-months post-boost. The number inside the circle indicates the number of sequences analyzed for the individual denoted above the circle, with Pfizer vaccinees indicated by (P) and Moderna by (M). Pie slice size is proportional to the number of clonally related sequences. The black outline and associated numbers indicate the percentage of clonally expanded sequences detected at each time point. Colored slices indicate persisting clones (same IGHV and IGLV genes, with highly similar CDR3s) found at more than one timepoint within the same individual. Grey slices indicate clones unique to the timepoint. White slices indicate repeating sequences isolated only once per time point. f, Graph shows the relative percentage of clonal sequences of IgG memory B cells at each time point from n=11 vaccinated inviduals illustrated in Fig. 2c and Extended Data Fig. 3d, e. The red numbers indicate the geometric means. Samples without a prime value are shown in black. g, Graph shows the percentage of total paired-sequences from IgG memory B cells (n=2050) analyzed at either prime, 1.3- or 5-months post-boost, that can be found as part of all clones (black bars), persisting clones (red bars), unique clones (grey bars), or singlets (white bar). h-i, Ratio of the number of somatic nucleotide mutations over the nucleotide length of the V gene in the Ig heavy and light chains, separately, in antibodies detected in h, different B cell compartments after prime or 1.3 months post-boost (n=1565) and i, IgG memory B cells at 1.3 or 5 months post-boost (n=1610) compared to convalescent infected (grey) individuals after 1.33 and 6.27 months post-infection (also Supplementary Table 4). Horizontal bars and red numbers indicate mean ratio in each compartment at each time point. Sequences derived from samples without a prime value are shown in black. Statistical significance in a and b was determined using a two-tailed Wilcoxon matched-pairs signed rank test. f, h, and i was determined by two-tailed Kruskal Wallis test with subsequent Dunn’s multiple comparisons.
Extended Data Fig. 4
Extended Data Fig. 4. Frequency distribution of human V genes.
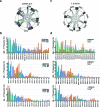
a, Circos plot depicting relationship between antibodies that share V and J gene usage in both IgH and IgL when comparing prime/1.3m IgG MBC sequences. Purple, green, and grey lines connect related clones, clones and singlets, and singlets to each other, respectively. b, Graph shows relative abundance of human heavy chain IGHV (top), light chain IGKV (middle) or IGLV (bottom) genes comparing Sequence Read Archive accession SRP010970 (orange), and IgG MBCs after prime (blue) or 1.3 months post-boost (green). Statistical significance was determined by two-sided binomial test. * = p≤0.05, ** = p≤0.01, *** = p≤0.001, **** = p≤0.0001. Color of stars indicates: black - comparing Database versus Prime; blue - comparing Database versus 1.3m; red - comparing Prime versus 1.3m. c, Circos plot depicting relationship between antibodies that share V and J gene usage in both IgH and IgL when comparing 1.3 m/5 m IgG MBC sequences. Purple, green, and grey lines connect related clones, clones and singlets, and singlets to each other, respectively. d, Graph shows relative abundance of human heavy chain IGHV (top), light chain IGKV (middle) or IGLV (bottom) genes comparing Sequence Read Archive accession SRP010970 (orange), and IgG MBCs after 1.3 months (blue) or 5 months (green) post-vaccination. Statistical significance was determined by two-sided binomial test. * = p≤0.05, ** = p≤0.01, *** = p≤0.001, **** = p≤0.0001. Color of stars indicates: black - comparing Database versus 1.3 months; blue - comparing Database versus 5 months; red - comparing 1.3 months versus 5 months.
Extended Data Fig. 5
Extended Data Fig. 5. Somatic hypermutation of anti-SARS-CoV-2 RBD antibody clones after prime or boost.
Clonal evolution of RBD-binding B cells from 3 individuals for which plasmablasts, IgM memory B cells, and IgG memory B cells were analyzed after prime, and IgG memory B cells were analyzed after 1.3 months post-boost (as described in Extended Data Fig. 3). The number of somatic nucleotide mutations found in shared clonal families found in at least 2 different compartments is graphed to the right of each donut plot. Color of dot plots match the color of pie slices within the donut plot, which indicate persisting clones. nd – clone was Not Detected in the indicated compartment. Black horizontal line indicates median number of SHM.
Extended Data Fig. 6
Extended Data Fig. 6. Anti-SARS-CoV-2 RBD monoclonal antibodies ELISAs.
a-e, Graphs show anti-SARS-CoV-2 binding activity of n=458 monoclonal antibodies measured by ELISA against RBD. ELISA half-maximal concentration (EC50) values for all antibodies (a), all clones (b), persisting clones (c), unique clones (d) and singlets (e) isolated from COVID-19 convalescent individuals 1.33 and 6.27 months after infection (left panel) or from vaccinated individuals after prime, or 1.3m or 5m after receiving the second dose of mRNA vaccination (right panel). Each dot represents one antibody. Antibodies isolated from samples without a prime value are shown in black. Red horizontal bars and numbers indicate geometric mean values. Statistical significance was determined by two-tailed Mann-Whitney test (left panels of a, b, d and e), two-tailed Kruskal-Wallis test with subsequent Dunn’s multiple comparisons (right panels of a-e) or by two-tailed Wilcoxon test (left panel of c). All experiments were performed at least twice.
Extended Data Fig. 7
Extended Data Fig. 7. Anti-SARS-CoV-2 RBD monoclonal antibodies.
a-c, Graphs show anti-SARS-CoV-2 neutralizing activity of monoclonal antibodies measured by a SARS-CoV-2 pseudotype virus neutralization assay using wild-type (Wuhan Hu-1) SARS-CoV-2 pseudovirus,. Half-maximal inhibitory concentration (IC50) values for antibodies from a, all clones and e, singlets isolated from COVID-19 convalescent individuals 1.33 and 6.27 months after infection or from vaccinated individuals after prime, and 1.3- or 5-months after 2 doses of vaccine. Each dot represents one antibody, where 451 total antibodies were tested including the 430 reported herein (Supplementary Table 5), and 21 previously reported antibodies. Antibodies isolated from samples without a prime value are shown in black. Pie charts illustrate the fraction of non-neutralizing (IC50 > 1000 ng/ml) antibodies (grey slices), inner circle shows the number of antibodies tested per group. Horizontal bars and red numbers indicate geometric mean values. Statistical significance was determined by two-tailed Kruskal Wallis test with subsequent Dunn’s multiple comparisons, and for ring plots by two-tailed Fisher’s exact test with subsequent Bonferroni-correction. All experiments were performed at least twice.
Extended Data Fig. 8
Extended Data Fig. 8. Affinity and Epitope targeting of anti-SARS-CoV-2 RBD antibodies.
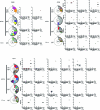
a, IC50 values for randomly selected antibodies isolated from convalescents 1.3m3 (n=42) and 6.2m7 (n=45) after infection or from vaccinees after prime (n=36), and 1.3m (n=74) and 5m (n=43). Red horizontal lines and numbers indicate geometric mean. Antibodies isolated from samples without a prime value are shown in black. b, Graphs show affinities (KD, Y-axis) plotted against neutralization activity (IC50, X-axis) for antibodies isolated after prime (black), or 1.3m (orange) or 5m (green) post-boost vaccination for antibodies showin in a. c, Schematic representation of the BLI experiment for randomly selected antibodies isolated from vaccinees 1.3- and 5 months after full vaccination (each presented group shows n=26 antibodies). d. Heat-map of relative inhibition of Ab2 binding to the preformed Ab1-RBD complexes (grey=no binding, yellow=low binding, orange=intermediate binding, red=high binding). Values are normalized through the subtraction of the autologous antibody control. BLI traces can be found in Extended Data Fig. 9. e. Pie charts indicate the fraction of antibodies that are assigned to different classes according to their binding pattern as shown in d and Extended data Fig. 9. Number in inner circle shows number of antibodies tested. Statistical significance was determined using a two-tailed Kruskal Wallis test with subsequent Dunn’s multiple comparisons in a and two-tailed Spearman correlation test in b, and a two-tailed Chi-square test in e.
Extended Data Fig. 9
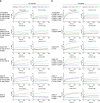
Extended Data Fig. 9. BLI traces from epitope mapping of anti-SARS-CoV-2 RBD antibodies.
a, b, BLI traces from competition experiments used to determine epitope targets of anti-SARS-CoV-2 RBD antibodies isolated from vaccinees at 1.3m (a) or 5m (b) post-boost, as illustrated in Extended Data Fig. 8.

References

    1. Wang, Z. et al. Naturally enhanced neutralizing breadth against SARS-CoV-2 one year after infection. Nature595, 426–431 (2021). - PMC - PubMed
    1. Goel, R. R. et al. Distinct antibody and memory B cell responses in SARS-CoV-2 naive and recovered individuals following mRNA vaccination. Sci. Immunol. 6, 10.1126/sciimmunol.abi6950 (2021). - PMC - PubMed
    1. Robbiani DF, et al. Convergent antibody responses to SARS-CoV-2 in convalescent individuals. Nature. 2020;584:437–442. doi: 10.1038/s41586-020-2456-9. - DOI - PMC - PubMed
    1. Apostolidis, S. A. et al. Altered cellular and humoral immune responses following SARS-CoV-2 mRNA vaccination in patients with multiple sclerosis on anti-CD20 therapy. Preprint at 10.1101/2021.06.23.21259389 (2021). - PMC - PubMed
    1. Sokal, A. et al. Memory B cells control SARS-CoV-2 variants upon mRNA vaccination of naive and COVID-19 recovered individuals. Preprint at 10.1101/2021.06.17.448459 (2021). - PMC - PubMed

Publication types

MeSH terms