. 2021 Oct 7;53(1):78.
doi: 10.1186/s12711-021-00661-y.

Haplotype genomic prediction of phenotypic values based on chromosome distance and gene boundaries using low-coverage sequencing in Duroc pigs

Affiliations

Haplotype genomic prediction of phenotypic values based on chromosome distance and gene boundaries using low-coverage sequencing in Duroc pigs

Cheng Bian et al. Genet Sel Evol. .

Abstract

Background: Genomic selection using single nucleotide polymorphism (SNP) markers has been widely used for genetic improvement of livestock, but most current methods of genomic selection are based on SNP models. In this study, we investigated the prediction accuracies of haplotype models based on fixed chromosome distances and gene boundaries compared to those of SNP models for genomic prediction of phenotypic values. We also examined the reasons for the successes and failures of haplotype genomic prediction.

Methods: We analyzed a swine population of 3195 Duroc boars with records on eight traits: body judging score (BJS), teat number (TN), age (AGW), loin muscle area (LMA), loin muscle depth (LMD) and back fat thickness (BF) at 100 kg live weight, and average daily gain (ADG) and feed conversion rate (FCR) from 30 to100 kg live weight. Ten-fold validation was used to evaluate the prediction accuracy of each SNP model and each multi-allelic haplotype model based on 488,124 autosomal SNPs from low-coverage sequencing. Haplotype blocks were defined using fixed chromosome distances or gene boundaries.

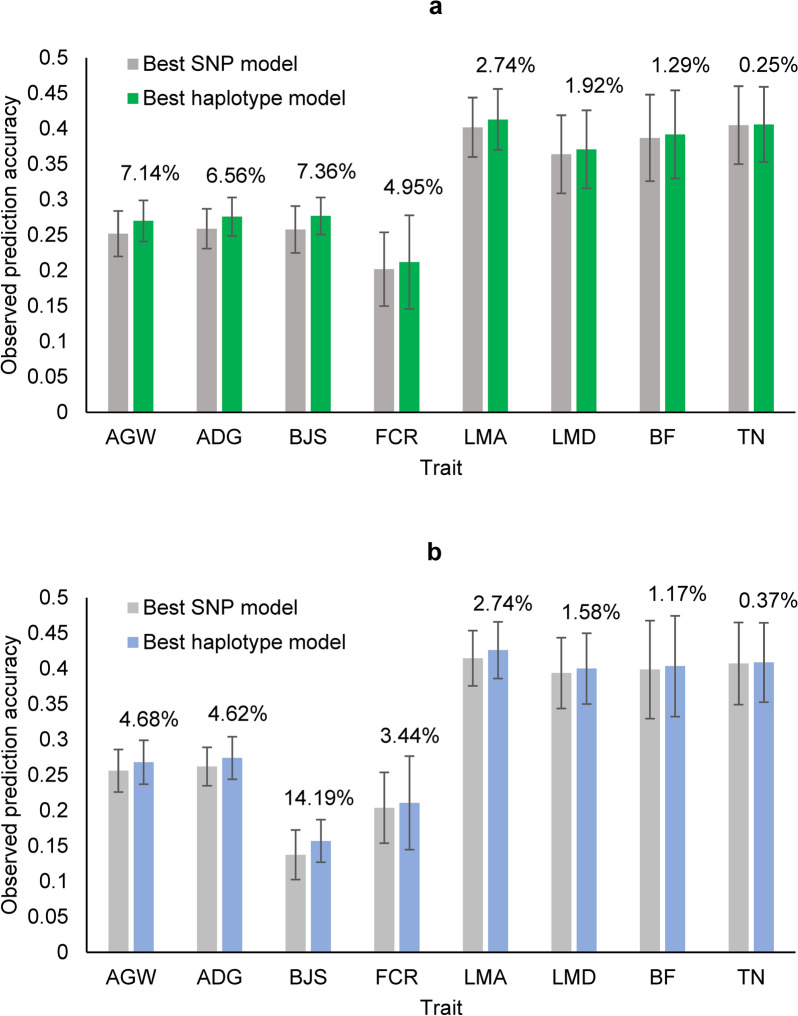
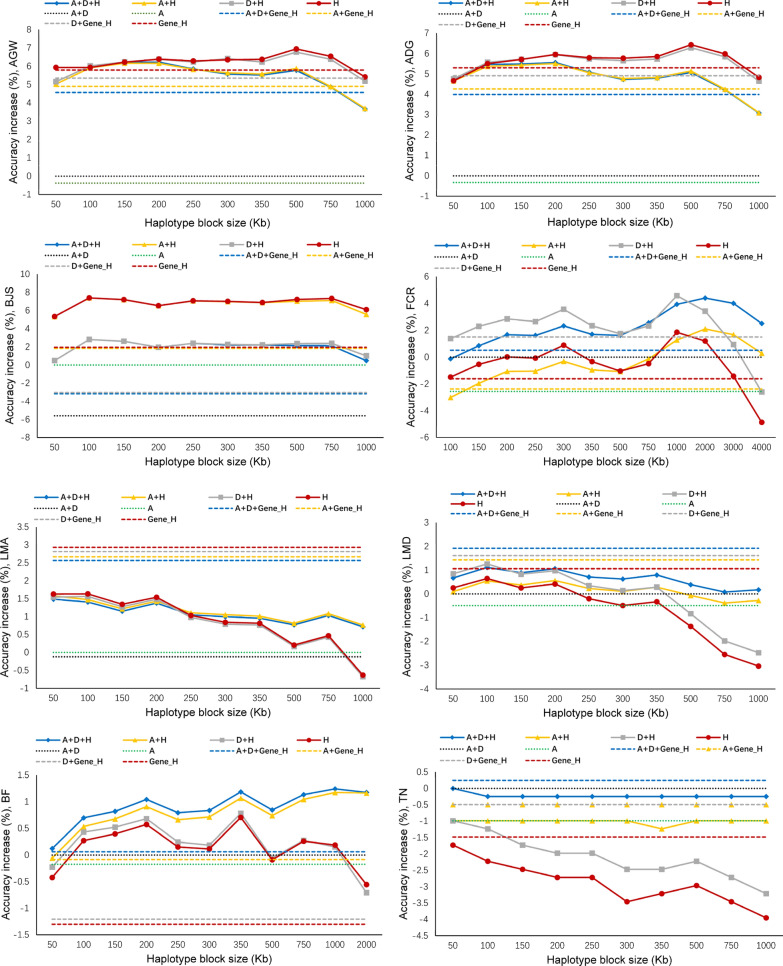
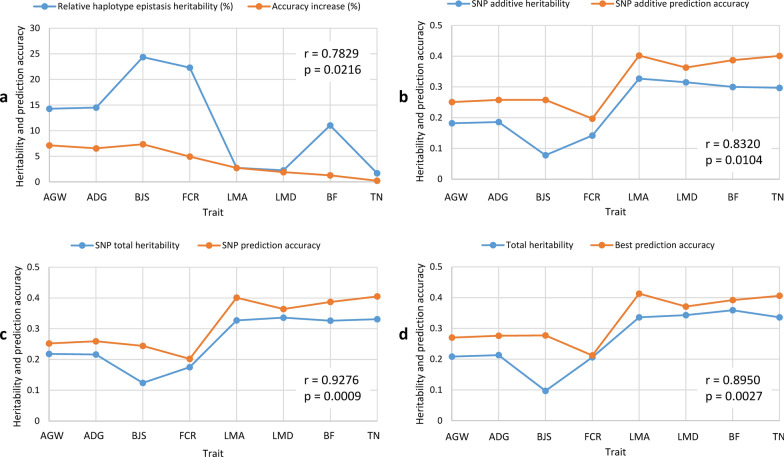
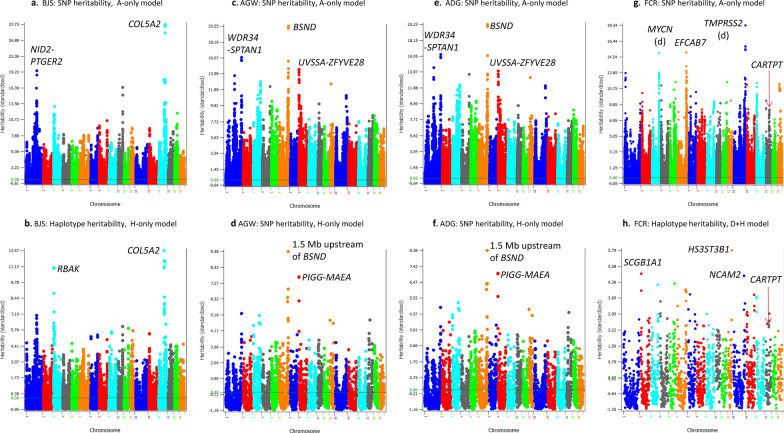
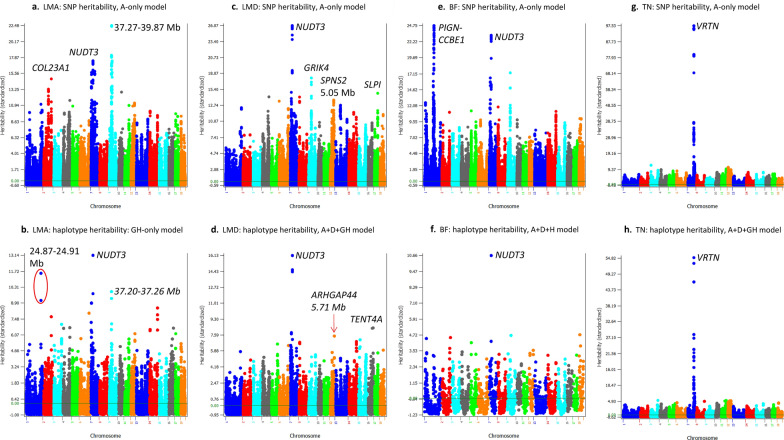
Results: Compared to the best SNP model, the accuracy of predicting phenotypic values using a haplotype model was greater by 7.4% for BJS, 7.1% for AGW, 6.6% for ADG, 4.9% for FCR, 2.7% for LMA, 1.9% for LMD, 1.4% for BF, and 0.3% for TN. The use of gene-based haplotype blocks resulted in the best prediction accuracy for LMA, LMD, and TN. Compared to estimates of SNP additive heritability, estimates of haplotype epistasis heritability were strongly correlated with the increase in prediction accuracy by haplotype models. The increase in prediction accuracy was largest for BJS, AGW, ADG, and FCR, which also had the largest estimates of haplotype epistasis heritability, 24.4% for BJS, 14.3% for AGW, 14.5% for ADG, and 17.7% for FCR. SNP and haplotype heritability profiles across the genome identified several genes with large genetic contributions to phenotypes: NUDT3 for LMA, LMD and BF, VRTN for TN, COL5A2 for BJS, BSND for ADG, and CARTPT for FCR.

Conclusions: Haplotype prediction models improved the accuracy for genomic prediction of phenotypes in Duroc pigs. For some traits, the best prediction accuracy was obtained with haplotypes defined using gene regions, which provides evidence that functional genomic information can improve the accuracy of haplotype genomic prediction for certain traits.


Conflict of interest statement

The authors declare that they have no competing interests.

Figures

Fig. 1
Fig. 1
Observed prediction accuracy of the best haplotype model relative to the best SNP model for predicting phenotypic values of each trait from ten-fold validations. a Observed prediction accuracy using the original phenotypic values of the validation populations. b Observed prediction accuracy using the corrected phenotypic values of the validation populations. The error bar is one standard deviation above and below the average prediction accuracy, where standard deviation was calculated from tenfold validations. AGW age at 100 kg live weight, ADG daily gain during, BJS body judging score, FCR Feed conversion ratio, LMA loin muscle area at 100 kg, LMD loin muscle depth at 100 kg, BF back fat thickness at 100 kg, TN teat number
Fig. 2
Fig. 2
Observed prediction accuracy of haplotype models using fixed chromosome distance and gene boundaries per haplotype block. A = SNP additive values. D = SNP dominance values. H = haplotype additive values. Gene_H = gene-based haplotype additive values. AGW age at 100 kg live weight, ADG daily gain during, BJS body judging score, FCR Feed conversion ratio, LMA loin muscle area at 100 kg, LMD loin muscle depth at 100 kg, BF back fat thickness at 100 kg, TN teat number
Fig. 3
Fig. 3
Relationship between observed prediction accuracy and heritability estimates. a Correlation between relative increase in prediction accuracy due to haplotypes and relative haplotype epistasis heritability. b Correlation between prediction accuracy of the best haplotype model and total heritability that can be haplotype heritability only or a combination of haplotype and SNP heritabilities. c Correlation between prediction accuracy of the SNP model with additive and dominance values and the SNP total heritability as a summation of additive and dominance heritabilities. d Correlation between prediction accuracy of the SNP model with additive values and SNP additive heritability. AGW age at 100 kg live weight, ADG daily gain duringv BJS body judging score, FCR Feed conversion ratio, LMA loin muscle area at 100 kg, LMD loin muscle depth at 100 kg, BF back fat thickness at 100 kg, TN teat number
Fig. 4
Fig. 4
Heritability profiles of SNPs and haplotypes for body judging score (BJS), age at 100 kg live weight (AGW), average daily gain (ADG), and feed conversion ratio (FCR). a SNP heritability profile of BJS; b Haplotype heritability profile of BJS; c SNP heritability profile AGW; d Haplotype heritability profile of ADG; e SNP heritability profile of average daily gain ADG; f Haplotype heritability profile of ADG; g SNP heritability profile of FCR; and h Haplotype heritability profile of FCR
Fig. 5
Fig. 5
Heritability profiles of SNPs and haplotypes for loin muscle area (LMA), loin muscle depth (LMD), backfat (BF), and teat number (TN). a SNP heritability profile of LMA; b Haplotype heritability profile of LMA; c SNP heritability profile of LMD; d Haplotype heritability profile of LMD; e SNP heritability profile of BF; f Haplotype heritability profile of BF; g SNP heritability profile of TN; h Haplotype heritability profile of TN

References

    1. Calus M, Meuwissen TH, De Roos A, Veerkamp R. Accuracy of genomic selection using different methods to define haplotypes. Genetics. 2008;178:553–561. doi: 10.1534/genetics.107.080838. - DOI - PMC - PubMed
    1. Villumsen TM, Janss L, Lund MS. The importance of haplotype length and heritability using genomic selection in dairy cattle. J Anim Breed Genet. 2009;126:3–13. doi: 10.1111/j.1439-0388.2008.00747.x. - DOI - PubMed
    1. Boichard D, Guillaume F, Baur A, Croiseau P, Rossignol MN, Boscher MY, et al. Genomic selection in French dairy cattle. Anim Prod Sci. 2012;52:115–120. doi: 10.1071/AN11119. - DOI
    1. Jiang Y, Schmidt RH, Reif JC. Haplotype-based genome-wide prediction models exploit local epistatic interactions among markers. G3 (Bethesda) 2018;8:1687–1699. doi: 10.1534/g3.117.300548. - DOI - PMC - PubMed
    1. Jónás D, Ducrocq V, Croiseau P. The combined use of linkage disequilibrium–based haploblocks and allele frequency–based haplotype selection methods enhances genomic evaluation accuracy in dairy cattle. J Dairy Sci. 2017;100:2905–2908. doi: 10.3168/jds.2016-11798. - DOI - PubMed

LinkOut - more resources