

Altered resting-state functional connectome in major depressive disorder: a mega-analysis from the PsyMRI consortium
- PMID: 34620830
- PMCID: PMC8497531
- DOI: 10.1038/s41398-021-01619-w
Altered resting-state functional connectome in major depressive disorder: a mega-analysis from the PsyMRI consortium
Abstract
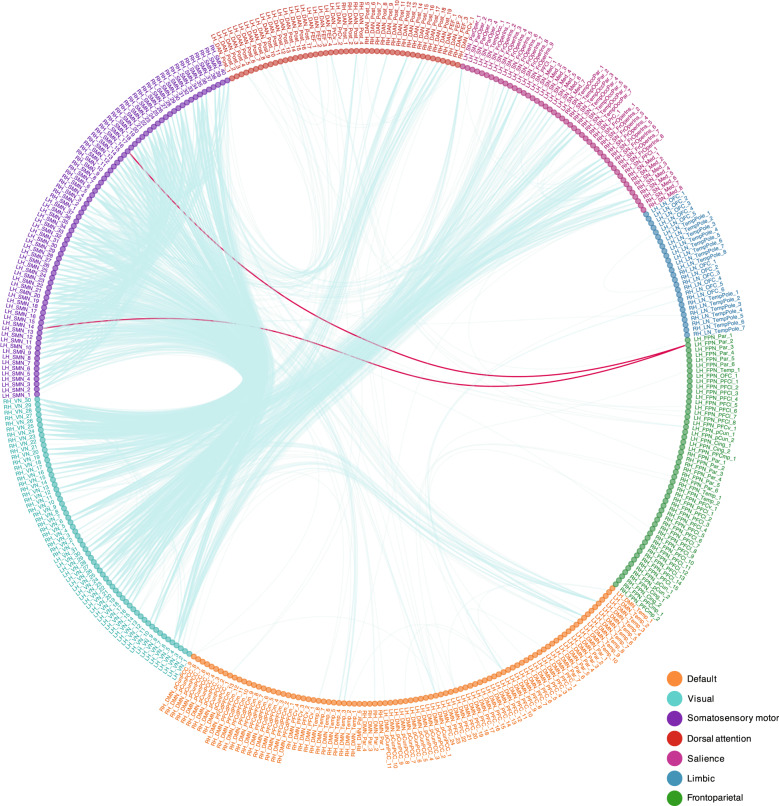
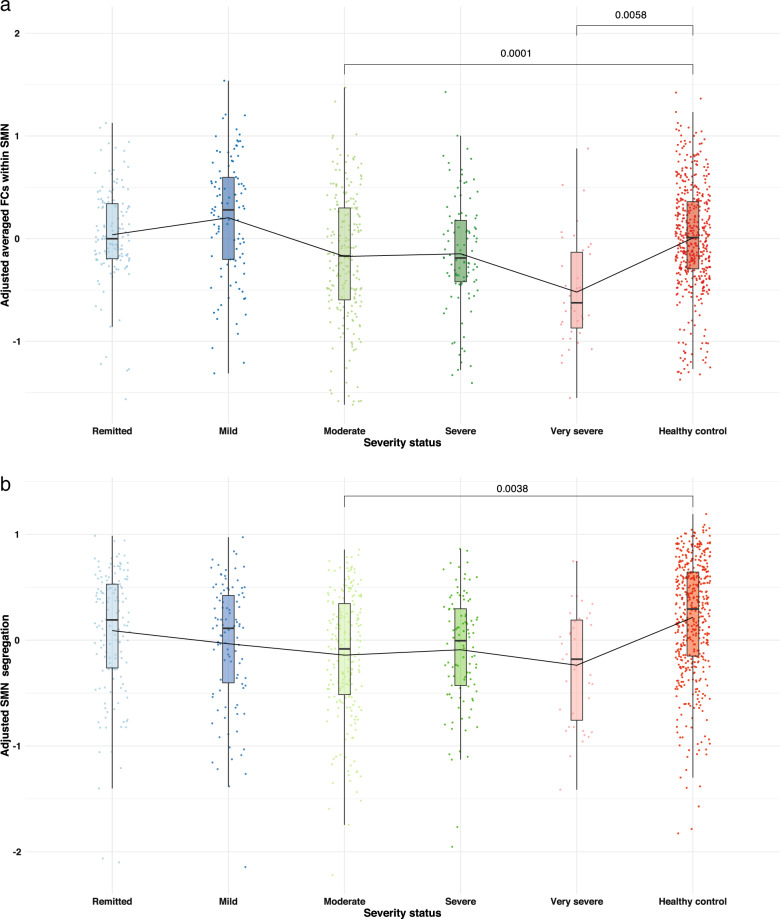
Major depressive disorder (MDD) is associated with abnormal neural circuitry. It can be measured by assessing functional connectivity (FC) at resting-state functional MRI, that may help identifying neural markers of MDD and provide further efficient diagnosis and monitor treatment outcomes. The main aim of the present study is to investigate, in an unbiased way, functional alterations in patients with MDD using a large multi-center dataset from the PsyMRI consortium including 1546 participants from 19 centers ( www.psymri.com ). After applying strict exclusion criteria, the final sample consisted of 606 MDD patients (age: 35.8 ± 11.9 y.o.; females: 60.7%) and 476 healthy participants (age: 33.3 ± 11.0 y.o.; females: 56.7%). We found significant relative hypoconnectivity within somatosensory motor (SMN), salience (SN) networks and between SMN, SN, dorsal attention (DAN), and visual (VN) networks in MDD patients. No significant differences were detected within the default mode (DMN) and frontoparietal networks (FPN). In addition, alterations in network organization were observed in terms of significantly lower network segregation of SMN in MDD patients. Although medicated patients showed significantly lower FC within DMN, FPN, and SN than unmedicated patients, there were no differences between medicated and unmedicated groups in terms of network organization in SMN. We conclude that the network organization of cortical networks, involved in processing of sensory information, might be a more stable neuroimaging marker for MDD than previously assumed alterations in higher-order neural networks like DMN and FPN.
© 2021. The Author(s).
Conflict of interest statement
SG has served as consultant to and received research support from Boehringer Ingelheim. MW performed studies with institutional research support from HEEL and from Janssen Pharmaceutical Research for an IIT on ketamine in patients with MDD, which is unrelated to this investigation. MW has not received any personal financial compensation from third parties. All other co-authors declared no conflict of interests.
Figures
References
-
- American Psychiatric Association, A. P. Diagnostic and statistical manual of mental disorders (DSM-5®). Washington: American Psychiatric Pub; 2013.
Publication types
MeSH terms
Grants and funding
LinkOut - more resources
Full Text Sources
Miscellaneous
