. 2021 Oct 7;12(1):5890.
doi: 10.1038/s41467-021-25957-x.

Efficient and precise single-cell reference atlas mapping with Symphony

Affiliations

Efficient and precise single-cell reference atlas mapping with Symphony

Joyce B Kang et al. Nat Commun. .

Abstract

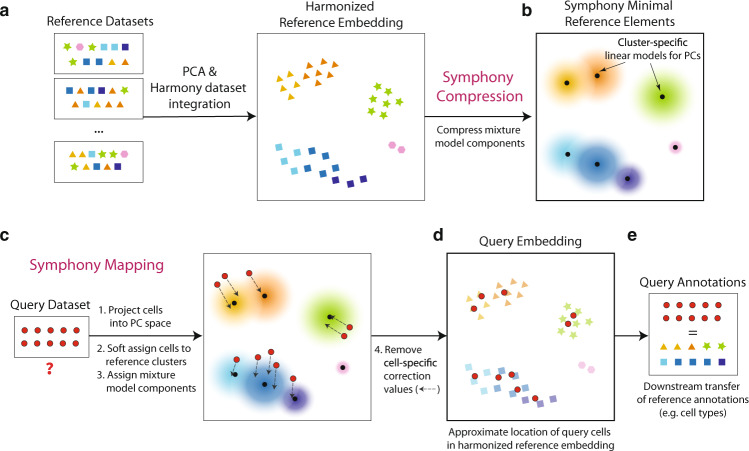
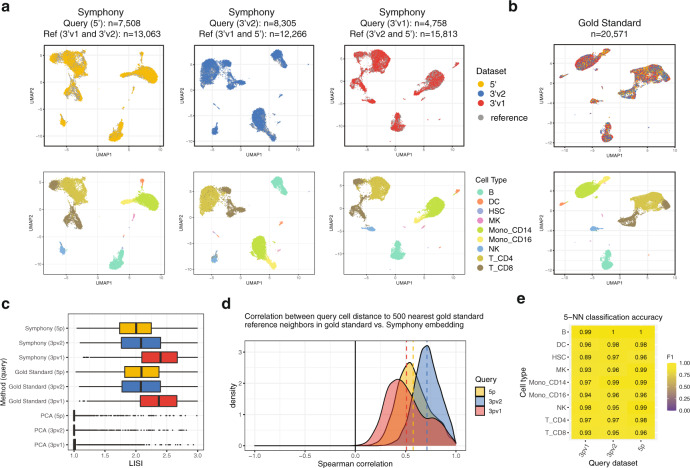
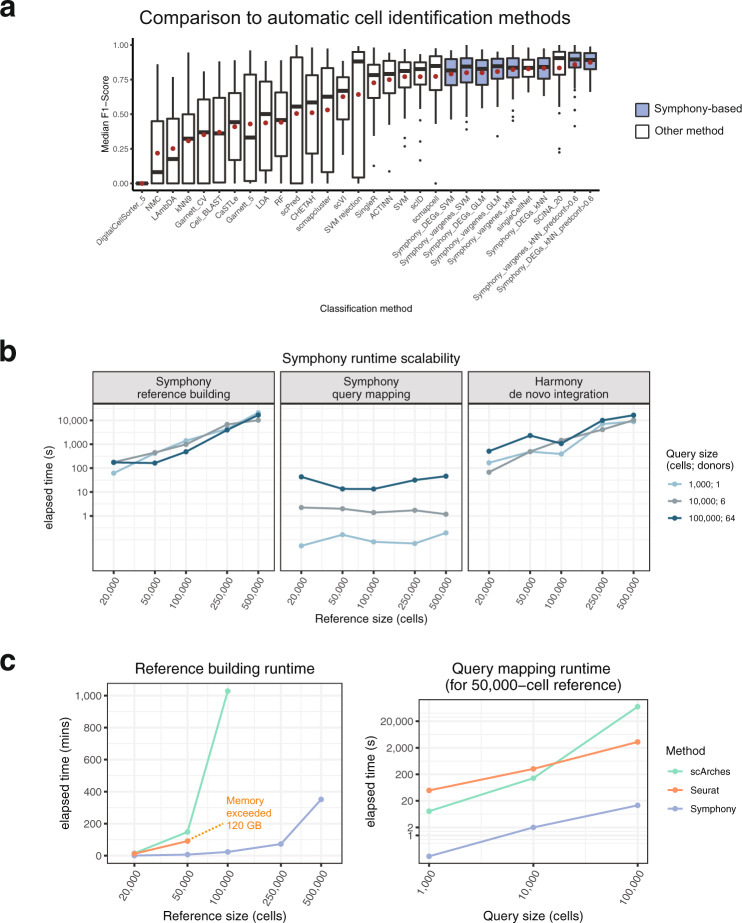
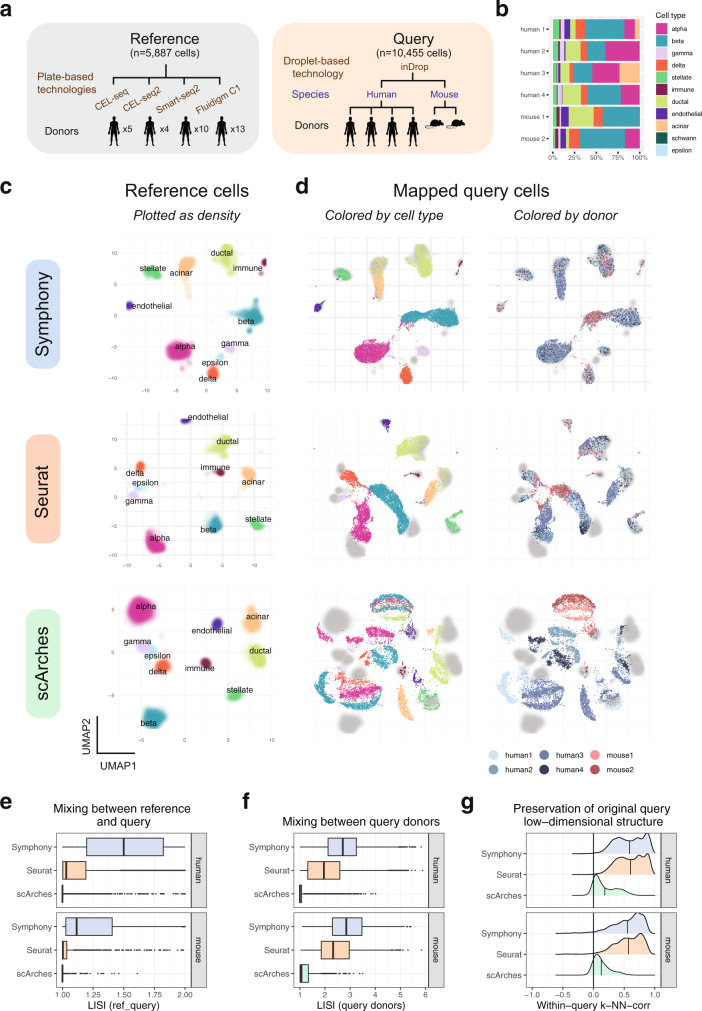
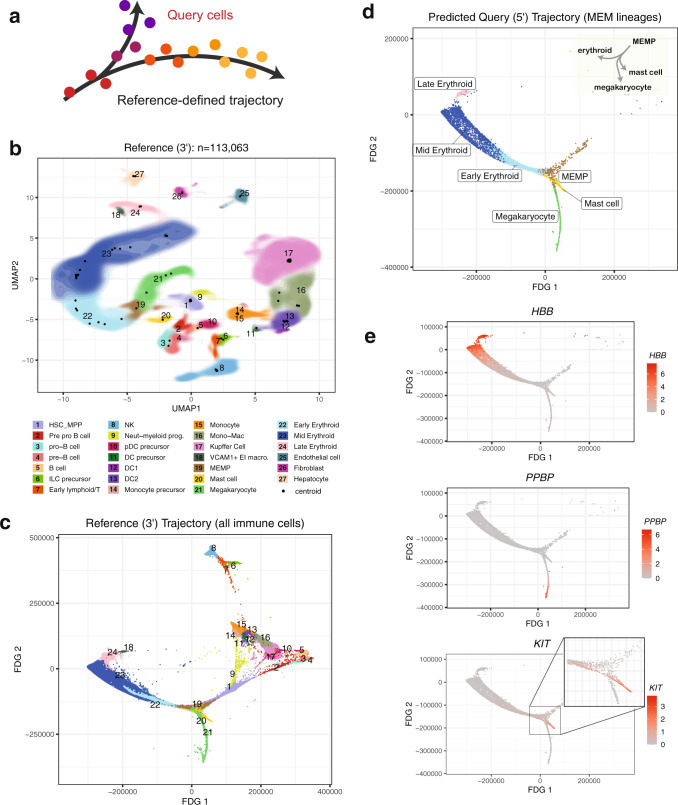
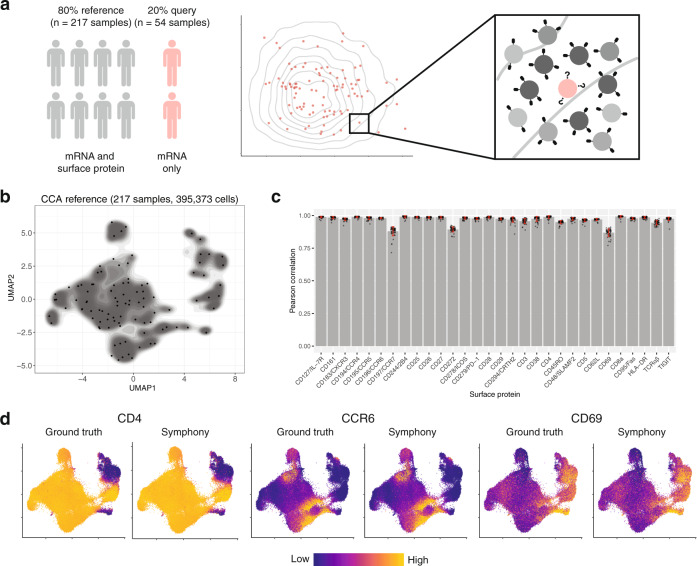
Recent advances in single-cell technologies and integration algorithms make it possible to construct comprehensive reference atlases encompassing many donors, studies, disease states, and sequencing platforms. Much like mapping sequencing reads to a reference genome, it is essential to be able to map query cells onto complex, multimillion-cell reference atlases to rapidly identify relevant cell states and phenotypes. We present Symphony ( https://github.com/immunogenomics/symphony ), an algorithm for building large-scale, integrated reference atlases in a convenient, portable format that enables efficient query mapping within seconds. Symphony localizes query cells within a stable low-dimensional reference embedding, facilitating reproducible downstream transfer of reference-defined annotations to the query. We demonstrate the power of Symphony in multiple real-world datasets, including (1) mapping a multi-donor, multi-species query to predict pancreatic cell types, (2) localizing query cells along a developmental trajectory of fetal liver hematopoiesis, and (3) inferring surface protein expression with a multimodal CITE-seq atlas of memory T cells.


Conflict of interest statement

S.R. receives research support from Biogen. I.K. does bioinformatics consulting for Brilyant Inc. No other authors have competing interests.

Figures

Fig. 1
Fig. 1. Symphony overview.
Symphony comprises two algorithms: Symphony compression (a, b) and Symphony mapping (c, d). a To construct a reference atlas, cells (colored shapes) from multiple datasets are embedded in a lower-dimensional space (e.g., PCA), in which dataset integration (Harmony) is performed to remove dataset-specific effects. Shape indicates distinct cell types, and color indicates finer-grained cell states. b Symphony compression represents the information captured within the harmonized reference in a concise, portable format based on computing summary statistics for the reference-dependent components of the linear mixture model. Symphony returns the minimal reference elements needed to efficiently map new query cells to the reference. c Given an unseen query dataset (red circles) and compressed reference, Symphony mapping precisely localizes the query cells to their appropriate locations within the integrated reference embedding (d). Reference cell locations do not change during mapping. e The resulting joint embedding can be used for downstream transfer of reference-defined annotations to the query cells.
Fig. 2
Fig. 2. Symphony approximates de novo integration without reintegration of the reference cells.
Three PBMC datasets were sequenced with different 10x protocols: 5’ (yellow, n = 7508 cells), 3’v2 (blue, n = 8305 cells), and 3’v1 (red, n = 4758 cells). We ran Symphony three times, each time mapping one dataset onto a reference built from integrating the other two. a Symphony embeddings generated across the three mapping experiments (columns). Top row: cells colored by query (yellow, blue, or red) or reference (gray), with query cells plotted in front. Bottom row: cells colored by cell type: B cells (B), dendritic cells (DC), hematopoietic stem cells (HSC), megakaryocytes (MK), CD14 + or CD16 + monocytes (Mono_CD14, Mono_CD16), natural killer cells (NK), or CD4 + or CD8 + T cells (T_CD4, T_CD8), with query cells plotted in front. b For comparison, gold standard de novo Harmony embedding colored by dataset (top) and cell type (bottom). c Distribution of technology LISI scores for query cell neighborhoods in the Symphony, gold standard, and a standard PCA embeddings on all cells, colored by query dataset. Boxplot center line represents the median; lower and upper box limits represent the 25% and 75% quantiles, respectively; whiskers extend to box limit ±1.5 × IQR; outlying points plotted individually. d Distributions of k-NN-corr (Spearman correlation between the distances between the neighbor-pairs in the gold standard embedding and the distances between the same neighbor-pairs in the Symphony embedding) across query cells for k = 500, colored by query dataset. Dotted vertical lines denote mean k-NN-corr. e Classification accuracy as measured by cell type F1-scores for query cell type annotation using 5-NN on the Symphony embedding.
Fig. 3
Fig. 3. Symphony matches performance of top supervised classifiers and maps to large references within seconds.
a Following the cross-technology PBMC benchmarking from Abdelaal et al., we ran a total of 48 train-test experiments per Symphony-based classifier. Two different versions of the Symphony feature embeddings were generated depending on variable gene selection method: top 2000 variable genes (vargenes) or top 20 differentially genes (DEGs) expressed per cell type. Symphony embeddings were used to train 3 downstream classifiers: k-NN (k = 5), SVM with radial kernel, and multinomial logistic regression (GLM) with ridge. Symphony (blue) median cell-type F1-scores across 48 train-test experiments compared to supervised methods (white), demonstrating comparability to top supervised methods and stable performance regardless of downstream classification method. For “predconf>0.6” options, only cells with >60% prediction confidence were included (4 out of 5 reference neighbors with winning vote). Boxplot center line represents the median (of median F1-scores); lower and upper box limits represent the 25% and 75% quantiles, respectively; whiskers extend to box limit ±1.5 × IQR; outlying points plotted individually. Red dot indicates mean of median F1-scores across 48 experiments (used for ordering along the x-axis). b Total elapsed time (in seconds) required to run Symphony reference building starting from gene expression (left), Symphony query mapping starting from query gene expression (middle), or de novo Harmony integration (right) for different-sized reference (x-axis) and query (colors) datasets downsampled from the memory T-cell CITE-seq dataset. c Runtime comparison between Symphony, Seurat, and scArches (colors), for building different-sized references (measured in mins) and mapping different-sized queries onto a 50,000-cell reference (measured in secs, plotted on log scale). Note: all methods were run on Linux CPUs (allotting 4 cores each for Symphony and Seurat, 48 cores for scArches). All jobs were allocated a maximum of 120 GB of memory and 24 h of runtime.
Fig. 4
Fig. 4. Symphony maps multi-donor, multi-species study to human pancreatic islet cell reference.
a Schematic of mapping experiment with reference (n = 5887 cells, 32 donors) built from four human pancreas datasets and query dataset (n = 10,455 cells, from four human donors and two mouse donors) sequenced on a new technology (inDrop). b Bar plot shows relative proportions of cell types per query donor. We integrated the reference datasets de novo using Harmony, Seurat anchor-based integration, or trVAE, then mapped the query onto the corresponding reference using Symphony, Seurat, or scArches, respectively. UMAP plots of the resulting joint embeddings showing c density of integrated reference cells colored by cell type and d individual query cells colored by cell type (as defined by Baron et al.) (left) or donor identity (right) with reference densities plotted in the back in gray. Degree of integration for each method was measured by LISI metric between reference and query labels (ref_query) (e) and LISI between query donors (f) for each query cell neighborhood, faceted by species (human: n = 8569 cells from four donors, mouse: n = 1866 cells from two donors). Boxplot center line represents the median; lower and upper box limits represent the 25% and 75% quantiles, respectively; whiskers extend to box limit ±1.5 × IQR; outlying points plotted individually. g Degree to which the query low-dimensional structure is preserved after mapping, as measured by within-query k-NN correlation (wiq-kNN-corr, with k = 500) calculated across all query cells, within each query donor. Vertical lines indicate the mean wiq-kNN-corr.
Fig. 5
Fig. 5. Localizing query cells along a trajectory of fetal liver hematopoiesis.
a Schematic showing precise placement of query cells along a continuous reference-defined trajectory. In this example (be), the reference (n = 113,063 cells, 14 donors) was sequenced using 10 x 3’ chemistry, and the query (n = 25,367 cells, 5 donors) was sequenced with 10x 5’ chemistry. b Symphony reference colored by cell types as defined by Popescu et al.. Contour fill represents density of cells. Black points represent soft-cluster centroids in the Symphony mixture model. c Reference developmental trajectory of immune cells (FDG coordinates obtained from original authors). Query cells in the MEM lineages (n = 5141 cells) were mapped against the reference and query coordinates along the trajectory were predicted with 10-NN (d). The inferred query trajectory preserves branching within the MEM lineages, placing terminally differentiated states on the ends. e Expression of lineage marker genes (PPBP for megakaryocytes, HBB for erythroid cells, and KIT for mast cells). Cells colored by log-normalized expression of gene.
Fig. 6
Fig. 6. Mapping tumor cells onto an atlas of healthy tissue.
We built a reference of healthy fetal kidney and mapped a renal cell carcinoma dataset. a UMAP of healthy fetal kidney reference (n = 27,203 cells), colored by cell type as defined by the original publication. b Mapping tumor query dataset (which contains myeloid, lymphoid, stromal, and tumor compartments) onto the reference. Cells colored by reference (gray) or query compartment (as defined by original authors). c, d Heatmaps comparing original query cell types (rows), as defined by Bi et al., to the predicted reference cell types from Symphony (columns) for c immune and stromal compartments and d tumor cells. Color bar indicates the proportion of query cells per original cell type that were predicted to be of each reference type (rows sum to 1). Columns sorted by hierarchical clustering on the average gene expression (all genes) for the cell types to order similar types together. e Boxplot of per-cell mapping metric per query cell type (higher values indicate less confidence in the mapping), colored by tumor cells (orange) or immune/stromal (green) as defined in Bi et al. Boxplot shows query cells from 8 donors across 17 cell types: Cycling tumor (n = 117 cells), Tumor program 2 (TP2, n = 4599), Tumor program 1 (TP1, n = 3324), Fibroblast (n = 91), Endothelial (n = 271), Tumor-associated macrophage (TAM, n = 5053), Mitochondrial-High myeloid (n = 1407), Mast cell (n = 39), Monocyte (n = 1157), Dendritic cell (DC, n = 419), Plasma cell (n = 463), T-Helper (n = 3284), CD8 + T cell (n = 9056), Natural killer (NK, n = 2245), B cell (n = 962), T-Regulatory cell (T-Reg, n = 750), and Natural killer T cell (NKT, n = 811). Boxplot center line represents the median for the cell type; lower and upper box limits represent the 25% and 75% quantiles, respectively; whiskers extend to box limit ±1.5 × IQR; outlying points plotted individually.
Fig. 7
Fig. 7. Mapping onto a multimodal reference to infer query surface protein expression in memory T cells.
a Schematic of multimodal mapping experiment. The dataset was divided into training and test sets (80% and 20% of samples, respectively). The training set was used to build a Symphony reference, and the test set was mapped onto the reference to predict surface protein expression in query cells (pink) based on 50-NN reference cells (gray). b Symphony reference built from mRNA/protein CCA embedding. Contour fill represents density of reference cells (n = 395,373 cells from 217 samples). Black points represent soft-cluster centroids in the Symphony mixture model. c We measured the accuracy of protein expression prediction with the Pearson correlation between predicted and ground truth expression for each surface protein across query cells in each donor (total n = 104,716 cells from 54 samples). Bar height represents the mean per-donor correlation for each protein, error bars represent standard deviation, and individual data points show correlation values per donor. d Ground truth and predicted expression of CD4, CCR6, and CD69 based on CCA reference. Ground truth is the 50-NN-smoothed expression measured in the CITE-seq experiment. Colors are scaled independently for each marker from minimum (blue) to maximum (yellow) expression.

References

    1. Klein, A. M. & Treutlein, B. Single cell analyses of development in the modern era. Development146, dev181396 (2019). - PubMed
    1. Han, X. et al. Construction of a human cell landscape at single-cell level. Nature10.1038/s41586-020-2157-4 (2020). - PubMed
    1. Svensson, V., da Veiga Beltrame, E. & Pachter, L. A curated database reveals trends in single-cell transcriptomics. Database2020, baaa073 (2020). - PMC - PubMed
    1. Cao J, et al. The single-cell transcriptional landscape of mammalian organogenesis. Nature. 2019;566:496–502. doi: 10.1038/s41586-019-0969-x. - DOI - PMC - PubMed
    1. Jerber, J. et al. Population-scale single-cell RNA-seq profiling across dopaminergic neuron differentiation. Nat. Genetics. 53, 304–312 (2021). - PMC - PubMed

Publication types