. 2021 Oct;27(10):1806-1817.
doi: 10.1038/s41591-021-01511-6. Epub 2021 Oct 7.

Clinical evolution, genetic landscape and trajectories of clonal hematopoiesis in SAMD9/SAMD9L syndromes

Collaborators, Affiliations

Clinical evolution, genetic landscape and trajectories of clonal hematopoiesis in SAMD9/SAMD9L syndromes

Sushree S Sahoo et al. Nat Med. 2021 Oct.

Erratum in

  • Publisher Correction: Clinical evolution, genetic landscape and trajectories of clonal hematopoiesis in SAMD9/SAMD9L syndromes.
    Sahoo SS, Pastor VB, Goodings C, Voss RK, Kozyra EJ, Szvetnik A, Noellke P, Dworzak M, Starý J, Locatelli F, Masetti R, Schmugge M, De Moerloose B, Catala A, Kállay K, Turkiewicz D, Hasle H, Buechner J, Jahnukainen K, Ussowicz M, Polychronopoulou S, Smith OP, Fabri O, Barzilai S, de Haas V, Baumann I, Schwarz-Furlan S; European Working Group of MDS in Children (EWOG-MDS); Niewisch MR, Sauer MG, Burkhardt B, Lang P, Bader P, Beier R, Müller I, Albert MH, Meisel R, Schulz A, Cario G, Panda PK, Wehrle J, Hirabayashi S, Derecka M, Durruthy-Durruthy R, Göhring G, Yoshimi-Noellke A, Ku M, Lebrecht D, Erlacher M, Flotho C, Strahm B, Niemeyer CM, Wlodarski MW. Sahoo SS, et al. Nat Med. 2021 Dec;27(12):2248. doi: 10.1038/s41591-021-01632-y. Nat Med. 2021. PMID: 34799732 No abstract available.

Abstract

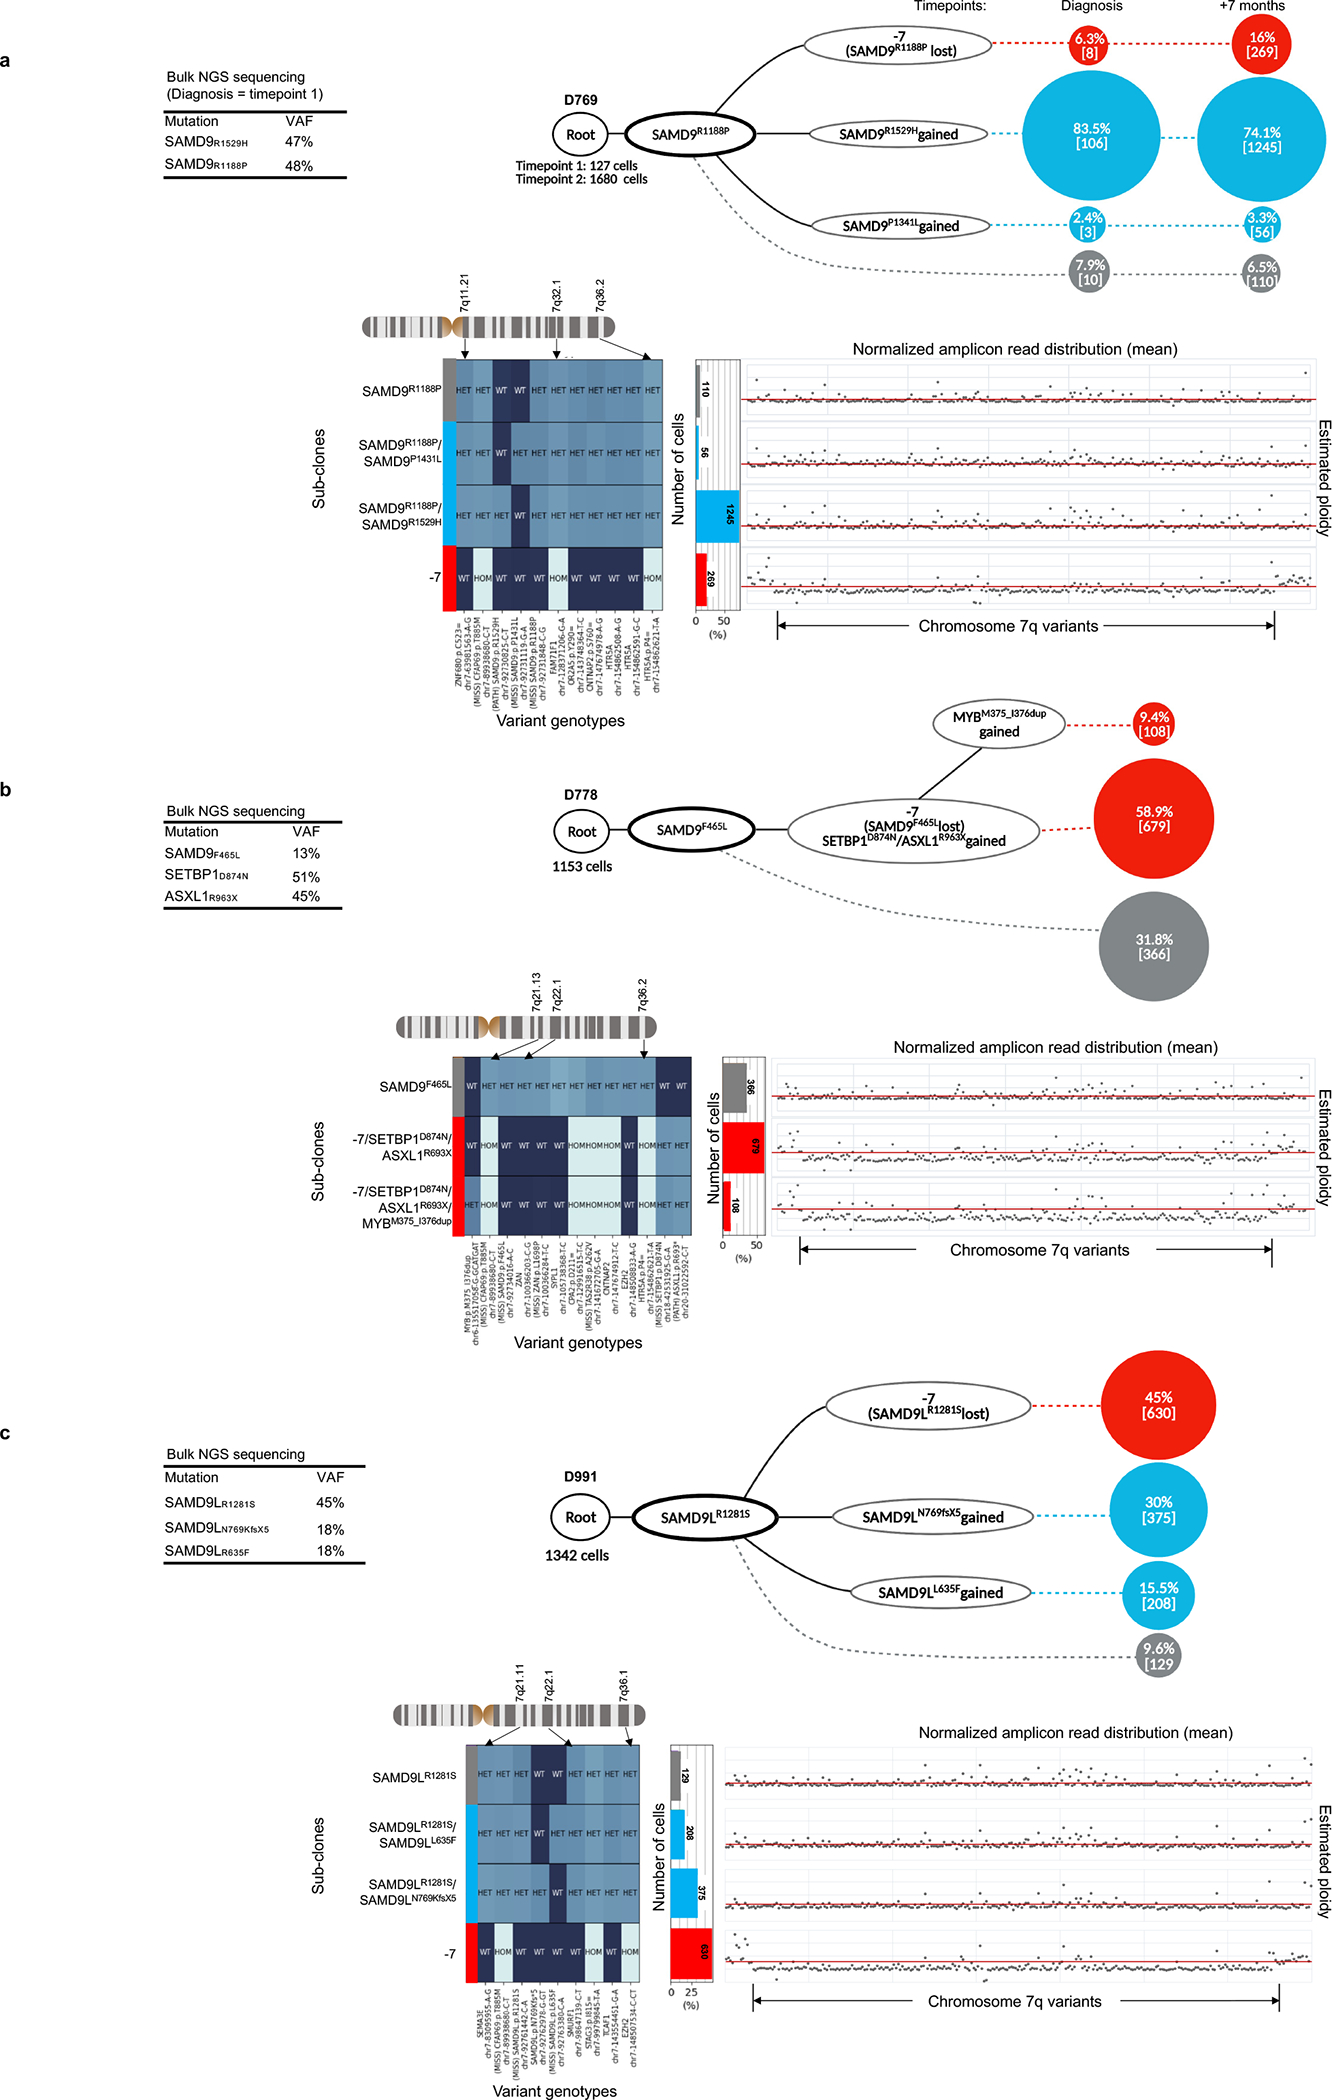
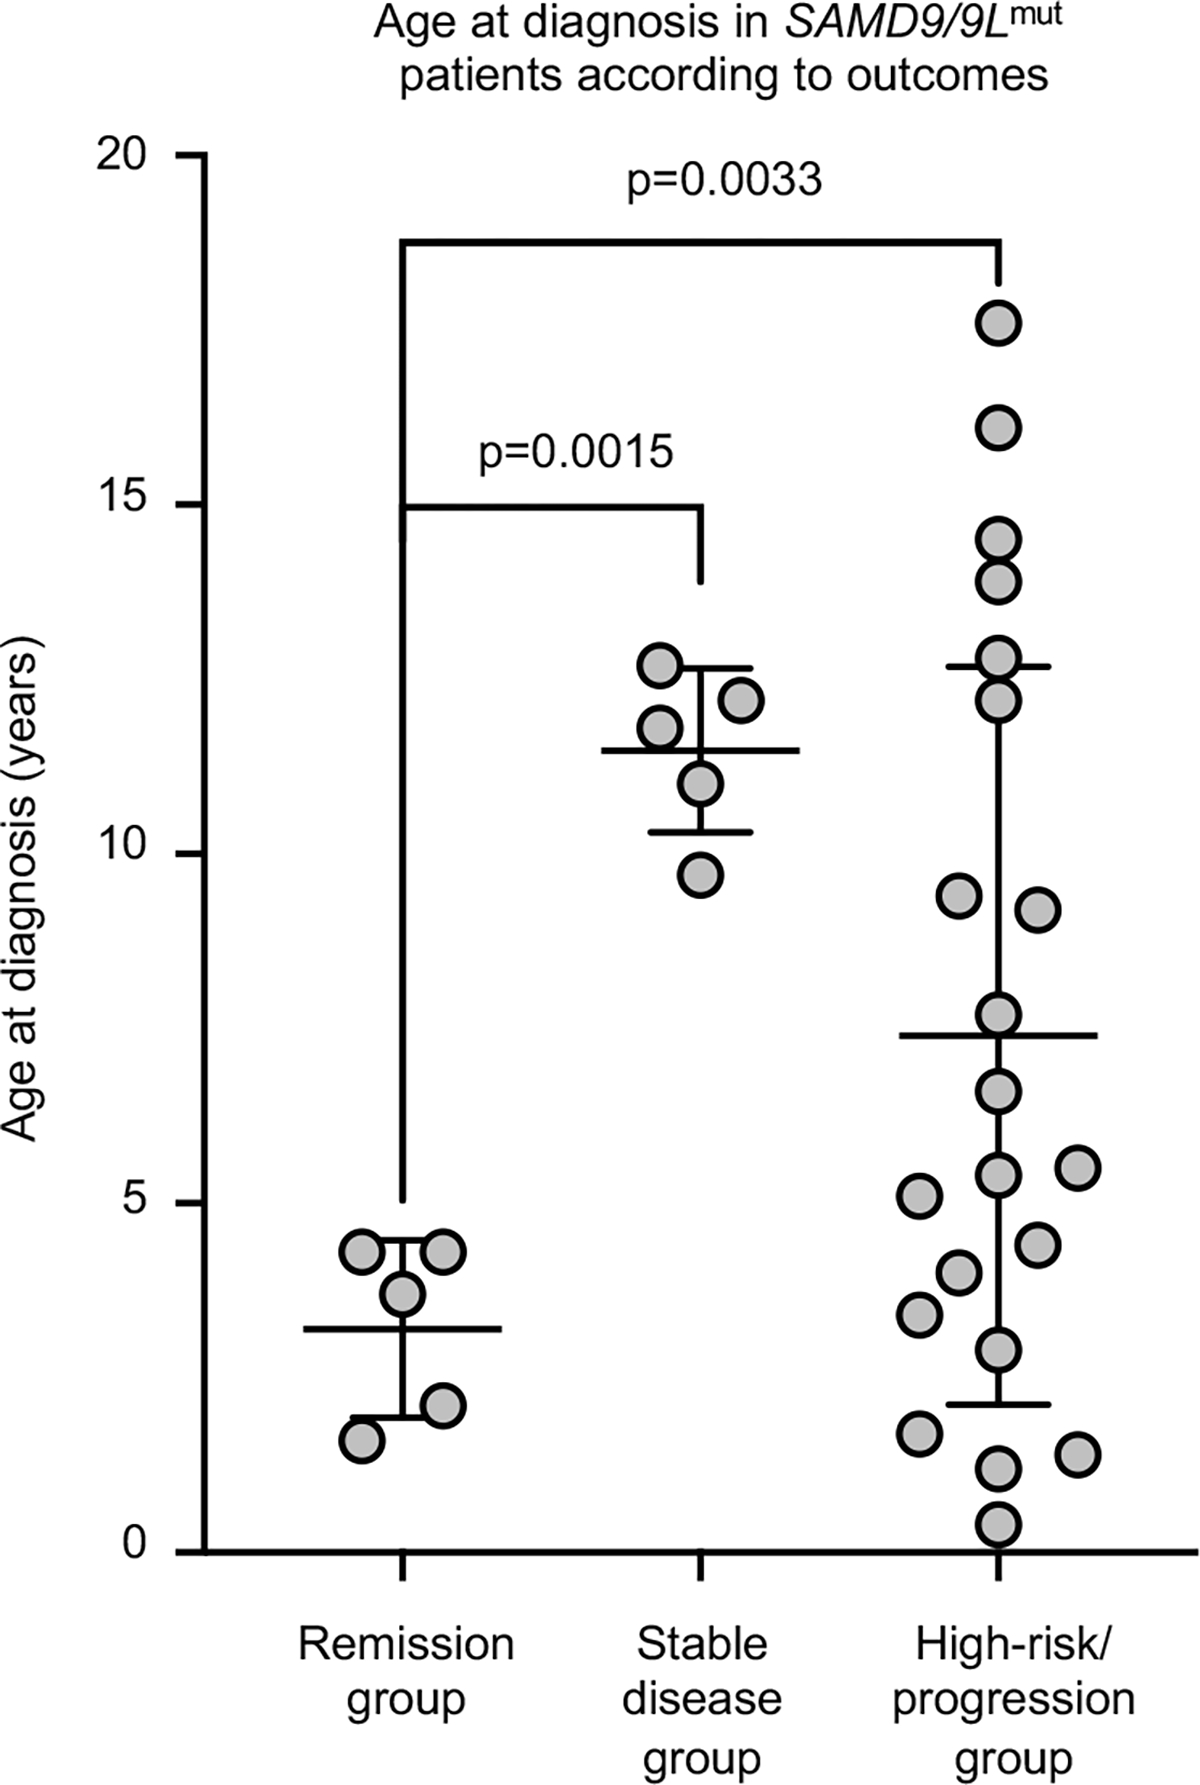
Germline SAMD9 and SAMD9L mutations (SAMD9/9Lmut) predispose to myelodysplastic syndromes (MDS) with propensity for somatic rescue. In this study, we investigated a clinically annotated pediatric MDS cohort (n = 669) to define the prevalence, genetic landscape, phenotype, therapy outcome and clonal architecture of SAMD9/9L syndromes. In consecutively diagnosed MDS, germline SAMD9/9Lmut accounted for 8% and were mutually exclusive with GATA2 mutations present in 7% of the cohort. Among SAMD9/9Lmut cases, refractory cytopenia was the most prevalent MDS subtype (90%); acquired monosomy 7 was present in 38%; constitutional abnormalities were noted in 57%; and immune dysfunction was present in 28%. The clinical outcome was independent of germline mutations. In total, 67 patients had 58 distinct germline SAMD9/9Lmut clustering to protein middle regions. Despite inconclusive in silico prediction, 94% of SAMD9/9Lmut suppressed HEK293 cell growth, and mutations expressed in CD34+ cells induced overt cell death. Furthermore, we found that 61% of SAMD9/9Lmut patients underwent somatic genetic rescue (SGR) resulting in clonal hematopoiesis, of which 95% was maladaptive (monosomy 7 ± cancer mutations), and 51% had adaptive nature (revertant UPD7q, somatic SAMD9/9Lmut). Finally, bone marrow single-cell DNA sequencing revealed multiple competing SGR events in individual patients. Our findings demonstrate that SGR is common in SAMD9/9Lmut MDS and exemplify the exceptional plasticity of hematopoiesis in children.


Figures

Extended Data Fig. 1.
Extended Data Fig. 1.. Constitutional abnormalities in patients with germline SAMD9/9L mutations.
Frequency of all (pie charts) and individual (bar graphs) non-hematopoietic abnormalities in n=67 SAMD9/9Lmut patients (n=39 SAMD9mut and n=29 SAMD9Lmut). Detailed phenotypic findings are outlined in Supplemental Table 4.
Extended Data Fig. 2.
Extended Data Fig. 2.. Computational assessment of germline SAMD9/9L and GATA2 mutations.
Rank scores of GATA2, SAMD9, and SAMD9L population variants (gnomAD) or patient-specific germline mutations (MUT) was assessed using 10 in silico algorithms: REVEL, CADD, DANN, M_CAP, FATHMM, SIFT, Polyphen2 HDIV, Polyphen2 HVAR, Mutation Taster and Mutation Assessor. The Y-axis depicts the rank scores (0, benign; 1, pathogenic). Analyzed number of gnomAD variants: GATA2 n=217, SAMD9 n=767, SAMD9L n=716 and patient germline mutations from this study: GATA2 n=19, SAMD9 n=33, SAMD9L n=20. (a) Box plots depicting the minimum, lower quartile, median, upper quartile and maximum of each analyzed data set, p-values are calculated by comparing the medians of each data set using Kruskal-Wallis one-way analysis of variance. The significant p-values (<0.05) are bolded. (b) Density plot showing the distribution of rank scores from gnomAD and patient missense variants across GATA2, SAMD9 and SAMD9L genes.
Extended Data Fig. 3.
Extended Data Fig. 3.. Functional consequence and in silico discordance of SAMD9/9L mutations.
(a) Representative Western blot showing the protein levels 24 hours after transfection with plasmid expressing SAMD9 wildtype (WT), SAMD9 n=5 patient mutations (left), and SAMD9L wildtype (WT) with SAMD9L n=5 patient mutations (right). The mock control was HEK293 transfected with empty vector. (b) Effect of co-occurring germline and second-site (somatic) SAMD9/9Lmut on HEK293 cell proliferation when expressed either alone or in cis from single constructs. Mean ± SEM from n=3 independent experiments performed in triplicate are presented. P-values using paired t-test are shown for each double mutant in comparison to the respective germline SAMD9/9Lmut. (c) Comparative evaluation of pathogenicity of 49 germline SAMD9/9L mutations by CADD prediction and HEK293 growth assay.
Extended Data Fig. 4.
Extended Data Fig. 4.. Transduction of CD34+ cells with SAMD9/9L mutant lentiviruses.
(a) RT-PCR confirming the overexpression of SAMD9 wildtype, SAMD9 E974K, SAMD9L wildtype and SAMD9L V1512M lentiviruses compared to empty control in sorted GFP positive CD34+ cells 24 hours post transduction. Mean ± SEM from n=2 independent experiments are presented. SAMD9 and SAMD9L expression data is normalized to GAPDH, and untransduced CD34+ sample is set to 1. (b) Flow cytometry plots outlining staining strategy with Annexin V-APC and DAPI in GFP positive CD34+ cells transduced with lentiviral constructs (top: SAMD9L, bottom SAMD9). Corresponding data are shown in main manuscript Fig. 3d.
Extended Data Fig. 5.
Extended Data Fig. 5.. Association of germline SAMD9/9L mutation allelic frequency with karyotype.
Variant allelic frequencies of germline SAMD9/9L mutations in n=65 patients either with monosomy 7 (−7), n=37 or normal, karyotype, n=28. The median allelic frequency of each group is marked, and the p-value is calculated using unpaired t-test.
Extended Data Fig. 6.
Extended Data Fig. 6.. Loss of heterozygosity (LOH) plots for chromosome 7 and the association of −7 with somatic events.
Allelic frequency of all informative chromosome 7 variants detected by bone marrow whole exome sequencing (variant allele frequency (VAF) between >5% and <95%) plotted for all sequenced SAMD9/9Lmut cases. The karyotypes at time of sequencing are shown, including monosomy 7 (−7), normal karyotype (NK), and uniparental isodisomy of 7q (UPD7q). (b) Chromosome 7 plots for patients with UPD7q. Two types of loss of heterozygosity (LOH) detected in patient D1297 are indicated by blue (−7) and orange (−7 & UPD7q) arrows. (c) Proportion of somatic events in SAMD9/9Lmut patients. Stacked bars demonstrate the percentage of SAMD9/9Lmut patients with different somatic events (UPD7q, somatic second-site SAMD9/9Lmut and somatic cancer gene mutations) within the −7 (blue) and other than −7 karyotype (grey). Within each bar the absolute number of patients for each group is shown.
Extended Data Fig. 7.
Extended Data Fig. 7.. Age at diagnosis in SAMD9/9Lmut patients with UPD7q.
Patients with detected uniparental isodisomy 7q (UPD7q), n=7, had a diagnosis (Dx) at a younger age of median 2.1, range 0.5 – 7.7 years) in comparison to n=59 patients without detectable UPD7q (median 9.4, range 0.1 – 18.1 years). The p-value is calculated using unpaired t-test with Welch’s correction (due to unequal cohort size). Dot plots represent the mean ±SD.
Extended Data Fig. 8.
Extended Data Fig. 8.. Clonal architecture and chromosome 7 copy number inferred from single-cell DNA sequencing (scDNAseq).
Pattern of clonal evolution (created with BioRender.com) and visualization of genotypes of individual clones constructed from high quality single cells (allelic dropout rate <0.9) detected in 3 patients with SAMD9 (a-b) or SAMD9L (c) germline mutations. Mutational phylogeny was inferred from scDNAseq data using Tapestri Insights v2.2 and Mosaic packages. Root denotes the total number of cells analyzed for each sample and bolded circle symbolizes ancestral clone with germline SAMD9/9Lmut. Percentage and number of single cells appear within colored circles; native state hematopoiesis (grey), second-site SAMD9L mutation (blue), UPD7q (green), −7 and −7 with somatic cancer mutations (both red). Variant allele frequency (VAF) from bulk sequencing is shown for reference. Panels (a) and (c) exemplify patients with branching evolution of independent benign and malignant SGR events arising from germline SAMD9/9Lmut hematopoiesis. Panel (b) depicts the linear evolution of malignant −7 clone with SETBP1/ASXL1 mutation to acquire an additional MYB M375_I376dup mutation. Lower part of panels a-c depict the genotype annotation of the observed individual clones (shown above each genotype plot). Selected variants flanking SAMD9 or SAMD9L have either wildtype (WT), heterozygous (HET) or homozygous (HOM) genotype states. Right of lower panels show normalized amplicon read distribution of informative variants from scDNAseq, with red line marking the diploid state referenced from diploid cells.
Extended Data Fig. 9.
Extended Data Fig. 9.. SAMD9/9Lmut patients with stable disease or remission.
Timeline depicting the clinical course in n=10 SAMD9/9Lmut patients with a follow up longer than 1 year who had stable disease (defined as no need for transfusions or therapeutic interventions, and no infections) or natural hematopoietic improvement. All patients presented with refractory cytopenia of childhood (RCC). The upper panel (black box) shows n=5 patients with stable disease course characterized by chronic cytopenia, normal karyotype (NK); n=4 had SAMD9mut. Two patients underwent immunosuppressive therapy (IST). Lower panel (green box) shows cases with spontaneous hematological improvement; 2 SAMD9Lmut patients with previous monosomy 7 (−7) had normalization of karyotype and complete blood counts (CBC).
Extended Data Fig. 10.
Extended Data Fig. 10.. Age at diagnosis in SAMD9/9Lmut patients according to outcomes.
Patients in remission group (n=5) were diagnosed at a younger age in comparison to stable disease (n=6) or high-risk/progression (n=21) groups. The p-value was calculated using unpaired t-test with Welch’s correction.. The dot plots represent the mean ± SD. Group were defined as follows: Remission - long-lasting resolution of hematologic symptoms; Stable disease - prolonged chronic cytopenia (>1 year) without the need for therapies; High-risk/progressed - advanced MDS, somatic cancer mutations, and disease progression (progression of karyotype from normal to abnormal or MDS subtype from refractory cytopenia of childhood (RCC) to MDS with excess blast (MDS-EB))
Figure 1.
Figure 1.. Study cohorts, prevalence of germline SAMD9, SAMD9L and GATA2 mutations and overall survival.
(a) Study design: cohort A included 548 patients with myelodysplastic syndromes (MDS) consecutively registered in Germany between 1998 and 2016 and cohort B comprised 121 MDS patients selected for possible SAMD9 and SAMD9L (SAMD9/9L) disease-related phenotypes. (b) Prevalence of germline mutations (GATA2, SAMD9/9L) in cohort A in all MDS and the MDS disease subtypes refractory cytopenia of childhood (RCC) and MDS with excess blasts (MDS-EB). Prevalence within karyotype groups is depicted by donut plots. (c) Prevalence of SAMD9/9L or GATA2 germline mutations in MDS with monosomy 7 (−7) across the age spectrum in cohort A. (d-e) Kaplan-Meier survival curves depicting the probability of overall survival (OS) from diagnosis or after hematopoietic stem cell transplantation (HSCT). Log-rank tests are employed to compare the 5-year OS. P-values are indicated within the graph.
Figure 2.
Figure 2.. Mutational landscape in SAMD9 and SAMD9L genes.
(a) Ranking of germline SAMD9 and SAMD9L mutations (SAMD9/9Lmut) based on gnomAD population allele frequency. The numbers inside the pyramid show the number of gnomAD individuals or patients (n=18) from our study within the defined population minor allele frequency categories. Grey horizontal lines indicate frequency thresholds. Presence (+) or absence (−) of reported SAMD9/9L disease-specific phenotypes found in patients is marked on the right. These phenotypes include second-site somatic SAMD9/9Lmut, uniparental isodisomy 7q (UPD7q), transient monosomy 7 (−7), ataxia and syndrome complex of myelodysplasia, infections, growth restriction, adrenal hypoplasia, genital phenotypes, and enteropathy (MIRAGE). Monosomy 7 (−7) karyotype was not considered SAMD9/9L disease-specific and is shown for comparison. (b) Distribution of germline (black font) and somatic (blue font) mutations across SAMD9 or SAMD9L proteins. Predicted protein domains are indicated inside each bar, dots represent single patients, and colors refer to gnomAD population allele frequency. (c) Density plot illustrating the SAMD9/9L germline mutational distribution. (d) Proportion of mutational subtypes of germline or somatic SAMD9/9L mutations.
Figure 3.
Figure 3.. Assessment of SAMD9 and SAMD9L mutations.
(a) SAMD9 and SAMD9L (SAMD9/9L) mRNA and protein expression was measured in primary fibroblasts from n=9 SAMD9/9Lmut patients, n=4 healthy controls (HC), and n=1 individual with germline truncating SAMD9L R406X single nucleotide variant (SNV), present at a frequency of 612/280244 alleles in gnomAD. All data points from n=2 independent RT-PCR experiments with mean ± SEM were plotted, and p-values were calculated using ordinary one-way ANOVA. One representative western blot from n=2 independent analysis is shown. (b) Rank scores of GATA2, SAMD9, and SAMD9L population variants (gnomAD) or patient-specific germline mutations (MUT) assessed using 4 variant prediction algorithms. The Y-axis depicts rank scores (0, benign; 1, pathogenic). Number of gnomAD missense variants: GATA2 n=217, SAMD9 n=767, SAMD9L n=716; number of patient germline missense mutations from this study: GATA2 n=19, SAMD9 n=33, and SAMD9L n=20 (Extended Data Fig. 2a–b). The minimum, lower quartile, median, upper quartile, and maximum of each analyzed data set is depicted by boxplots and the p-values are calculated using Kruskal-Wallis one-way analysis of variance. (c) Bar graphs depicting growth inhibition of HEK293 cells upon overexpression of SAMD9 (n=42) or SAMD9L (n=30) mutant constructs. The p-values (mean ± SD from at least n=3 independent studies in triplicate, paired two-tailed t-test) are shown for each mutant in comparison to the respective wildtype constructs. SAMD9L R1524H mutation was confirmed as either germline (D791) or somatic (D769) and is depicted here under somatic category. (d) Effect of SAMD9/9L wildtype and mutant (SAMD9 E974K, SAMD9L V1512M) lentiviral overexpression on proliferation and apoptosis in healthy donor CD34+ cells. 200,000 CD34+ cells were transduced and assessed after 24 hours by flow cytometry for GFP expression and Annexin V/DAPI (live and apoptotic cells). All data points are from n=3 independent experiments with mean ± SEM and p-values were calculated using paired two-tailed t-test.
Figure 4.
Figure 4.. Clonal events in MDS patients with germline SAMD9 and SAMD9L mutations.
(a) Clinical status and genetic findings in 67 patients with germline SAMD9 or SAMD9L mutations (SAMD9/9Lmut). Germline SAMD9/9Lmut are depicted using dark blue boxes, all other mutations below are somatic. Abbreviations: MDS, myelodysplastic syndrome; HSCT, hematopoietic stem cell transplantation; FUP, follow up; RCC, refractory cytopenia of childhood; MDS-EB, MDS with excess blasts; −7, monosomy 7; NK, normal karyotype; Dx, diagnosis; CBC, complete blood counts; UPD, uniparental isodisomy. (b) Venn diagram with overlaps between benign (SAMD9/9Lmut or UPD7q) and malignant (−7 karyotype and somatic cancer mutations) somatic genetic rescue events. (c) Circos plot delineating interconnections between germline and somatic SAMD9/9Lmut, somatic cancer mutations, and karyotypes. Lines represent individual cases. (d) Somatic cancer mutations identified in SAMD9/9Lmut patients (from cohort A and B) compared to GATA2-mutated (GATA2mut) and wildtype MDS from cohort A. Details on genomic studies appear in online methods. (e) Clonal evolution depicted from sequencing single colony forming units (CFC) derived from serial bone marrow samples for one representative SAMD9mut patient (D130). (f) Comparison of monosomy 7 (−7) clone size in n=5 patients using next generation sequencing (NGS), metaphase karyotyping, and CFC assay. P-value was calculated using paired two-tailed t-test. (g) Clonal architecture in bone marrow of patient D1248 inferred from single-cell DNA sequencing with 5 distinct clonal populations identified: native hematopoiesis (grey), somatic second-site SAMD9L mutation (blue), UPD7q (green), −7 and −7 with somatic EZH2 mutation (both red). Root denotes analyzed single-cell numbers and bolded circle symbolizes ancestral clone with germline SAMD9/9Lmut. Percentage and number of single cells appear within colored circles. Variant allele frequency (VAF) from bulk sequencing is shown for reference. (h) Genotype annotation of individual clones in D1248 (same color coding as in g). Selected variants flanking SAMD9L locus have either wildtype (WT), heterozygous (HET) or homozygous (HOM) genotype states. Right panel depicts normalized amplicon read distribution from informative variants, with red line marking the diploid state referenced from diploid clone. Results from additional patients are shown in Extended Data Fig. 8a–c. Panel g was created with BioRender.com.
Figure 5.
Figure 5.. Trajectories of clonal hematopoiesis arising from germline SAMD9 and SAMD9L mutations.
Four major states of hematopoiesis were inferred from comprehensive molecular and cytogenetic characterization of 67 patients with germline SAMD9/9L mutations. Upper panel represents patients with native state hematopoiesis only (no rescue events identified at chromosome 7 or within SAMD9/9L gene locus) and low rates of clonal progression. Lower panel depicts cases with somatic genetic rescue events resulting in adaptive (benign) clonal hematopoiesis including UPD7q with complete rescue potential and somatic SAMD9/9L mutations associated with incomplete rescue, or maladaptive clones with monosomy 7 (−7) that can gain additional cancer mutations. Twenty-six patients had overlapping somatic genetic rescue events as depicted in Fig. 4a. Created with BioRender.com.

Comment in

References

    1. Lemos de Matos A, Liu J, McFadden G & Esteves PJ Evolution and divergence of the mammalian SAMD9/SAMD9L gene family. BMC Evol Biol 13, 121 (2013). - PMC - PubMed
    1. Wu L, et al. miR-96 induces cisplatin chemoresistance in non-small cell lung cancer cells by downregulating SAMD9. Oncol Lett 11, 945–952 (2016). - PMC - PubMed
    1. Topaz O, et al. A deleterious mutation in SAMD9 causes normophosphatemic familial tumoral calcinosis. Am J Hum Genet 79, 759–764 (2006). - PMC - PubMed
    1. Liu J & McFadden G SAMD9 is an innate antiviral host factor with stress response properties that can be antagonized by poxviruses. J Virol 89, 1925–1931 (2015). - PMC - PubMed
    1. Nagamachi A, et al. Haploinsufficiency of SAMD9L, an endosome fusion facilitator, causes myeloid malignancies in mice mimicking human diseases with monosomy 7. Cancer Cell 24, 305–317 (2013). - PubMed

Publication types

MeSH terms

Substances