. 2021 Sep 21:12:756924.
doi: 10.3389/fphar.2021.756924. eCollection 2021.

Phillygenin Attenuates Carbon Tetrachloride-Induced Liver Fibrosis via Modulating Inflammation and Gut Microbiota

Affiliations

Phillygenin Attenuates Carbon Tetrachloride-Induced Liver Fibrosis via Modulating Inflammation and Gut Microbiota

Cheng Wang et al. Front Pharmacol. .

Abstract

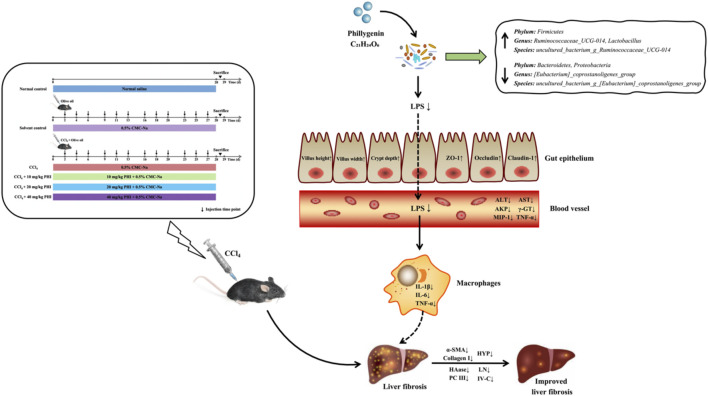
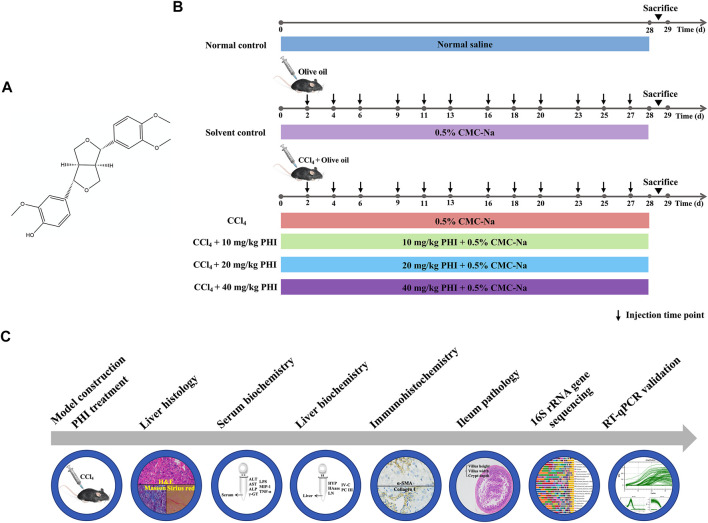
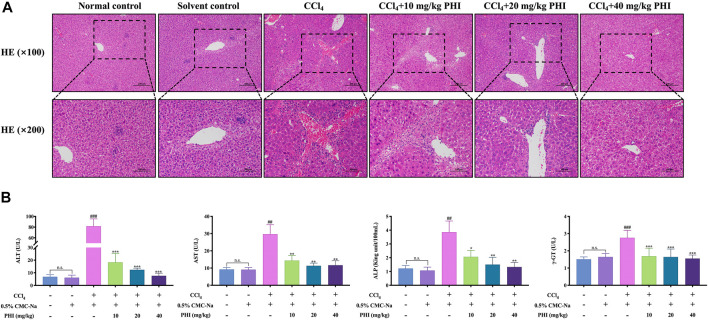
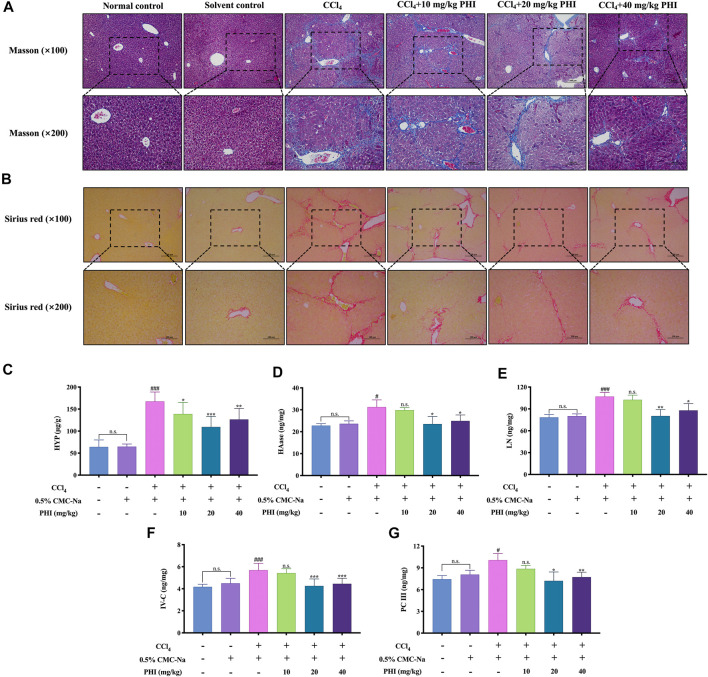
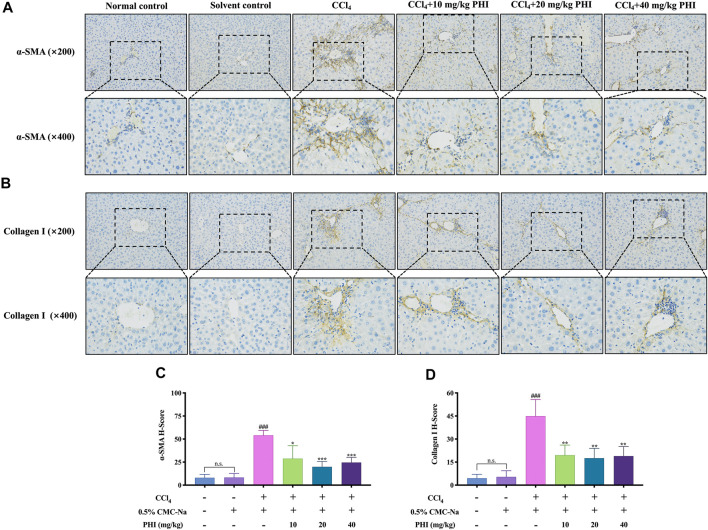
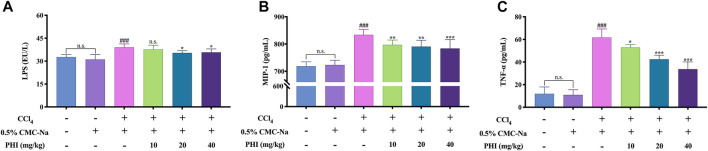
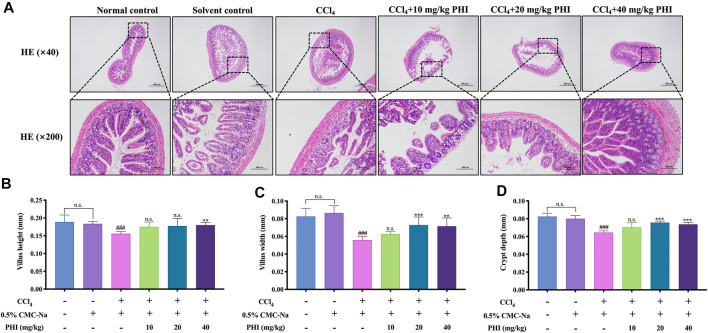
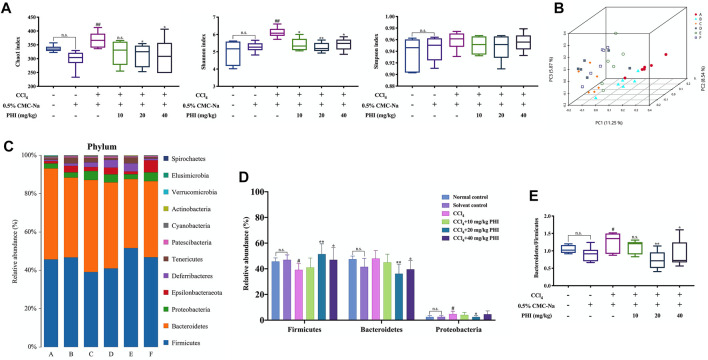
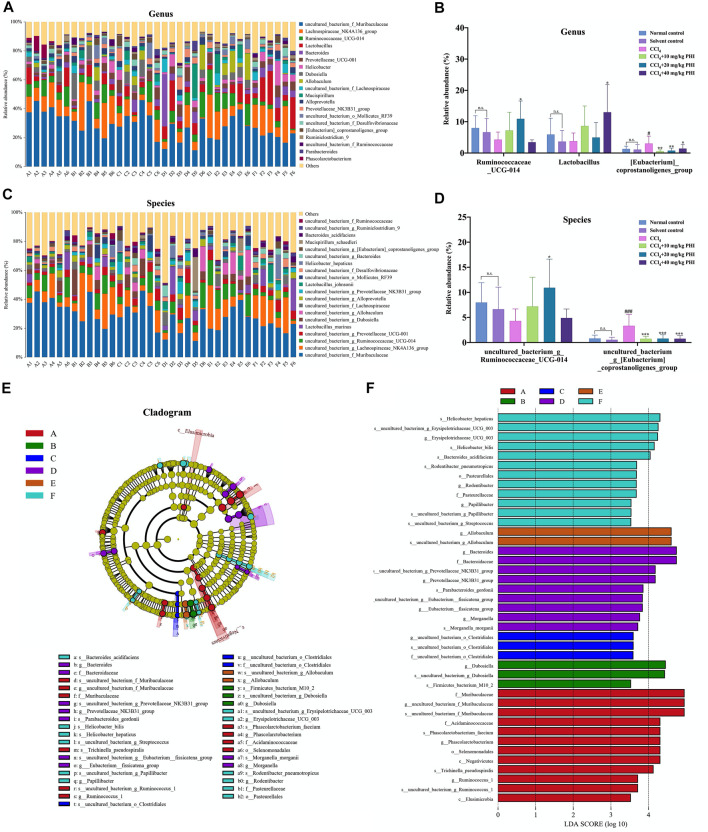
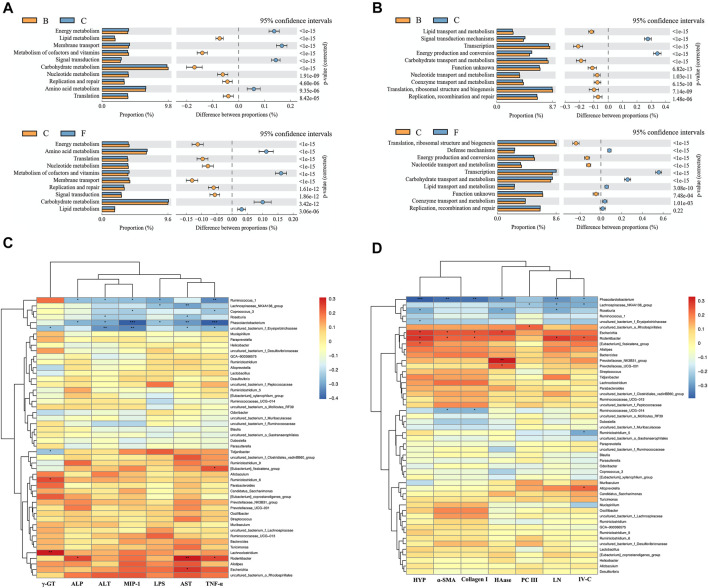
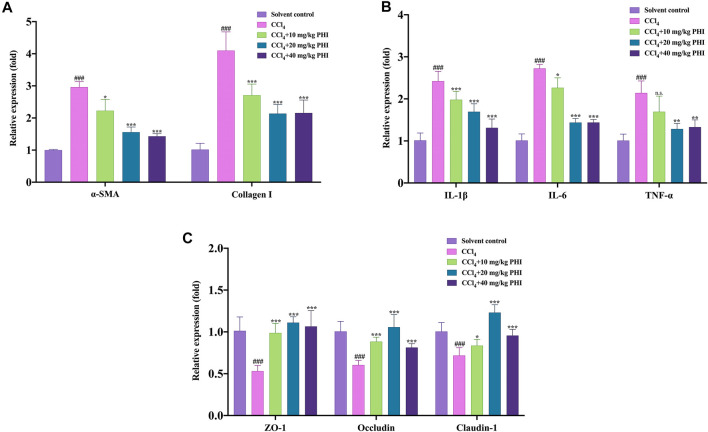
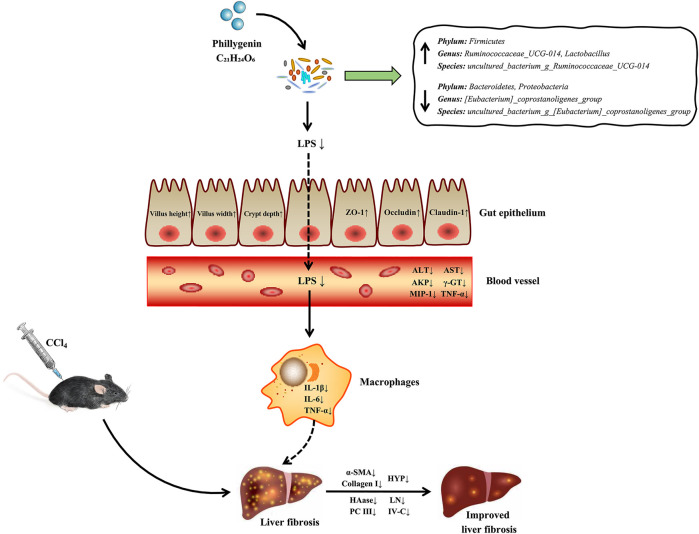
Liver fibrosis is a chronic pathological process that various pathogenic factors lead to abnormal hyperplasia of hepatic connective tissue, and its main feature is the excessive deposition of extracellular matrix. However, there are currently no drugs approved for the treatment of liver fibrosis. Phillygenin (PHI), a lignan isolated from Forsythiae Fructus, showed potential anti-inflammatory and anti-fibrosis effects but the mechanisms remain unknown. In view of the vital role of gut microbiota in the development of liver fibrosis, this study aimed to explore whether PHI could protect intestinal epithelial barrier and attenuate liver fibrosis by maintaining the homeostasis of intestinal microbiota. Therefore, the liver fibrosis model was induced by intraperitoneal injection of olive oil containing 10% carbon tetrachloride (CCl4) for 4 weeks in C57BL/6J mice. Histological analysis including Hematoxylin-Eosin, Masson, Sirius red, and immunohistochemistry staining were carried out to detect the histopathology and collagen deposition of mice liver tissues. The biochemical indexes related to liver function (ALT, AST, AKP, γ-GT), fibrosis (HYP, HAase, LN, PC III, IV-C) and inflammation (TNF-α, MIP-1, LPS) were determined by specific commercial assay kits. In vivo experimental results showed that PHI could improve liver histopathological injury, abnormal liver function, collagen deposition, inflammation and fibrosis caused by CCl4. Moreover, PHI restored the intestinal epithelial barrier by promoting the expression of intestinal barrier markers, including ZO-1, Occludin and Claudin-1. More importantly, the corrective effect of PHI on the imbalance of gut microbiota was confirmed by sequencing of the 16 S rRNA gene. In particular, PHI treatment enriches the relative abundance of Lactobacillus, which is reported to alleviate inflammation and fibrosis of damaged liver. Collectively, PHI attenuates CCl4-induced liver fibrosis partly via modulating inflammation and gut microbiota.

Keywords: Phillygenin; carbon tetrachloride; gut microbiota; intestinal barrier; liver fibrosis.


Conflict of interest statement

The authors declare that the research was conducted in the absence of any commercial or financial relationships that could be construed as a potential conflict of interest.

Figures

GRAPHICAL ABSTRACT
GRAPHICAL ABSTRACT
FIGURE 1
FIGURE 1
Experimental outline. (A) Chemical structure of PHI. (B) Flow diagram depicting the treatment of mice in all groups. (C) Description of the experimental design.
FIGURE 2
FIGURE 2
Effect of PHI on the pathological and serum biochemical indexes of liver fibrosis in mice. (A) HE staining of liver ( × 100 and × 200). (B) Serum ALT, AST, AKP and γ-GT activity. Data was expressed as the mean ± SD (n = 6). ## p < 0.01, ### p < 0.001 represent compared with solvent control group. *p < 0.05, **p < 0.01, ***p < 0.001 represent compared with CCl4 group. n. s indicates no significant.
FIGURE 3
FIGURE 3
Effect of PHI on collagen deposition and liver biochemical indexes of liver fibrosis in mice. (A) Masson staining ( × 100 and × 200). (B) Sirius red staining ( × 100 and × 200). (C) Liver HYP activity. (D) Liver HAase activity. (E) Liver LN activity. (F) Liver IV-C activity. (G) Liver PC Ⅲ activity. Data was expressed as the mean ± SD (n = 6). # p < 0.05, ### p < 0.001 represent compared with solvent control group. *p < 0.05, **p < 0.01, ***p < 0.001 represent compared with CCl4 group. n. s indicates no significant.
FIGURE 4
FIGURE 4
Effect of PHI on the expression of α-SMA and collagen I. (A) Immunohistochemistry staining of α-SMA in the liver tissues ( × 200 and × 400). (B) Immunohistochemistry staining of collagen I in the liver tissues ( × 200 and × 400). (C) Quantitative results of α-SMA in the liver tissues (D) Quantitative results of collagen I in the liver tissues. Data was expressed as the mean ± SD (n = 6). ### p < 0.001 represent compared with solvent control group. *p < 0.05, **p < 0.01, ***p < 0.001 represent compared with CCl4 group. n. s indicates no significant.
FIGURE 5
FIGURE 5
PHI inhibits inflammation. (A) Serum LPS level. (B) Serum MIP-1 level. (C) Serum TNF-α level. Data was expressed as the mean ± SD (n = 6). ### p < 0.001 represent compared with solvent control group. *p < 0.05, **p < 0.01, ***p < 0.001 represent compared with CCl4 group. n. s indicates no significant.
FIGURE 6
FIGURE 6
PHI protected intestinal epithelial barrier breakdown induced by CCl4. (A) HE staining of ileum ( × 40 and × 200) (B) Villus height. (C) Villus width. (D) Crypt depth. Data was expressed as the mean ± SD (n = 6). ### p < 0.001 represent compared with solvent control group. **p < 0.01, ***p < 0.001 represent compared with CCl4 group. n. s indicates no significant.
FIGURE 7
FIGURE 7
PHI modulates the composition of gut microbiota. (A) The alpha diversity of each group was obtained using the Chao1 index, Shannon index and Simpson index. (B) PCoA of gut microbiota. (C) The relative abundance of bacteria at the phylum level. (D) Representative histogram of the gut microbiota at the phylum level. (E) Bacteroides to Firmicutes ratio. A: Normal control; B: Solvent control; C: CCl4; D: CCl4 + 10 mg/kg PHI; E: CCl4 + 20 mg/ kg PHI; F: CCl4 + 40 mg/ kg PHI. Data was expressed as the mean ± SD (n = 6). # p < 0.05, ## p < 0.01 represent compared with solvent control group. *p < 0.05, **p < 0.01 represent compared with CCl4 group. n. s indicates no significant.
FIGURE 8
FIGURE 8
PHI modulates the composition of gut microbiota. (A) The relative abundance of the top 20 abundant bacteria at the genus level. (B) At the genus level, changes in microbiota in mice in each group. (C) The relative abundance of the top 20 abundant bacteria at the species level. (D) At the species level, changes in microbiota in mice in each group. (E) Linear discriminant analysis effect size (LEfSe) prediction was used to identify the most differentially abundant bacteria in each group. (F) LDA scores showed significant bacterial differences in each group. Only the bacteria meeting a significant LDA threshold value of 3.5 are shown. A: Normal control; B: Solvent control; C: CCl4; D: CCl4 + 10 mg/ kg PHI; E: CCl4 + 20 mg/ kg PHI; F: CCl4 + 40 mg/ kg PHI. Data was expressed as the mean ± SD (n = 6). # p < 0.05, ### p < 0.001 represent compared with solvent control group. *p < 0.05, **p < 0.01, ***p < 0.001 represent compared with CCl4 group. n. s indicates no significant.
FIGURE 9
FIGURE 9
Function prediction analysis of gut microbiota and Correlation analysis heat map. (A) Prediction of microbiome function based on KEGG database. (B) Prediction of microbiome function based on COG database. (C) Correlation analysis of intestinal microflora and serum biochemical indexes in mice. (D) Correlation analysis of intestinal microflora and liver biochemical indexes in mice. B: Solvent control; C: CCl4; F: CCl4 + 40 mg/ kg PHI.
FIGURE 10
FIGURE 10
The relative mRNA expression levels in the solvent control, CCl4, CCl4 + 10 mg/ kg PHI, CCl4 + 20 mg/ kg PHI and CCl4 + 40 mg/ kg PHI groups. (A) The mRNA expressions of α-SMA and Collagen I. (B) The mRNA expressions of IL-1β, IL-6 and TNF-α. (C) The mRNA expressions of ZO-1, Occludin and Claudin-1. Data was expressed as the mean ± SD (n = 6). ### p < 0.001 represent compared with solvent control group. *p < 0.05, **p < 0.01, ***p < 0.001 represent compared with CCl4 group. n. s indicates no significant.
FIGURE 11
FIGURE 11
The potential mechanism of PHI in alleviating CCl4-induced liver fibrosis.

References

    1. Aydin M. M., Akcali K. C. (2018). Liver Fibrosis. Turk J. Gastroenterol. 29 (1), 14–21. 10.5152/tjg.2018.17330 - DOI - PMC - PubMed
    1. Bolarin D. M., Azinge E. C. (2007). Biochemical Markers, Extracellular Components in Liver Fibrosis and Cirrhosis. Nig Q. J. Hosp. Med. 17 (1), 42–52. 10.4314/nqjhm.v17i1.12541 - DOI - PubMed
    1. Böttcher K., Pinzani M. (2017). Pathophysiology of Liver Fibrosis and the Methodological Barriers to the Development of Anti-fibrogenic Agents. Adv. Drug Deliv. Rev. 121, 3–8. 10.1016/j.addr.2017.05.016 - DOI - PubMed
    1. Campana L., Iredale J. P. (2017). Regression of Liver Fibrosis. Semin. Liver Dis. 37 (1), 1–10. 10.1055/s-0036-1597816 - DOI - PubMed
    1. Cardinale V., Capurso G., Ianiro G., Gasbarrini A., Arcidiacono P. G., Alvaro D. (2020). Intestinal Permeability Changes with Bacterial Translocation as Key Events Modulating Systemic Host Immune Response to SARS-CoV-2: A Working Hypothesis. Dig. Liver Dis. 52 (12), 1383–1389. 10.1016/j.dld.2020.09.009 - DOI - PMC - PubMed