Review
. 2021 Sep 21:12:712555.
doi: 10.3389/fneur.2021.712555. eCollection 2021.

Volumetric MRI-Based Biomarkers in Huntington's Disease: An Evidentiary Review

Collaborators, Affiliations
Review

Volumetric MRI-Based Biomarkers in Huntington's Disease: An Evidentiary Review

Kirsi M Kinnunen et al. Front Neurol. .

Abstract

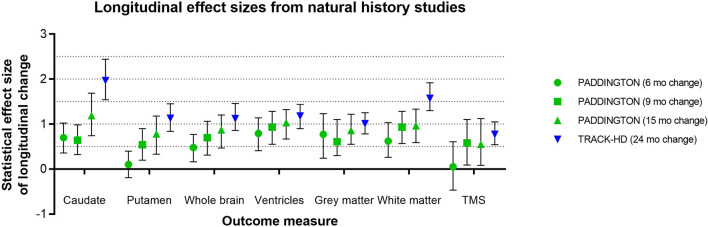
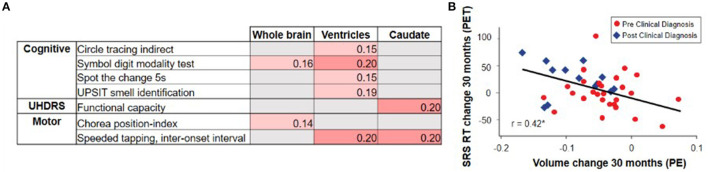
Huntington's disease (HD) is an autosomal-dominant inherited neurodegenerative disorder that is caused by expansion of a CAG-repeat tract in the huntingtin gene and characterized by motor impairment, cognitive decline, and neuropsychiatric disturbances. Neuropathological studies show that disease progression follows a characteristic pattern of brain atrophy, beginning in the basal ganglia structures. The HD Regulatory Science Consortium (HD-RSC) brings together diverse stakeholders in the HD community-biopharmaceutical industry, academia, nonprofit, and patient advocacy organizations-to define and address regulatory needs to accelerate HD therapeutic development. Here, the Biomarker Working Group of the HD-RSC summarizes the cross-sectional evidence indicating that regional brain volumes, as measured by volumetric magnetic resonance imaging, are reduced in HD and are correlated with disease characteristics. We also evaluate the relationship between imaging measures and clinical change, their longitudinal change characteristics, and within-individual longitudinal associations of imaging with disease progression. This analysis will be valuable in assessing pharmacodynamics in clinical trials and supporting clinical outcome assessments to evaluate treatment effects on neurodegeneration.

Keywords: C-Path; Huntington's disease; biomarkers; neurodegenerative; neuroimaging; volumetric MRI.


Conflict of interest statement

KMK and RJ are full-time employees of IXICO. AJS is a full-time employee and shareholder of Takeda Pharmaceuticals, Ltd. DP and ECG are employed by CHDI Management to provide advisory services to CHDI Foundation. MFG is a full-time employee of Teva Pharmaceuticals. APM is a full-time employee of Wave Life Sciences, Ltd. RIS provides consultancy for IXICO. The remaining authors declare that the research was conducted in the absence of any other commercial or financial relationships that could be construed as a potential conflict of interest.

Figures

Figure 1
Figure 1
Overview of the disease progression heterogeneity for imaging studies with publicly available datasets (IMAGE-HD, PREDICT-HD, and TRACK-HD/Track-On HD) displaying the relative proportion of participants within each study (y-axis) by participant CAP score (x-axis). A single CAP score was computed for each participant using the age at enrollment in that study. The density plots are colored by study and separated by HD clinical diagnosis status (upper panel: individuals with expanded CAG repeats before clinical motor diagnosis; lower panel: individuals with HD clinical motor diagnosis). The TRACK-HD and Track-On HD had overlapping populations, and study sites, and were combined.
Figure 2
Figure 2
Cross-sectional relationship between regional brain volume loss from vMRI and disease progression. (A) Regional volume analysis shows a monotonic decrease in caudate volume as a function of TRACK-HD cohort. The group of individuals without clinical motor diagnosis at baseline were divided at the median into PreHD-A (further from predicted diagnosis) and PreHD-B (nearer to predicted diagnosis). HD1: participants with a clinical motor diagnosis and TFC 11-13; HD2: participants with a clinical motor diagnosis and TFC 7-10. (B) Regional volume analysis shows an inverse correlation with disease burden score [age*(CAG length-35.5)] over all groups of participants; similar results were found for putamen and whole striatum (4). (C) Trajectory of putamen volume for N = 225 participants who received a clinical motor diagnosis during PREDICT-HD. Shown are the individual dashed empirical curves and the solid fitted spline curve with the 95% confidence interval. The vertical line indicates the year of clinical motor diagnosis (set to year = 0). (D) Whole-brain VBM analysis of baseline data from the TRACK-HD shows that the strongest differences from controls are concentrated in the striatum including the caudate. The figure displays statistical parametric maps of gray matter differences in each group compared with controls with the data adjusted for age, sex, study site and intracranial volume. Results are corrected for multiple comparisons using familywise error at the p < 0.05 level (4).
Figure 3
Figure 3
Hypothetical model of trajectories of (A) clinical and (B) vMRI measures of HD progression [modified from Ross et al. (8)]. This qualitative representation is based on observations across two observational study cohorts (PREDICT-HD and TRACK-HD) and provides a conceptual illustration for quantitative trajectory models but has not yet been experimentally confirmed.
Figure 4
Figure 4
(A) Quantification of caudate volume loss in the TRACK-HD study showed near monotonic change from baseline to 12- and 24-month follow-up across the disease spectrum, with the rate of change increasing after clinical motor diagnosis (3). (B) Change in caudate volume with CAP score from TRACK-HD data (8). (C) Longer follow-up in the IMAGE-HD study also showed a greater degree of longitudinal change in the caudate volume in individuals with a clinical motor diagnosis (20).
Figure 5
Figure 5
Representative longitudinal effect sizes (average change relative to standard deviation of the change) and their 95% confidence intervals for different time intervals in two observational studies [PADDINGTON (5) and TRACK-HD (3)]. Note that in the PADDINGTON study, the 9-month interval was the change between imaging at 6 and 15 months. The clinical status of the PADDINGTON population depicted here was primarily HD1 [N = 61 in total at baseline, of which N = 56 HD1 (TFC 11-13), N = 4 HD2 (TFC 7-10), and N = 1 HD3 (TFC 3-6); overall mean (SD) TFC was 11.7 (1.5)], and the TRACK-HD population was HD1 (N = 45 with TFC 11-13, 24-month follow-up).
Figure 6
Figure 6
The TRACK-HD study showed (A) relatively weak and selective correlations between changes in vMRI metrics and changes in clinical outcomes over a 12-month interval (2). Partial correlations across participants with and without a clinical motor diagnosis, controlled for age, sex, education, and study site, nominally significant at p < 0.05 are shown. The IMAGE-HD study showed (B) that 30-month change in caudate volume is significantly correlated with 30-month change in reaction time (RT) during performance of a cognitive task that required shifting response set (SRS) (20) (i.e., greater volume loss was associated with longer reaction times [RTs]).

References

    1. MacDonald ME, Ambrose CM, Duyao MP, Myers RH, Lin C, Srinidhi L, et al. . A novel gene containing a trinucleotide repeat that is expanded and unstable on Huntington's disease chromosomes. Cell. (1993) 72:971–83. 10.1016/0092-8674(93)90585-E - DOI - PubMed
    1. Tabrizi SJ, Scahill RI, Durr A, Roos RA, Leavitt BR, Jones R, et al. . Biological and clinical changes in premanifest and early stage Huntington's disease in the TRACK-HD study: the 12-month longitudinal analysis. Lancet Neurol. (2011) 10:31–42. 10.1016/S1474-4422(10)70276-3 - DOI - PubMed
    1. Tabrizi SJ, Reilmann R, Roos RAC, Durr A, Leavitt B, Owen G, et al. . Potential endpoints for clinical trials in premanifest and early Huntington's disease in the TRACK-HD study: analysis of 24 month observational data. Lancet Neurol. (2012) 11:42–53. 10.1016/S1474-4422(11)70263-0 - DOI - PubMed
    1. Tabrizi SJ, Langbehn DR, Leavitt BR, Roos RA, Durr A, Craufurd D, et al. . Biological and clinical manifestations of Huntington's disease in the longitudinal TRACK-HD study: cross-sectional analysis of baseline data. Lancet Neurol. (2009) 8:791–801. 10.1016/S1474-4422(09)70170-X - DOI - PMC - PubMed
    1. Hobbs NZ, Farmer RE, Rees EM, Cole JH, Haider S, Malone IB, et al. . Short-interval observational data to inform clinical trial design in Huntington's disease. J Neurol Neurosurg Psychiatry. (2015) 86:1291–8. 10.1136/jnnp-2014-309768 - DOI - PubMed

LinkOut - more resources