Randomized Controlled Trial
. 2021 Sep 21:12:726428.
doi: 10.3389/fimmu.2021.726428. eCollection 2021.

CyTOF-Enabled Analysis Identifies Class-Switched B Cells as the Main Lymphocyte Subset Associated With Disease Relapse in Children With Idiopathic Nephrotic Syndrome

Affiliations
Randomized Controlled Trial

CyTOF-Enabled Analysis Identifies Class-Switched B Cells as the Main Lymphocyte Subset Associated With Disease Relapse in Children With Idiopathic Nephrotic Syndrome

Miguel Fribourg et al. Front Immunol. .

Abstract

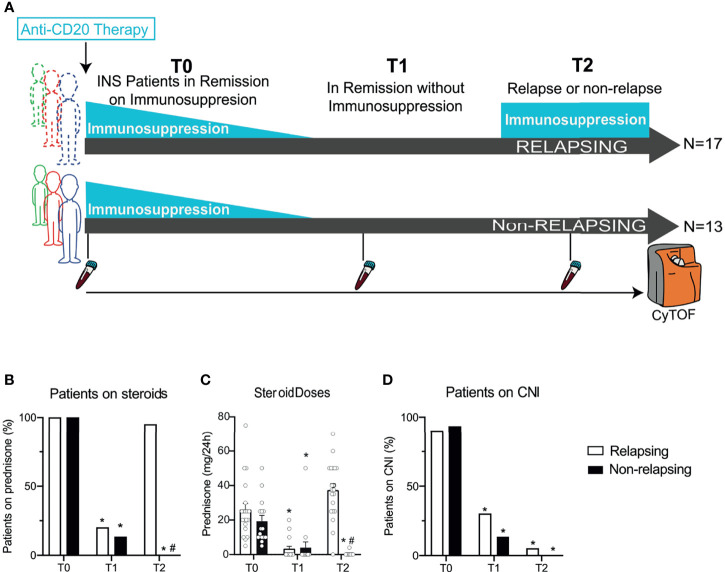
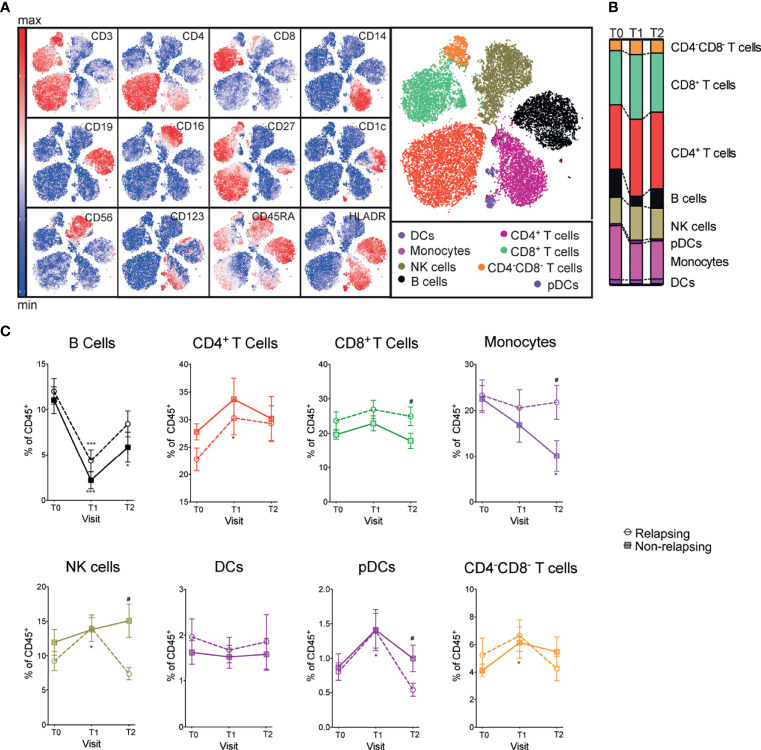
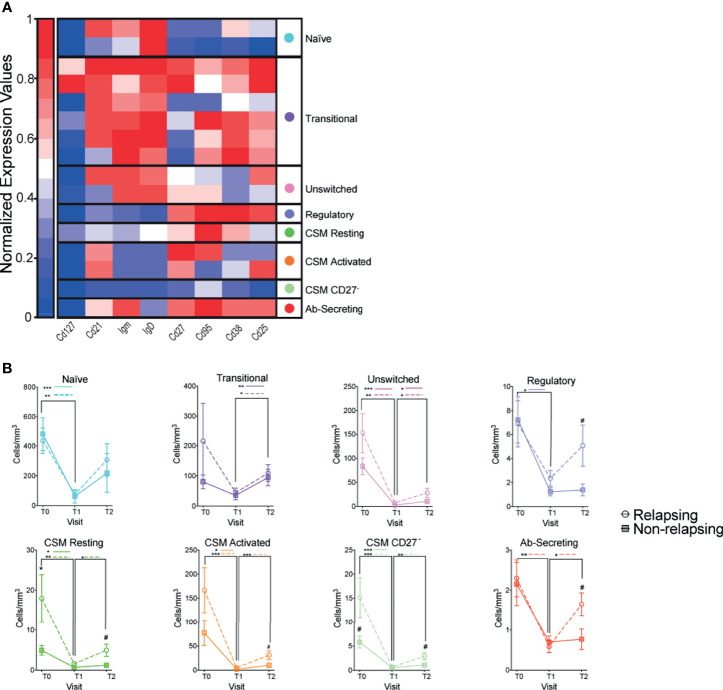
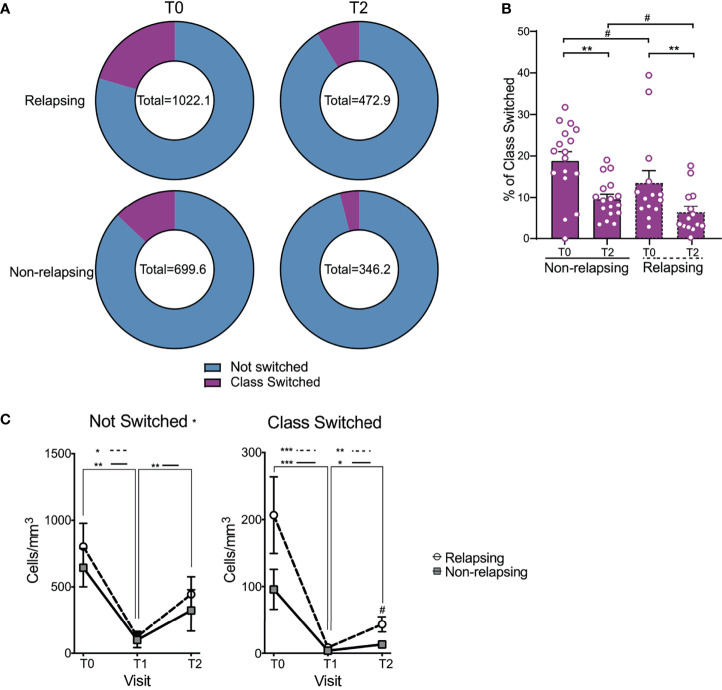
B cell depleting therapies permit immunosuppressive drug withdrawal and maintain remission in patients with frequently relapsing nephrotic syndrome (FRNS) or steroid-dependent nephrotic syndrome (SDNS), but lack of biomarkers for treatment failure. Post-depletion immune cell reconstitution may identify relapsing patients, but previous characterizations suffered from methodological limitations of flow cytometry. Time-of-flight mass cytometry (CyTOF) is a comprehensive analytic modality that simultaneously quantifies over 40 cellular markers. Herein, we report CyTOF-enabled immune cell comparisons over a 12-month period from 30 children with SDNS receiving B cell depleting therapy who either relapsed (n = 17) or remained stable (n = 13). Anti-CD20 treatment depleted all B cells subsets and CD20 depleting agent choice (rituximab vs ofatumumab) did not affect B cell subset recovery. Despite equal total numbers of B cells, 5 subsets of B cells were significantly higher in relapsing individuals; all identified subsets of B cells were class-switched. T cell subsets (including T follicular helper cells and regulatory T cells) and other major immune compartments were largely unaffected by B cell depletion, and similar between relapsing and stable children. In conclusion, CyTOF analysis of immune cells from anti-CD20 antibody treated patients identifies class-switched B cells as the main subset whose expansion associates with disease relapse. Our findings set the basis for future studies exploring how identified subsets can be used to monitor treatment response and improve our understanding of the pathogenesis of the disease.

Keywords: B cell; T cell; immune phenotype; nephrotic syndrome; predictor; relapse.


Conflict of interest statement

The authors declare that the research was conducted in the absence of any commercial or financial relationships that could be construed as a potential conflict of interest.

Figures

Figure 1
Figure 1
Serial high-dimensional profiling of INS patients and concomitant immunosuppressive treatments. (A) Study design of thirty children with steroid-dependent nephrotic syndrome in remission with steroids ± calcineurin inhibitors who received either rituximab (RTX) or ofatumumab (OFA) and then underwent withdrawal of immunosuppression in 3 months. After withdrawal, 17 patients developed a relapse, while 13 stayed in remission. Blood was collected before RTX or OFA therapy (T0), after immunosuppressive withdrawal (while still in remission; T1), and at the time of relapse (or at the same time after B cell depleting therapy in patients in remission; T2). Cells were barcoded for patient and time, pooled, and stained with 38 antibodies conjugated to unique metal isotopes. Single-cell data acquired from time-of-flight mass cytometry (CyTOF) was clustered using Phenograph to identify cell clusters and how they evolved over time in each patient (see Methods). (B) Percentage of patients treated with prednisone and (C) average daily prednisone doses in relapsing and non-relapsing patients before anti-CD20 therapy (T0), in remission after immunosuppression withdrawal (T1), and at relapse (or at the same time point after anti-CD-20 therapy in non-relapsing patients; T2). (D) Percentage of patients treated with calcineurin inhibitors (CNI) at the same visits. n=30. *p < 0.05 vs. T0. #p < 0.05 vs. relapsing at the same visit. Bar plots depict mean ± SEM.
Figure 2
Figure 2
Frequencies of major immune compartments in INS patients receiving OFA or RTX therapy. (A) viSNE analysis of peripheral blood mononuclear cells (PBMC) from a representative patient including 3 time points (during immunosuppressive treatment, after immunosuppressive treatment withdrawal and at the time of relapse) colored by the relative expression of CyTOF markers to designate major immune clusters [populations defined in (B)]. (C) Percentages of major immune compartments once demultiplexed and based on the summation of Phenograph clusters before (T0) and serially after (T1 and T2) anti-CD20 therapy. Comparisons between relapsing and non-relapsing at the same timepoint #p < 0.05. Comparisons between different timepoints *p < 0.05, ***p < 0.001. Two-way ANOVA corrected for multiple comparisons. Data points depict mean ± SEM.
Figure 3
Figure 3
Changes in B cell subsets after anti-CD20 Ab therapy. (A) Heatmap of CD19+ immune cells colored and labeled by Phenograph cluster for all subjects and time points combined (see Methods). Rows represent different clusters identified and columns the relative expression of each marker in that particular cluster (B) Absolute numbers of CD19+ B cell subsets once demultiplexed and based on the summation of Phenograph clusters before (T0) and serially after (T1 and T2) anti-CD20 therapy. Comparisons between relapsing and non-relapsing at the same timepoint #p < 0.05. Comparisons between different timepoints *p < 0.05, **p < 0.01, ***p < 0.001. Two-way ANOVA corrected for multiple comparisons. Data points depict mean ± SEM.
Figure 4
Figure 4
Changes in not switched and class switched B cells after anti-CD20 Ab therapy. (A) Doughnut pie graph of the number of class switched B cells (total = average number of class switched and not-switched cells per sample) before anti-CD20 treatment (T0) and at relapse (or at the same time point after anti-CD-20 therapy in non-relapsing patients) (T2). (B) Bar graph illustrating the percentage of class switched B cells. (C) Changes in absolute numbers of not switched and class switched B cells in relapse and non-relapsing patients at T0, T1 and T2. Comparisons between the relapsing and non-relapsing groups at the same timepoint #p < 0.05. Comparisons between different timepoints *p < 0.05, **p < 0.01, ***p < 0.001. Two-way ANOVA corrected for multiple comparisons. Bar plots and data points depict mean ± SEM.

References

    1. Eddy AA, Symons JM. Nephrotic Syndrome in Childhood. Lancet (2003) 362:629–39. doi: 10.1016/S0140-6736(03)14184-0 - DOI - PubMed
    1. Gubler MC. Podocyte Differentiation and Hereditary Proteinuria/Nephrotic Syndromes. J Am Soc Nephrol (2003) 14(Suppl 1):S22–6. doi: 10.1097/01.asn.0000067648.75923.68 - DOI - PubMed
    1. Lombel RM, Gipson DS, Hodson EM. Kidney Disease: Improving Global O: Treatment of Steroid-Sensitive Nephrotic Syndrome: New Guidelines From KDIGO. Pediatr Nephrol (2013) 28:415–26. doi: 10.1007/s00467-012-2310-x - DOI - PubMed
    1. Savin VJ, Sharma R, Sharma M, McCarthy ET, Swan SK, Ellis E, et al. . Circulating Factor Associated With Increased Glomerular Permeability to Albumin in Recurrent Focal Segmental Glomerulosclerosis. N Engl J Med (1996) 334:878–83. doi: 10.1056/NEJM199604043341402 - DOI - PubMed
    1. Shalhoub RJ. Pathogenesis of Lipoid Nephrosis: A Disorder of T-Cell Function. Lancet (1974) 2:556–60. doi: 10.1016/s0140-6736(74)91880-7 - DOI - PubMed

Publication types

MeSH terms

LinkOut - more resources