Review
. 2021 Sep 21:11:715025.
doi: 10.3389/fonc.2021.715025. eCollection 2021.

Robust Angle Selection in Particle Therapy

Affiliations
Review

Robust Angle Selection in Particle Therapy

Yuan Zhou et al. Front Oncol. .

Abstract

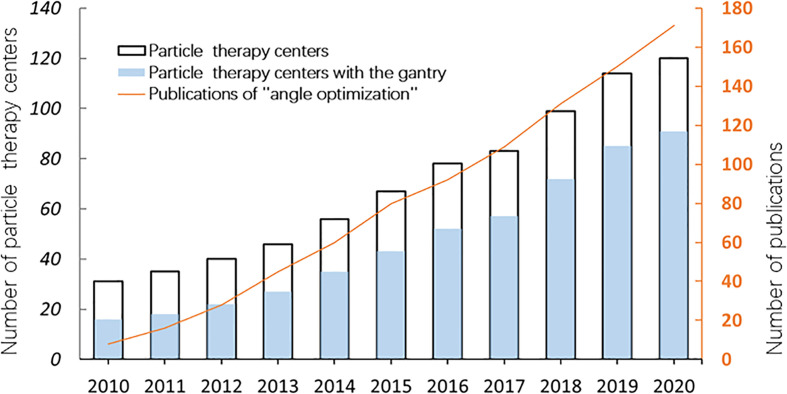
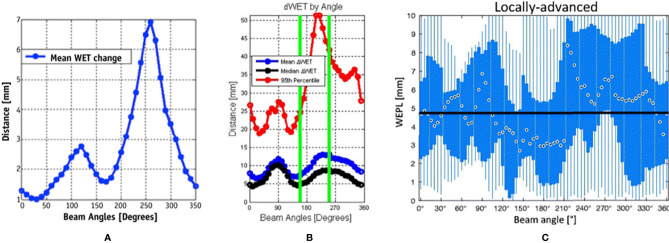
The popularity of particle radiotherapy has grown exponentially over recent years owing to the marked advantage of the depth-dose curve and its unique biological property. However, particle therapy is sensitive to changes in anatomical structure, and the dose distribution may deteriorate. In particle therapy, robust beam angle selection plays a crucial role in mitigating inter- and intrafractional variation, including daily patient setup uncertainties and tumor motion. With the development of a rotating gantry, angle optimization has gained increasing attention. Currently, several studies use the variation in the water equivalent thickness to quantify anatomical changes during treatment. This method seems helpful in determining better beam angles and improving the robustness of planning. Therefore, this review will discuss and summarize the robust beam angles at different tumor sites in particle radiotherapy.

Keywords: beam angle optimization; dose distribution; particle radiotherapy; robust planning; water equivalent pass length.


Conflict of interest statement

The authors declare that the research was conducted in the absence of any commercial or financial relationships that could be construed as a potential conflict of interest.

Figures

Figure 1
Figure 1
The number of particle therapy centers in operation and publications on “angle optimization” in the past 10 years (2010–2020). The number of facilities was verified on the webpage of the Particle Therapy Cooperative Group (PTCOG https://www.ptcog.ch/). The papers were filtered by searching for the following keywords: “carbon ion radiotherapy” OR “proton radiotherapy” OR “angle optimization” using Google Scholar (https://scholar.google.com/).
Figure 2
Figure 2
Reference axis for beam angles mentioned in this article. The patient’s anterior direction is defined as 0° (supine position). The orange line shows the X-axis, and the blue line shows the Y-axis; the irradiation angle is clockwise.
Figure 3
Figure 3
Some common facilities of the beam delivery system in particle RT: (A) treatment rooms of carbon-ion RT with vertical and horizontal beam fields at Gunma University (25) (Open Assess); (B) horizontal and 45° oblique beam lines in SAGA HIMAT (26) (Open Assess); (C) a 190° rotating gantry system range −5° to 185° for proton therapy at Barnes-Jewish Hospital (27) (Source: Missouri Medicine, Copyright 2015. Used with permission); and (D) treatment room with the superconducting rotating gantry at the National Institute of Radiological Sciences (28) (Open Assess).
Figure 4
Figure 4
Water equivalent thickness (WET) analysis and beam angle selection in thoracic tumor treatment. (A) Mean values of ΔWET of intrafraction as a function of beam angle (37) (Source: Elsevier. Used with permission). (B) The mean (blue), median (black), and 95th percentile (red) of the absolute value of the ΔWET of intrafractions as a function of beam angles (36) (Open Assess). (C) The absolute difference of water equivalent path length (WEPL) (same as ΔWET) of interfractional variation as a function of the beam angle for locally advanced lung tumor. The black dots indicate the median value over all beam angles, the blue box indicates the 5th and 75th quartiles, and the blue bar indicates the range of ΔWEPL (39) (Source: Taylor & Francis. Used with permission).
Figure 5
Figure 5
Dose distributions of a carbon ion RT in axial sections. The top images show the dose distribution of planning CT (A), the dose distribution with a delay time of (B) 35 s (intra-CT), and (C) 145 s (intra-CT), respectively. Beam overshoot (yellow arrows) and undershoot (white arrows) were observed at scan intervals of 35 and 145 s. The bottom images show the dose distributions of (D) 0°, (E) 90°, (F) 180°, and (G) 270° at 145 s. The green and yellow lines show the shapes of the gross tumor volume and the clinical target volume, respectively. The rainbow contours show the dose distribution (35) (Source: Elsevier. Used with permission).
Figure 6
Figure 6
(A) The black line is the ΔWET (the difference of water equivalent thickness between the planning CT and the CT-on-rail) curve. The beam angles of the original IMPT plan (25°, 355°, 325°, and 295°), the WET-based four fields plan (325°, 295°, 265°, and 235), and the revised seven fields plan (30°, 5°,340°, 315°, 290°, 265°, and 240°) are indicated with the red circle, the green triangle, and the blue circle, respectively. (B) The axial view of the same planar doses and fields for (a) the original IMPT plan, (c) the IMPT plan with beam angles of the minimum values of ΔWET, and (e) the seven-field IMPT plan. The dose–volume histograms of the planned dose (solid line), the accumulated dose (dashed line), and the bands for all fractional doses of (b) the original IMPT plan, (d) the IMPT plan with beam angles of the minimum values of ΔWET, and (f) the seven-field IMPT plan (49) (Source: Elsevier. Used with permission).
Figure 7
Figure 7
(A) Examples of dose distributions for two parallel-opposed lateral fields, (B) one straight anterior field, and (C) two anterior-oblique fields in an axial plane. The prostate, rectum, anterior rectal wall, bladder, bladder wall, and femoral heads are outlined by cyan lines (51) (Source: Elsevier. Used with permission).
Figure 8
Figure 8
Comparison of dose distributions between selected fields based on low tissue heterogeneities and treatment fields. Panels (A, C, E, G) represent dose distribution and the corresponding DVH in the CTV of the manually selected beam angles, and panels (B, D, F, H) indicate dose distribution and the corresponding DVH in the CTV of selected fields based on minimal tissue heterogeneities. The gantry and couch pitch angles are θ and ϕ, respectively. The CTVs are visible in red. The solid lines in panels (C, D, G, H) are DVHs for the dose distributions without setup and range errors. The shaded areas are the variation of the DVHs with range error ( ± 2%) and setup error ( ± 2 mm) (55) (Source: IOP Publishing. Used with permission).
Figure 9
Figure 9
Dose distributions for each beam angle in the transverse plan for comparing the nominal plan and worse-case robust plan of three-beam IMPT plan for one prostate cancer patient (69) (Open Assess).

References

    1. Koehler AM, Preston WM. Protons in Radiation Therapy: Comparative Dose Distributions for Protons, Photons, and Electrons. Radiology (1972) 104:191–5. doi: 10.1148/104.1.191 - DOI - PubMed
    1. Mackie TR, Tomé WA. Advanced Image-Guided External Beam Radiotherapy. Cancer Treat Res (2008) 139:7–39. doi: 10.1007/978-0-387-36744-6_2 - DOI - PubMed
    1. Bassler N, Kantemiris I, Karaiskos P, Engelke J, Holzscheiter MH, Petersen JB. Comparison of Optimized Single and Multifield Irradiation Plans of Antiproton, Proton and Carbon Ion Beams. Radiother Oncol (2010) 95:87–93. doi: 10.1016/j.radonc.2010.02.026 - DOI - PubMed
    1. Shiba S, Shibuya K, Kawashima M, Okano N, Kaminuma T, Okamoto M, et al. . Comparison of Dose Distributions When Using Carbon Ion Radiotherapy Versus Intensity-Modulated Radiotherapy for Hepatocellular Carcinoma With Macroscopic Vascular Invasion: A Retrospective Analysis. Anticancer Res (2020) 40:459–64. doi: 10.21873/anticanres.13974 - DOI - PubMed
    1. Ohno T. Particle Radiotherapy With Carbon Ion Beams. EPMA J (2013) 4:1–7. doi: 10.1186/1878-5085-4-9 - DOI - PMC - PubMed

LinkOut - more resources