. 2021 Sep 9;24(10):103093.
doi: 10.1016/j.isci.2021.103093. eCollection 2021 Oct 22.

Ezh2 harnesses the intranuclear actin cytoskeleton to remodel chromatin in differentiating Th cells

Affiliations

Ezh2 harnesses the intranuclear actin cytoskeleton to remodel chromatin in differentiating Th cells

Moran Titelbaum et al. iScience. .

Abstract

Following their first interaction with the antigen, quiescent naive T-helper (Th; CD4+) cells enlarge, differentiate, and proliferate; these processes are accompanied by substantial epigenetic alterations. We showed previously that the epigenetic regulators the polycomb-group (PcG) proteins have a dual function as both positive and negative transcriptional regulators; however, the underlying mechanisms remain poorly understood. Here, we demonstrate that during Th cell differentiation the methyltransferase activity of the PcG protein Ezh2 regulates post-transcriptionally inducible assembly of intranuclear actin filaments. These filaments are colocalized with the actin regulators Vav1 and WASp, vertically oriented to the T cell receptor, and intermingle with the chromatin fibers. Ezh2 and Vav1 are observed together at chromatin-actin intersections. Furthermore, the inducible assembly of nuclear actin filaments is required for chromatin spreading and nuclear growth. Altogether these findings delineate a model in which the epigenetic machinery orchestrates the dynamic mechanical force of the intranuclear cytoskeleton to reorganize chromatin during differentiation.

Keywords: Biological sciences; Cell biology; Immunology.


Conflict of interest statement

The authors declare no competing interests.

Figures

None
Graphical abstract
Figure 1
Figure 1
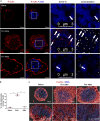
Inducible nuclear F-actin in the 24 h differentiating Th cells (A) Immunofluorescence staining of naive, 24 h- and 48 h-differentiating Th1 cells using DAPI (blue) and Phalloidin conjugated to biotin followed by cy3-streptavidin (red). Colocalization rate of the merged channels of nuclear F-actin and chromatin (overlapping signal in white). Images of wider fields and of the Th2 staining are presented in Figure S1A. (B) Comparison of the percentage of the visible nuclear F-actin-harbored cells between naive (n = 230), 24 h (n = 185)- and 48 h (n = 176)- differentiating Th1 cells. Data are represented as mean ± SEM. p values were computed with proportion Z-tests and exact Fischer’s test ∗p < 0.05, ∗∗p < 0.01, ∗∗∗p < 0.001. (C) Z stacks of representative images of naive and Th1 cells from (A) were combined into a computational 3D-structures using the IMARIS 9.5 software (chromatin in transparent blue to facilitate F-actin visualization, and F-actin in red). The images are presented at the XY direction. The Th2 computational images are shown in Figure S1B. (D) Computational 3D-structure of 24 h-differentiating Th1 cells are presented at the XZ direction. (E) The differentiating Th cells were stimulated directly on the slide with anti-CD3 and anti-CD28 abs to maintain the orientation toward the TCR. The staining procedure was performed directly on the slide. Computational 3D-structure at XZ direction presenting F-actin (red), CD3ε (green), and chromatin (blue). Wider fields and zoom-in images are presented in Figures S1C. The experiments were performed in two independent biological replicates with similar results. (F) (left) Immunofluorescence staining of 24 h-differentiating Th1 cells applying the cytospin protocol, using Phalloidin conjugated to biotin followed by cy3-streptavidin (red) and Hoechst (blue). (Right) Colocalization rate of nuclear F-actin and chromatin (overlapping signal in white). Images of Wider fields are presented in Figures S1C and S1D. The experiments were performed in two independent biological replicates with similar results. (GK) (G) Immunofluorescence staining of the 24 h-differentiating Th1 cells using Phalloidin (red) and anti-Vav1 Ab (green). DNA was stained with Hoechst (blue). (H) Magnification of the white square in (I). The Th2 staining and images of wider fields are presented in Figure S1H. (I) Colocalization rate of nuclear F-actin and Vav1 (overlapping signal in white). The white dashed line, which was determined by Hoechst staining, defines the nuclear periphery (ROI) for nuclear colocalization assessment. (J) Colocalization rate of nuclear Vav1 and chromatin (overlapping signal in white). (K) Computational 3D-structure of Vav1, F-actin and chromatin. The Th2 images are presented in Figure S1K. Colocalization of Vav1, F-actin and chromatin in naive and 48 h differentiating Th cells are presented in Figures S1I and S1J. The experiments were performed in three independent biological replicates with similar results. Secondary Ab only was used as Control (Figure S1N). Images were acquired by super resolution (SR) Hyvolution microscope.
Figure 1
Figure 1
Inducible nuclear F-actin in the 24 h differentiating Th cells (A) Immunofluorescence staining of naive, 24 h- and 48 h-differentiating Th1 cells using DAPI (blue) and Phalloidin conjugated to biotin followed by cy3-streptavidin (red). Colocalization rate of the merged channels of nuclear F-actin and chromatin (overlapping signal in white). Images of wider fields and of the Th2 staining are presented in Figure S1A. (B) Comparison of the percentage of the visible nuclear F-actin-harbored cells between naive (n = 230), 24 h (n = 185)- and 48 h (n = 176)- differentiating Th1 cells. Data are represented as mean ± SEM. p values were computed with proportion Z-tests and exact Fischer’s test ∗p < 0.05, ∗∗p < 0.01, ∗∗∗p < 0.001. (C) Z stacks of representative images of naive and Th1 cells from (A) were combined into a computational 3D-structures using the IMARIS 9.5 software (chromatin in transparent blue to facilitate F-actin visualization, and F-actin in red). The images are presented at the XY direction. The Th2 computational images are shown in Figure S1B. (D) Computational 3D-structure of 24 h-differentiating Th1 cells are presented at the XZ direction. (E) The differentiating Th cells were stimulated directly on the slide with anti-CD3 and anti-CD28 abs to maintain the orientation toward the TCR. The staining procedure was performed directly on the slide. Computational 3D-structure at XZ direction presenting F-actin (red), CD3ε (green), and chromatin (blue). Wider fields and zoom-in images are presented in Figures S1C. The experiments were performed in two independent biological replicates with similar results. (F) (left) Immunofluorescence staining of 24 h-differentiating Th1 cells applying the cytospin protocol, using Phalloidin conjugated to biotin followed by cy3-streptavidin (red) and Hoechst (blue). (Right) Colocalization rate of nuclear F-actin and chromatin (overlapping signal in white). Images of Wider fields are presented in Figures S1C and S1D. The experiments were performed in two independent biological replicates with similar results. (GK) (G) Immunofluorescence staining of the 24 h-differentiating Th1 cells using Phalloidin (red) and anti-Vav1 Ab (green). DNA was stained with Hoechst (blue). (H) Magnification of the white square in (I). The Th2 staining and images of wider fields are presented in Figure S1H. (I) Colocalization rate of nuclear F-actin and Vav1 (overlapping signal in white). The white dashed line, which was determined by Hoechst staining, defines the nuclear periphery (ROI) for nuclear colocalization assessment. (J) Colocalization rate of nuclear Vav1 and chromatin (overlapping signal in white). (K) Computational 3D-structure of Vav1, F-actin and chromatin. The Th2 images are presented in Figure S1K. Colocalization of Vav1, F-actin and chromatin in naive and 48 h differentiating Th cells are presented in Figures S1I and S1J. The experiments were performed in three independent biological replicates with similar results. Secondary Ab only was used as Control (Figure S1N). Images were acquired by super resolution (SR) Hyvolution microscope.
Figure 2
Figure 2
Ezh2 is associated with nuclear F-actin and actin machinery (A) Immunofluorescence staining of the 24 h-differentiating Th1 cells using Phalloidin (red) and anti-Ezh2 Abs (green). DNA was stained with Hoechst (blue). (B) Magnification of the white square in (A). (C) Colocalization rate of nuclear Ezh2 and F-actin (overlapping signal in white). The white dashed line, which was determined by Hoechst staining, defines the nuclear periphery (ROI) for nuclear colocalization assessment. (D) Colocalization rate of nuclear Ezh2 and chromatin. (E) Computational 3D-structure of F-actin, Ezh2 and chromatin. The images of wider Th2 fields are presented in Figures S2A and S2B. Association of Ezh2 with the chromatin in naive and 48 h-differentiating Th cells are presented in Figures S2C and S2D. The experiments were performed in three independent biological replicates with similar results.
Figure 3
Figure 3
Nuclear Ezh2 is colocalized with chromatin-associated Vav1 (A–D) (A) Immunofluorescence staining of the 24 h-differentiating Th1 cells using anti-Ezh2 mouse monoclonal Ab followed by 488 anti-mouse (green), and anti-Vav1 Ab (red). DNA was stained with Hoechst. (B) Magnification of the white square in (I). (C) Colocalization rate of nuclear Ezh2 and Vav1 (overlapping signal in white). The white dashed line, which was determined by Hoechst staining, defines the nuclear periphery (ROI) for nuclear colocalization assessment. (D) Computational 3D-structure of Vav1 and Ezh2. The full images are presented in Figure S3A. The experiments were performed in three independent biological replicates with similar results. (E–H) ChIP assay assessing the chromatin binding activity of Ezh2 and/or Vav1 in the 24 h-differentiating Th cells (E) ChIP-seq assessing the binding activity of Ezh2 in Th1 and Th2 cells (Table S1). (F) ChIP-seq assessing proximal binding activity of Ezh2 and Vav1 around the same gene in Th1 cells (Table S2a). (G) ChIP-seq assessing proximal binding activity of Ezh2 and Vav1 around the same gene in Th2 cells (Table S2b). (H) ChIP-seq assessing the binding activity of Ezh2/Vav1 in both Th1 and Th2 cells. (I and J) Illustration of the binding activity of Ezh2 and Vav1 at the ardcc3 and U2 genes. The peaks were plotted using wiggle plot in Seqmonk free software. The illustration of the binding activity in the Th2 cells is presented in Figures S3I and S3J. The experiments were performed twice (FDR < 0.05).
Figure 4
Figure 4
Nuclear Ezh2/Vav1 are colocalized with F-actin at the chromatin context (A) Immunofluorescence staining of the 24 h-differentiating Th1 cells using Phalloidin (red), anti-Ezh2 mouse monoclonal Ab (green) and anti-Vav1 Ab (blue), followed by colocalization (white spots). DNA was stained with Hoechst (gray). (B) Computational 3D-structures of the images in (A). (C) Immunofluorescence staining of the 24 h-differentiating Th1 cells using Phalloidin (red), anti-Ezh2 Ab (green), and anti-Vav1 Ab (blue). The image is followed by magnification of the white square. Images were acquired by SR STED microscope. The experiments were performed in three independent biological replicates with similar results.
Figure 5
Figure 5
The assembly of F-actin is Ezh2-dependent (A) Immunofluorescence staining using Phalloidin (red), and Hoechst (blue) followed by computational 3D-image (IMARIS) of the 24 h-differentiating Th1 cells with or without the presence of either Ezh2 (1.75 mM UNC1999) or F-actin (10.4mM cytochalasin B) inhibitors for the last 2 h of stimulation. (B) Comparison of the percentage of visible nuclear F-actin harbored cells (mean values) between control 24 h (n = 42)-differentiating Th1 cells, differentiating Th1 cells with either Ezh2 inhibitor (n = 27)- or F-actin inhibitor (n = 20) for the last 6 h of stimulation from (A). The error bars represent the standard deviation. p values were computed with proportion Z-tests and exact Fischer’s test ∗p < 0.05, ∗∗p < 0.01, ∗∗∗p < 0.001. (C) Immunofluorescence staining using Phalloidin conjugated to biotin followed by cy3-streptavidin (red) and anti-Ezh2 rabbit polyclonal Ab followed by 488 anti-rabbit (green), and computational 3D-image (IMARIS) of the 24 h-differentiating Th1 cells with or without the presence of either Ezh2 (UNC1999) or F-actin (cytochalasin B) inhibitors for the last 6 h of stimulation. The Th2 staining and wider field images are presented in Figures S5A and S5B. (D) Comparison of the percentage of visible nuclear F-actin harbored cells between control 24 h (n = 57)-differentiating Th1 cells, differentiating Th1 cells with either Ezh2 inhibitor (n = 41)- or F-actin inhibitor (n = 36) for the last 2 h of stimulation from (B). Data are represented as mean ± SEM. p values were computed with proportion Z-tests and exact Fischer’s test ∗p < 0.05, ∗∗p < 0.01, ∗∗∗p < 0.001.
Figure 6
Figure 6
Ezh2-dependent methyltransferase activity regulates both the transcription of actin and post-transcriptionally the assembly of F-actin (A and B) (A) RNA-seq for the 24 h-differentiating Th1 and Th2 cells with or without the presence of either Ezh2 (UNC1999) or F-actin (cytochalasin B) inhibitors for the last 6 h of stimulation. Sequences were aligned using bowtie and analyzed for similarity by PCA plot, showing the differences between presence or absence of inhibitors. (B) comparison of the total mRNA counts of the indicated genes in the 24 h-differentiated Th1 cells with or without the presence of Ezh2 (UNC1999) for the last 6 h of stimulation. The lists of the mRNAs are presented in Tables S3a and S3b. Data are represented as mean ± SEM. Two-tailed t test was performed, p value<0.01 ∗, n.s – not significant, p value > 0.05. The expression levels in Th2 cells are presented in Figure S6B. (C) The expression levels of the indicated proteins in the 24 h-differentiated Th1 cells with or without the presence of UNC1999 for the last 6 h of stimulation as determined by nuclear proteomics. Data are represented as mean ± SEM. Two-tailed t test was performed, p value > 0.05. The expression levels in Th2 cells are presented in Figure S6C. (D and E) (D) Immunofluorescence staining using Phalloidin (red) of the 24 h-differentiating Th1 cells with or without the presence of actinomycin D (1μM) for the last 6 h of stimulation. The total RNA level was measured using Qbit (RNA BR Assay Kit). Wider field images of Th1 cells are presented in Figure S6D. (E) Comparison of the percentage of visible nuclear F-actin harbored cells between 24 h-differentiating cells with (n = 24) or without (n = 20) Actinomycin D. Data are represented as mean ± SEM. p values were computed with proportion Z tests and exact Fischer’s test p > 0.05.
Figure 7
Figure 7
Ezh2 regulates chromatin spreading and nuclear expansion (A) Computational 3D-image of the 24 h-differentiating Th1 cells with or without the presence of either UNC1999 or cytochalasin B for the last 6 h of stimulation. DNA was stained with Hoechst. (B) Wider field images of (A) (including of the naive Th cells). (C) Quantitative analysis using IMARIS (surface application was applied) of nuclear volume of the Naïve (n = 197), 24 h differentiating Th1 cells with either Ezh2 inhibitor (n = 174), F-actin inhibitor (n = 177) or without (n = 190). Data are represented as mean ± SEM. Using PRISM software analysis, two-tailed t test was performed, p value < 0.0001 ∗∗∗∗, p value < 0.05 ∗∗.
Figure 8
Figure 8
Nuclear F-actin drives chromatin spreading and nuclear expansion (A) Computational 3D-imaging of the chromatin (stained with Hoechst) in the 24 h-differentiating Th2 cells, which were electroporated with either Actin-NLS-R62D (n = 161) mRNA or Actin-NLS-WT (n = 276) mRNA as a control, 6 h before harvesting. Wider fields of the control images demonstrating the downregulation of nuclear actin in the presence of Actin-NLS-R62D is presented in Figure S8. (B) Quantitative analysis using IMARIS (surface application was applied) of nuclear volume of the Th2 cells from (A). Data are represented as mean ± SEM. Using PRISM software analysis, two-tailed t test was performed, p value < 0.0001 ∗∗∗∗, p value < 0.05 ∗∗.

References

    1. Ansel K.M., Djuretic I., Tanasa B., Rao A. Regulation of Th2 differentiation and Il4 locus accessibility. Annu. Rev. Immunol. 2006;24:607–656. - PubMed
    1. Anwar T., Arellano-Garcia C., Ropa J., Chen Y.C., Kim H.S., Yoon E., Grigsby S., Basrur V., Nesvizhskii A.I., Muntean A. p38-mediated phosphorylation at T367 induces EZH2 cytoplasmic localization to promote breast cancer metastasis. Nat. Commun. 2018;9:2801. - PMC - PubMed
    1. Avni D., Avni O. Extracellular vesicles: schistosomal long-range precise weapon to manipulate the immune response. Front. Cell Infect. Microbiol. 2021;11:649480. - PMC - PubMed
    1. Avni O., Koren O. Molecular (Me)micry? Cell Host Microbe. 2018;23:576–578. - PubMed
    1. Avni O., Lee D., Macian F., Szabo S.J., Glimcher L.H., Rao A. T(H) cell differentiation is accompanied by dynamic changes in histone acetylation of cytokine genes. Nat. Immunol. 2002;3:643–651. - PubMed