Clinical Trial
. 2021 Sep 3;2(9):100392.
doi: 10.1016/j.xcrm.2021.100392. eCollection 2021 Sep 21.

Molecular predictors of response to pembrolizumab in thymic carcinoma

Affiliations
Clinical Trial

Molecular predictors of response to pembrolizumab in thymic carcinoma

Yongfeng He et al. Cell Rep Med. .

Abstract

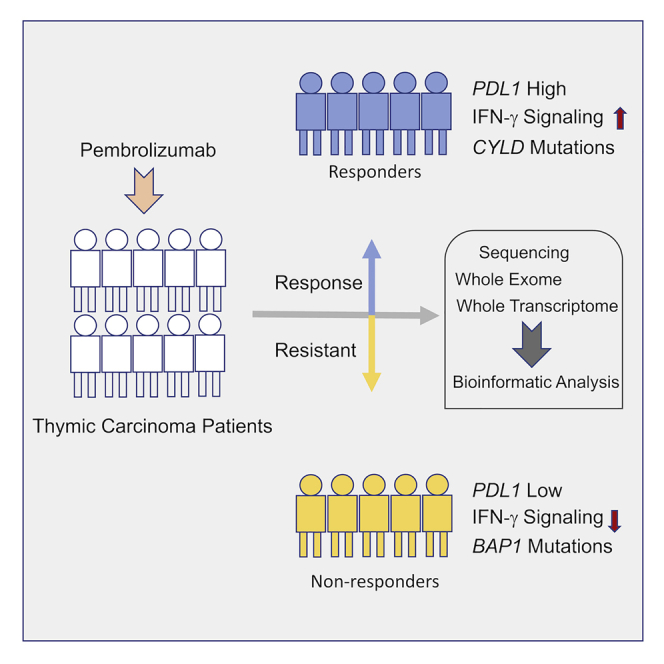
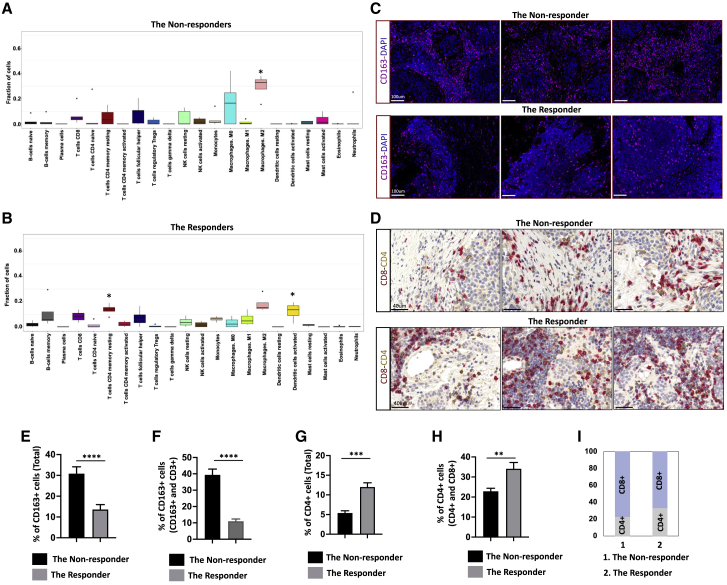
Thymic carcinoma is rare and has a poorer prognosis than thymomas. The treatment options are limited after failure of platinum-based chemotherapy. We previously performed a single-center phase II study of pembrolizumab in patients with advanced thymic carcinoma, showing a 22.5% response rate. Here, we characterize the genomic and transcriptomic profile of thymic carcinoma samples from 10 patients (5 non-responders versus 5 responders) in this cohort, with the main aim of identifying potential predictors of response to immunotherapy. We find that expression of PDL1 and alterations in genes or pathways that correlated with PD-L1 expression (CYLD and BAP1) could be potential predictors for response or resistance to immunotherapy in patients with advanced thymic carcinoma. Our study provides insights into potential predictive markers/pathways to select patients with thymic carcinoma for anti-PD-1 immunotherapy.

Trial registration: ClinicalTrials.gov NCT02364076.

Keywords: immune checkpoint inhibitors; predictors of response; thymic carcinoma; whole exome sequencing; whole-transcriptome sequencing.


Conflict of interest statement

The authors have declared that no competing interests exist.

Figures

None
Graphical abstract
Figure 1
Figure 1
Summary of mutations and SNVs in the thymic carcinoma samples (A) Summary of mutations, gene function, and sequence ontologies in samples of patients with thymic carcinoma (n = 9) (4 non-responders versus 5 responders). Distribution of indicated mutations by gene functions and sequence ontologies are displayed as pie charts. (B) Number of SNVs with allelic frequency greater than 10% in samples of patients with thymic carcinoma (n = 9) are shown in the bar graph (4 non-responders versus 5 responders). See also Figures S1 and S2.
Figure 2
Figure 2
Mutational landscape of thymic carcinoma patients treated with pembrolizumab (A) Clinically relevant somatic mutations as revealed by whole-exome sequencing (n = 9) (4 non-responders versus 5 responders). ∗, represents recurrently mutated genes in the responders. #, represents recurrently mutated genes in the non-responders. (B) Copy number variations in the indicated samples (n = 9) (4 non-responders versus 5 responders). ∗, represents the genes with copy loss in the same samples. (C) Number of genes that show germline mutations in each patient sample (n = 9) (4 non-responders versus 5 responders). Germline mutations were determined by whole-exome sequencing with blood-derived DNA samples. See also Figure S3 and Table S2.
Figure 3
Figure 3
Determining the signaling pathways and molecular predictors in the non-responders and the responders using RNA sequencing (RNA-seq) (A) Pie diagram showing the number of differentially expressed genes (DEGs) in the non-responders versus the responders, including 1,341 upregulated DEGs and 1,460 downregulated DEGs. (B) Ten significantly enriched pathways in downregulated DEGs. Pathway analysis was performed with downregulated DEG list using gProfiler. Ten pathways related to immune response or tumorigenesis were selected and presented in a bar graph. The x axis represents −log2 (p value). ∗, represents the pathways being validated in (C). (C) Heatmap of 10 representative DEGs involved in the indicated pathways (n = 8; 4 non-responders versus 4 responders). Heatmap with additional genes in the indicated pathway is shown in Figure S6. (D) GSEA analyses with hallmark gene sets reveal negative enrichment of pathways in DEGs of the non-responders versus the responders. Six pathways related to immune response or tumorigenesis were selected and presented in a bar graph. The x axis represents Normalized enrichment score (NES) scores. (E) GSEA plot of interferon gamma response pathway. (F) Heatmap showing the expression pattern of representative immune checkpoint regulators in the indicated samples (n = 8; 4 non-responders versus 4 responders). ∗, stands for the genes from the DEG list that statistically significant. See also Figures S4–S6 and Tables S1, S3, S4, S5, S6, and S7.
Figure 4
Figure 4
CIBERSORT analysis of immune gene signatures in the non-responders and the responders (A and B) Different proportion of 22 types of immune cells that are associated with the samples were identified with CIBERSORT in both non-responders (A) and responders (B). (A) Result of CIBERSORT analysis in the non-responders. ∗, stands for the cell population that is significantly different in the non-responders, in comparison to the responders. (B) Result of CIBERSORT analysis in the responders. ∗, stands for the cell population that is significantly different in the responders, in comparison to the non-responders. The non-responders had higher fraction of M2 macrophages (p = 0.02), whereas the responders showed a higher fraction of CD4+ memory resting T cells (p = 0.01) and activated dendritic cells (p = 0.04). (C) Representative images of IF staining with thymic carcinoma tissues from the non-responder and the responder using CD163 antibody (magenta). DAPI was used as a nuclear marker (dark blue). The scale bar represents 100 μm. (D) Representative images of double IHC staining with thymic carcinoma tissues from the non-responder and the responder by using both CD8 (red) and CD4 (brown) antibodies. The scale bar represents 40 μm. (E) Bar graph shows the percentage of CD163+ cells in both the non-responder and the responder groups, based on the IF staining. Six areas from each group were selected, and CD163+ and CD163− cells were counted using ImageJ. ∗∗∗∗p < 0.0001. (F) Bar graph shows the percentage of CD163+ cells among CD163+ and CD3+ cells in both the non-responder and the responder groups, based on the IF staining. Six areas from each group were selected, and CD163+ and CD3+ cells were counted using ImageJ. ∗∗∗∗p < 0.0001. (G) Bar graph showing the percentage of CD4+ cells in both the non-responder and the responder groups, based on IHC staining. Six areas from each group were selected, and CD4+ cells and CD4− cells were counted using ImageJ. ∗∗∗p < 0.001. (H) Bar graph showing the percentage of CD4+ cells among CD4+ and CD8+ cells in both the non-responder and the responder groups, based on IHC staining. Six areas from each group were selected, and CD4+ cells and CD8+ cells were counted using ImageJ. ∗∗p < 0.01. The above data are presented as the mean ± SEM (n = 6). (I) Bar graph showing the percentage of CD8+ and CD4+ cells in both the non-responder and the responder groups, based on the counting results from (H); the average percentage in each group was used to generate the graph. Also see Figure S7.

References

    1. Greene M.A., Malias M.A. Aggressive multimodality treatment of invasive thymic carcinoma. J. Thorac. Cardiovasc. Surg. 2003;125:434–436. - PubMed
    1. Kondo K., Monden Y. Therapy for thymic epithelial tumors: a clinical study of 1,320 patients from Japan. Ann. Thorac. Surg. 2003;76:878–884, discussion 884–885. - PubMed
    1. Venuta F., Anile M., Diso D., Vitolo D., Rendina E.A., De Giacomo T., Francioni F., Coloni G.F. Thymoma and thymic carcinoma. Eur. J. Cardiothorac. Surg. 2010;37:13–25. - PubMed
    1. Petrini I., Meltzer P.S., Kim I.K., Lucchi M., Park K.S., Fontanini G., Gao J., Zucali P.A., Calabrese F., Favaretto A. A specific missense mutation in GTF2I occurs at high frequency in thymic epithelial tumors. Nat. Genet. 2014;46:844–849. - PMC - PubMed
    1. Radovich M., Pickering C.R., Felau I., Ha G., Zhang H., Jo H., Hoadley K.A., Anur P., Zhang J., McLellan M., Cancer Genome Atlas Network The Integrated Genomic Landscape of Thymic Epithelial Tumors. Cancer Cell. 2018;33:244–258.e10. - PMC - PubMed

Publication types

Substances

Associated data