. 2021 Sep 7;2(9):100393.
doi: 10.1016/j.xcrm.2021.100393. eCollection 2021 Sep 21.

Infant gut strain persistence is associated with maternal origin, phylogeny, and traits including surface adhesion and iron acquisition

Affiliations

Infant gut strain persistence is associated with maternal origin, phylogeny, and traits including surface adhesion and iron acquisition

Yue Clare Lou et al. Cell Rep Med. .

Abstract

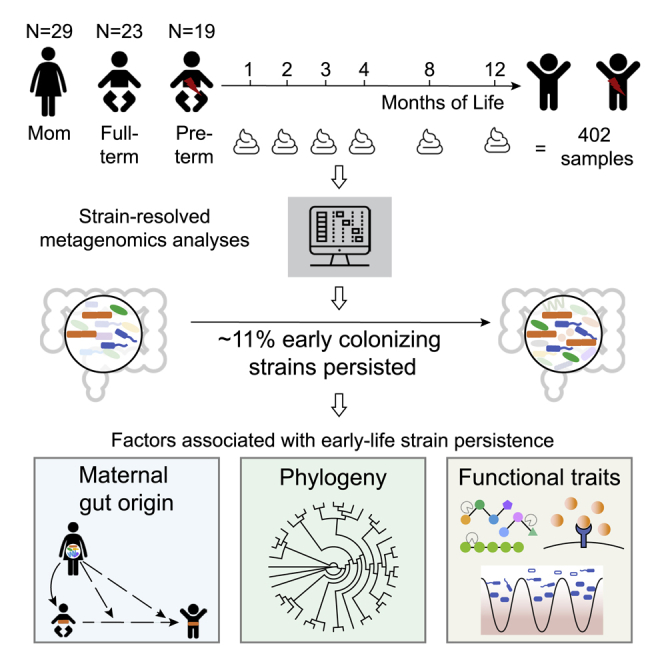
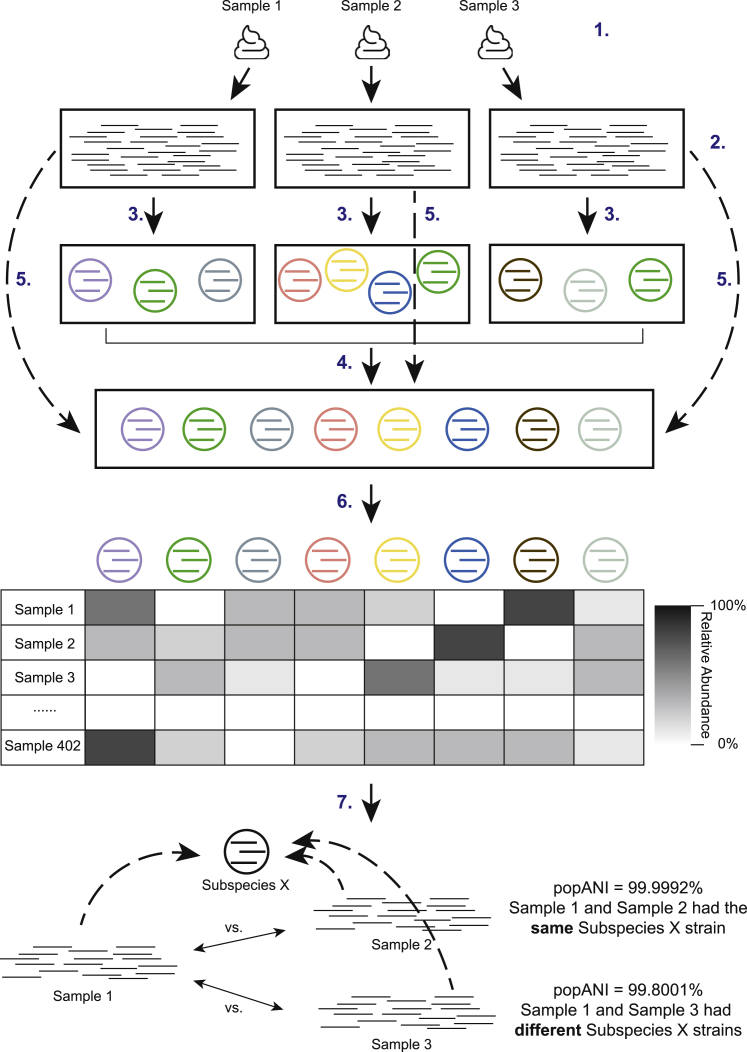
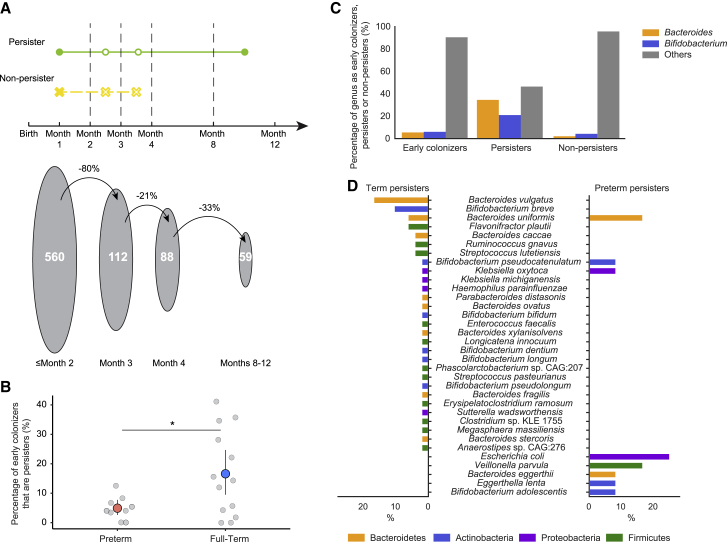
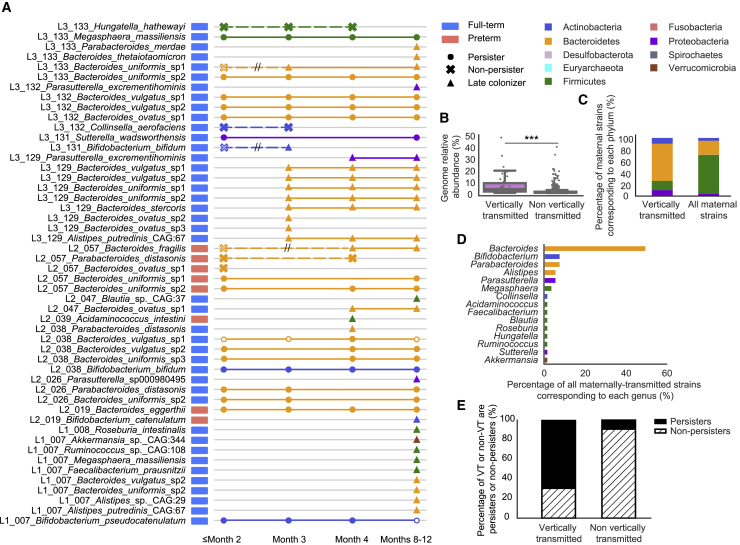
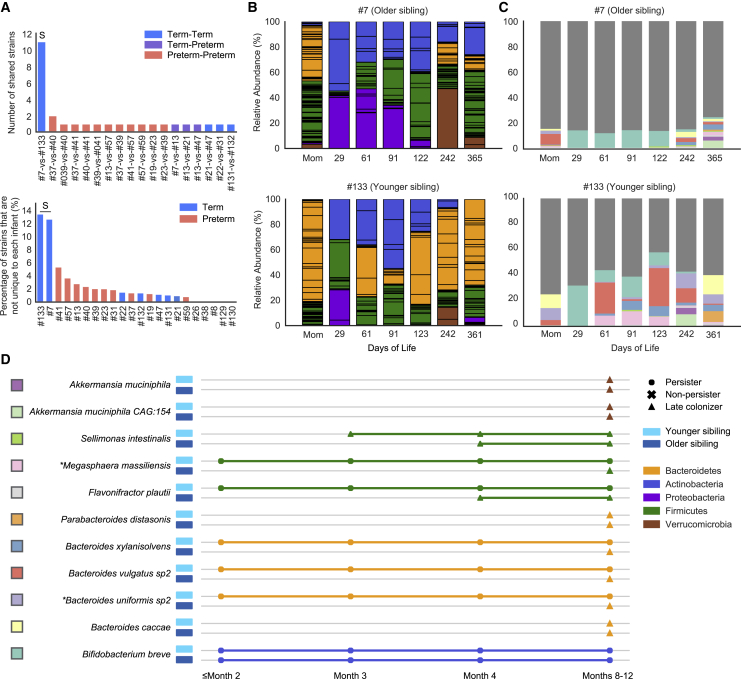
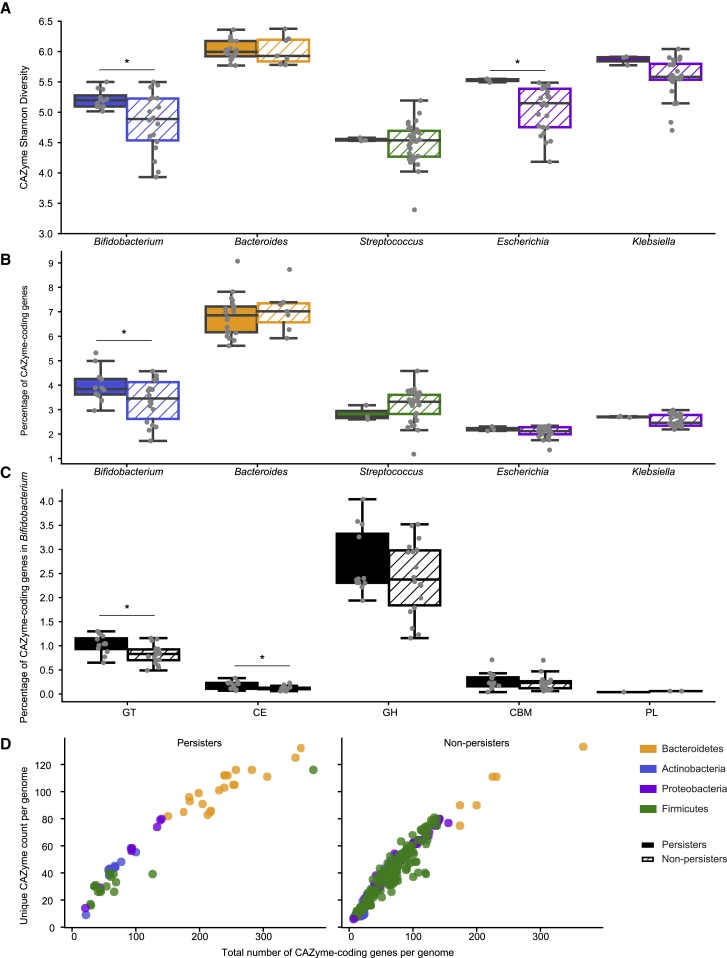
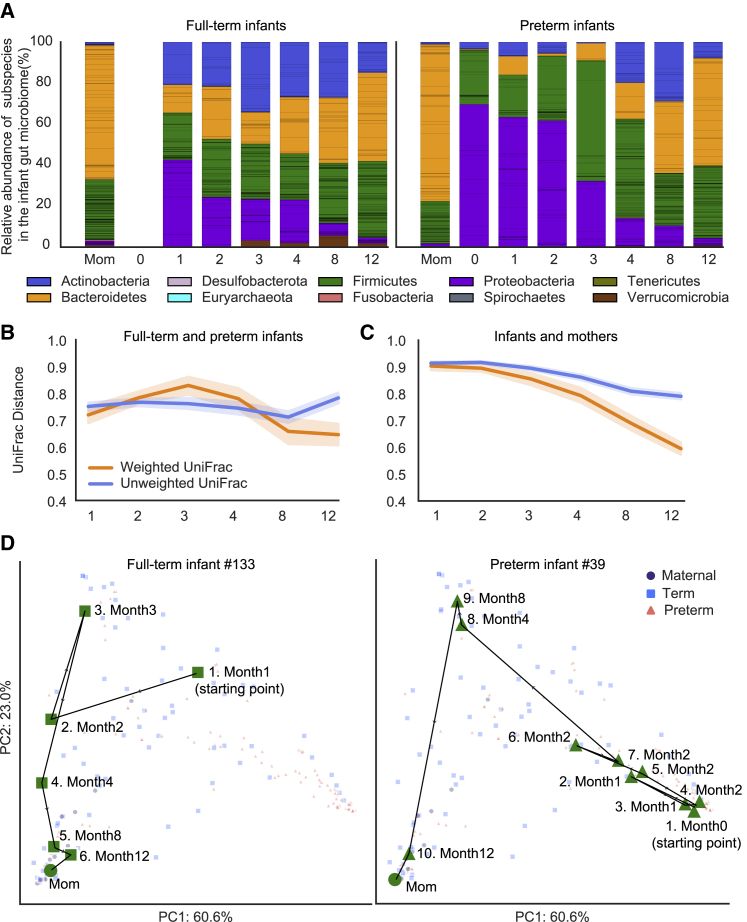
Gut microbiome succession affects infant development. However, it remains unclear what factors promote persistence of initial bacterial colonizers in the developing gut. Here, we perform strain-resolved analyses to compare gut colonization of preterm and full-term infants throughout the first year of life and evaluate associations between strain persistence and strain origin as well as genetic potential. Analysis of fecal metagenomes collected from 13 full-term and 9 preterm infants reveals that infants' initially distinct microbiomes converge by age 1 year. Approximately 11% of early colonizers, primarily Bacteroides and Bifidobacterium, persist during the first year of life, and those are more prevalent in full-term, compared with preterm infants. Examination of 17 mother-infant pairs reveals maternal gut strains are significantly more likely to persist in the infant gut than other strains. Enrichment in genes for surface adhesion, iron acquisition, and carbohydrate degradation may explain persistence of some strains through the first year of life.

Keywords: Infant gut microbiome; community ecology; early-life gut colonization; strain-resolved metagenomics.


Conflict of interest statement

J.F.B. is a cofounder of Metagenomi. The other authors declare no completing interests.

Figures

None
Graphical abstract
Figure 1
Figure 1
Genome-resolved metagenomics pipeline Fecal samples collected from infants and their mothers (1) were subjected to shotgun sequencing (2). Reads were subsequently processed and assembled into draft genomes (3), which were dereplicated at 98% gANI to result in 1,005 genomes that represented unique microbial subspecies (4). Reads from each individual sample were then mapped to 1,005 subspecies (5) for sample-specific genome detection and sample-specific relative abundance calculation (6). inStrain was run to identify same strains of the subspecies between samples of the same or different infants (7). See also Figure S1 and Tables S1 and S2.
Figure 2
Figure 2
Certain bacterial strains persist in the infant gut from birth until near age 1 year (A) (Top) Definition of persister (present both before month 2 and after month 8) and non-persister (present before month 2 and absent after month 4) bacterial strains. (Bottom) The decrease in the number of early colonizers (strains detected in the first 2 months of life) present at sequential time points. (B) Percentage of early colonizers that persisted in the gut microbiomes of preterm and full-term infants. Light gray circles indicate values for individual infants. Salmon-red and sky-blue circles represent the mean values for preterm and full-term infants, respectively. The lines stretching out from the circles represent the upper and lower bounds of bootstrapped 95% CI of the mean values (∗p < 0.05). (C) Percentage of early colonizers, persisters, and non-persisters by genus. Genera other than Bacteroides and Bifidobacterium are grouped into “Others.” (D) Species composition of persisters in full-term (left) and preterm (right) infants. Bars are colored by phylum. The x axis is the percentage of the specific species in full-term (left) and preterm (right) persisters.
Figure 3
Figure 3
Maternally derived intestinal bacterial strains are more likely to be persisters in the infant gut (A) Schematic of all 50 strains that were maternally transmitted to infants. Each row represents an infant-specific, maternally transmitted strain, and marks represent months in which the strain was detected. Shapes represent distinct strain identities (i.e., persisters, non-persisters, and late colonizers). Solid marks indicate ≥99.999% popANI between the infant and mother strains, and hollow marks indicate windows in which the identity of the infant and mother strains fell below the strain cutoff. Non-persisters of the same subspecies are connected via dashed lines, whereas persisters or late colonizers of the same subspecies are connected via solid lines. Double hashing indicates a non-persister early colonizer that was not maternally derived being replaced by a closely related maternal intestinal strain. (B) Relative abundances of maternal subspecies that were and were not vertically transmitted to the infant gut microbiomes (∗∗∗p < 0.001). Each dot represents a subspecies detected from a maternal fecal sample. (C) Phylum-level taxonomy of strains that were maternally transmitted to infants as well as all maternal gut strains. (D) Percentage of maternally transmitted strains by genus and colored by phylum. (E) Percentage of persisters (solid black) and non-persisters (dashed) derived from the maternal gut microbiomes and other sources.
Figure 4
Figure 4
A pair of siblings shared significantly more bacterial strains than non-related infants (A) (Top) The number of strains that were shared between infant pairs. (Bottom) The percentage of the infant gut microbiome that shared near-identical (≥99.999% popANI) strains with other infants. “S” in both panels refers to the infants 7 and 133 sibling pair. (B) Overview of year-1 gut microbiome compositions of the siblings. Bar height represents normalized subspecies relative abundance, and bars are colored by phylum. Sections of the same color with horizontal black lines correspond to individual subspecies of the same phylum. All maternal fecal samples were grouped into “Mom” on the x axis. (C) Normalized relative abundance of the 11 strains shared between the siblings throughout the first year of life. Each shared strain is assigned to a unique color, and the rest of the strains were all colored in dark gray. (D) Longitudinal detection of the 11 strains shared between the siblings. Colored squares on the left of the species names correspond to the barplot color scheme in (C). Each row represents a sibling shared strain and is colored based by phylum. Shapes represent distinct strain identities. Older and younger siblings are represented by darker and light blue rectangles, respectively (∗maternally transmitted strains). See also Figure S3.
Figure 5
Figure 5
Diverse carbohydrate active enzymes were detected in persisters of certain bacterial genera (A and B) Comparison of CAZyme diversity (A) and coding density (B) per genome between persisters (solid color) and non-persisters (dashed) of the five bacterial genera that passed the filtering criteria (∗p < 0.05). Boxplots are colored by phylum. (C) Comparison of CAZyme coding density per CAZyme family per genome between Bifidobacterium persisters (solid black) and non-persisters (dashed) (∗p < 0.05). (D) Correlation between the number of genes coding for CAZymes (x axis) and unique CAZyme counts (y axis). Each dot represents a persister (left) or non-persister (right) genome and is colored by phylum.
Figure 6
Figure 6
Community assembly dynamics of full-term and preterm infant gut microbiome during the first year of life (A) Overview of year-1 gut microbiome compositions of the full-term and preterm infants. Bar height represents normalized subspecies relative abundance, and bars are colored by phylum. Sections of the same color with horizontal black lines correspond to individual subspecies of the same phylum. x axis represents months of life, and all maternal fecal samples were grouped into “Mom” on the x axis. (B and C) Weighted (orange) and unweighted (blue) UniFrac comparing the compositional changes of the gut microbiomes of full-term and preterm infants (B) as well as of infants and mothers (C). x axis represents months of life. See also Figures S7A and S7B. (D) Gut microbiome assembly trajectories of a representative full-term (left) and a representative preterm (right) infant. Shapes and colors represent distinct sample types. Samples belonging to the representative infant are colored green to distinguish them from samples from other infants, which are colored based on sample types and are in less-saturated colors. Samples are numbered according to infant age at the time of collection. PCA is based on weighted UniFrac distance. See also Figure S7C.

References

    1. Robertson R.C., Manges A.R., Finlay B.B., Prendergast A.J. The human microbiome and child growth—first 1000 days and beyond. Trends Microbiol. 2019;27:131–147. - PubMed
    1. Wang S., Ryan C.A., Boyaval P., Dempsey E.M., Ross R.P., Stanton C. Maternal vertical transmission affecting early-life microbiota development. Trends Microbiol. 2020;28:28–45. - PubMed
    1. Baumann-Dudenhoeffer A.M., D’Souza A.W., Tarr P.I., Warner B.B., Dantas G. Infant diet and maternal gestational weight gain predict early metabolic maturation of gut microbiomes. Nat. Med. 2018;24:1822–1829. - PMC - PubMed
    1. Shao Y., Forster S.C., Tsaliki E., Vervier K., Strang A., Simpson N., Kumar N., Stares M.D., Rodger A., Brocklehurst P. Stunted microbiota and opportunistic pathogen colonization in caesarean-section birth. Nature. 2019;574:117–121. - PMC - PubMed
    1. Yassour M., Vatanen T., Siljander H., Hämäläinen A.-M., Härkönen T., Ryhänen S.J., Franzosa E.A., Vlamakis H., Huttenhower C., Gevers D., DIABIMMUNE Study Group Natural history of the infant gut microbiome and impact of antibiotic treatment on bacterial strain diversity and stability. Sci. Transl. Med. 2016;8:343ra81. - PMC - PubMed

Publication types