. 2021 Sep 23;2(9):100394.
doi: 10.1016/j.xcrm.2021.100394. eCollection 2021 Sep 21.

CCNE1 copy number is a biomarker for response to combination WEE1-ATR inhibition in ovarian and endometrial cancer models

Affiliations

CCNE1 copy number is a biomarker for response to combination WEE1-ATR inhibition in ovarian and endometrial cancer models

Haineng Xu et al. Cell Rep Med. .

Abstract

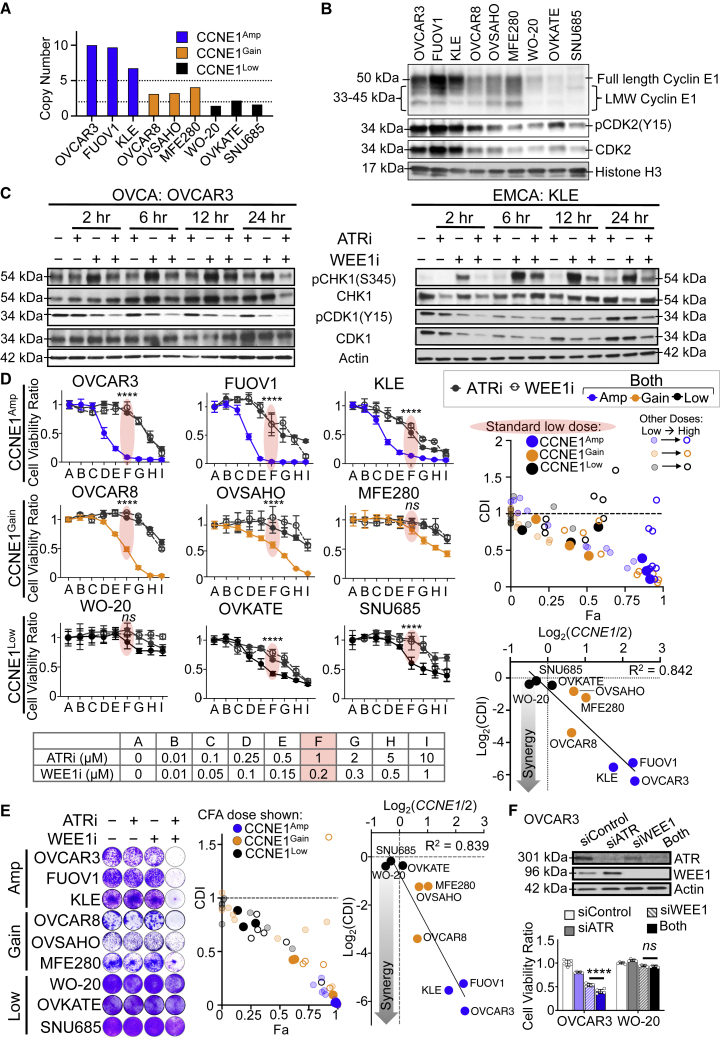
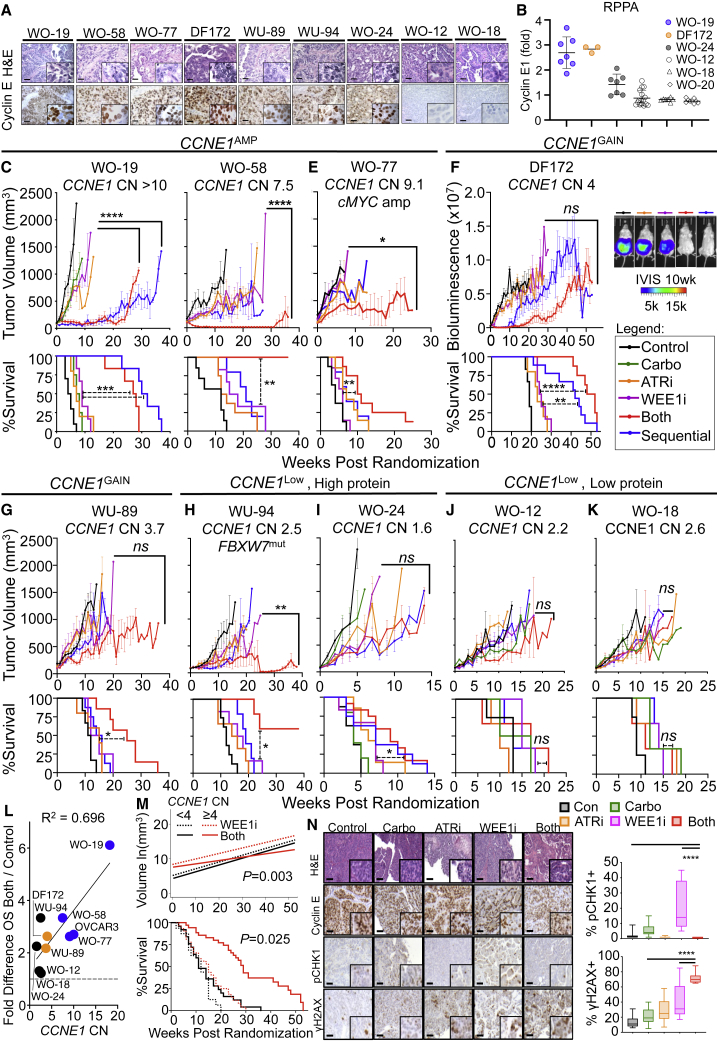
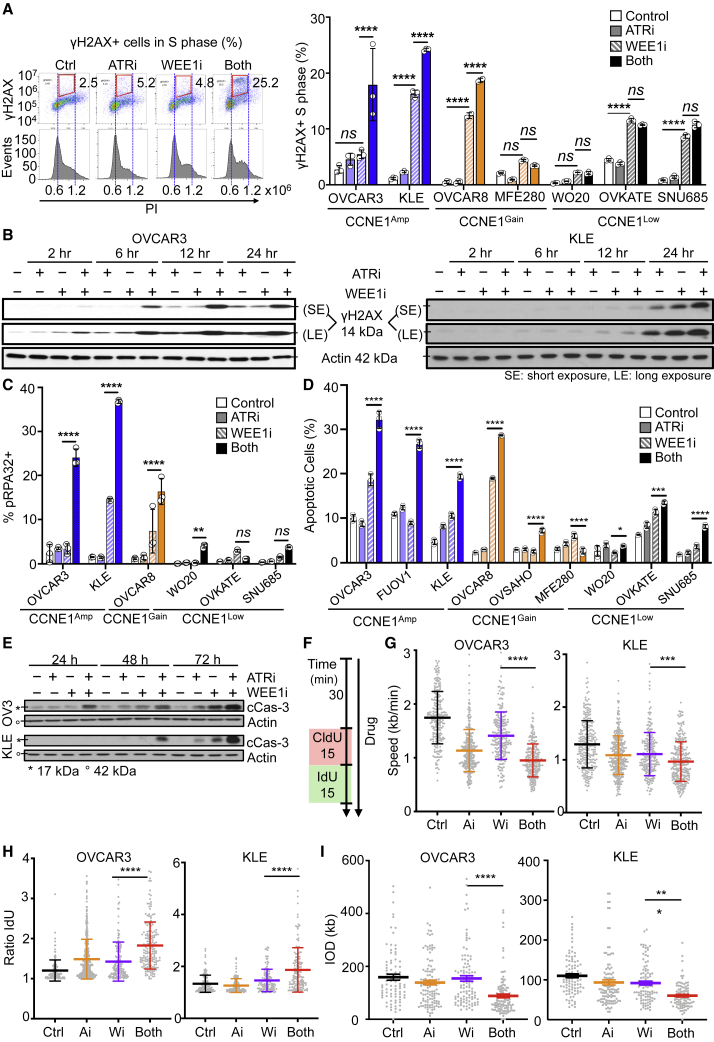
CCNE1-amplified ovarian cancers (OVCAs) and endometrial cancers (EMCAs) are associated with platinum resistance and poor survival, representing a clinically unmet need. We hypothesized that dysregulated cell-cycle progression promoted by CCNE1 overexpression would lead to increased sensitivity to low-dose WEE1 inhibition and ataxia telangiectasia and Rad3-related (ATR) inhibition (WEE1i-ATRi), thereby optimizing efficacy and tolerability. The addition of ATRi to WEE1i is required to block feedback activation of ATR signaling mediated by WEE1i. Low-dose WEE1i-ATRi synergistically decreases viability and colony formation and increases replication fork collapse and double-strand breaks (DSBs) in a CCNE1 copy number (CN)-dependent manner. Only upon CCNE1 induction does WEE1i perturb DNA synthesis at S-phase entry, and addition of ATRi increases DSBs during DNA synthesis. Inherent resistance to WEE1i is overcome with WEE1i-ATRi, with notable durable tumor regressions and improved survival in patient-derived xenograft (PDX) models in a CCNE1-level-dependent manner. These studies demonstrate that CCNE1 CN is a clinically tractable biomarker predicting responsiveness to low-dose WEE1i-ATRi for aggressive subsets of OVCAs/EMCAs.

Keywords: ATR; CCNE1 copy number; WEE1; biomarker; ovarian and endometrial cancer.


Conflict of interest statement

F.S. serves on a scientific advisory board and has received funding for clinical trials from AstraZeneca. G.B.M. receives support or acts as a consultant for AstraZeneca, ImmunoMET, Ionis, Nanostring, PDX Pharmaceuticals, Signalchem Lifesciences, Symphogen, Abbvie, Amphista, Ellipses Pharma, Eli Lilly, Medacorp, Turbine, Zentalis Pharmaceuticals, and Tarveda and has transferred technology to Myriad and Nanostring. E.J.B. serves on the scientific advisory board of Atrin Pharmaceuticals and has been an advisor for Sierra Oncology. R.D. serves on the scientific advisory board of Repare Therapeutics and Siamab Therapeutics and advises Mersana Therapeutics and nVision Medical.

Figures

None
Graphical abstract
Figure 1
Figure 1
Cyclin E induction increases ATR signaling and sensitivity to combination WEE1i-ATRi (A) Select proteins involved in G1-S and G2-M cell-cycle regulation by RPPA analysis from FT282 cells after cyclin E1 induction (FT282 CCNE1induc) by doxycycline treatment (500 nM) for indicated times. Data are presented as the log2 fold change relative to 0 h (n = 2; mean). (B and C) Immunoblot of the indicated proteins after FT282 CCNE1induc cells were treated with doxycycline at the indicated time points. (D) Viability of FT282 CCNE1induc cells pretreated ± doxycycline (24 h) followed by 120 h of WEE1i (black) or ATRi (gray) monotherapy at the indicated dosages. The inlay is the immunoblot for cyclin E1 after 120 h ± doxycycline (n = 6; mean ± SD; ± doxycycline: WEE1i, p < 0.0001, ATRi, p = 0.0002; doses highlighted red). (E) Immunoblot of the indicated proteins in FT282 CCNE1induc cells ± doxycycline and then 24 h of the indicated drug. (F) Cell viability for FT282 CCNE1induc cells ± doxycycline and then 120 h of the indicated monotherapy and combination (n = 6; mean ± SD; ± doxycycline: p < 0.0001). Coefficient of drug interaction (CDI) relative to fraction affected (Fa) comparing ± doxycycline (blue versus gray), with selected doses highlighted in red (right) (CDI = 0.8, 1.0). (G and H) Immunoblot for cyclin E1 in OVKATE (G) and SNU685 (H) CCNE1induc cells ± doxycycline at the indicated time points (left) for up to 5 days (right). (I and J) Cell viability analysis of OVKATE (I) and SNU685 (J) CCNE1induc cells ± doxycycline at the indicated doses (n = 3–4; mean ± SD; ± doxycycline: p < 0.0001 for select combination doses shown in red). CDI relative to Fa comparing ± doxycycline (blue versus gray), with selected doses highlighted in red (right) (OVKATE: CDI = 0.8, 1.1; SNU685: CDI = 0.4, 0.7). (K and L) Quantification of colony formation for OVKATE (K) and SNU685 (L) CCNE1induc cells ± doxycycline followed by the indicated treatment for 10 days. Doses for representative images are shown in red (± doxycycline: p < 0.0001; n = 3; representative image shown). CDI relative to the Fa plot comparing ± doxycycline (blue versus gray), with selected doses highlighted in red (right) (OVKATE: CDI = 0.05, 0.5; SNU685: CDI = 0.2, 0.6). Significance determined by two-way ANOVA followed by Tukey’s multiple comparison test in (D), (F), and (I)–(L). Representative data are shown (B–L) for one of 3 biologically independent experiments. ∗∗∗p < 0.001, ∗∗∗∗p < 0.0001.
Figure 2
Figure 2
Combination WEE1i-ATRi decreases viability and colony formation in CCNE1Amp compared with CCNE1Low cells (A) Copy number analysis in CCNE1Amp (blue), CCNE1Gain (orange), and CCNE1Low (black) cells based on the Cancer Cell Line Encyclopedia (CCLE) data (https://sites.broadinstitute.org/ccle). (B) Immunoblot of the indicated proteins, including full-length and low molecular weight (LMW) cyclin E1, in cell lines normalized by cell number. Histone H3 was nuclear loading control. (C) Immunoblot for indicated proteins in CCNE1Amp OVCAR3 and KLE cells after treatment (200 nM WEE1i, 1 μM ATRi, or both) at the indicated times. (D) Cell viability of the indicated cell lines after 5 days of treatment at the indicated doses (left). Selected dose is defined as the "standard low dose" for comparison, highlighted in red (n = 3–5; mean ± SD). CDI relative to the Fa plot comparing CCNE1Amp (blue), CCNE1Gain (orange), and CCNE1Low (black) cell lines (right upper). The standard low dose is the bold dot, the higher doses are open dots, and lower doses are faded dots. Synergy is represented by log2(CDI) plotted against CCNE1 CN, displayed as log2(CN/2) for standard low doses (right lower). The trend line with correlation coefficient R2 is shown. (E) Colony formation (CF) after all lines were treated with 0.25 μM ATRi, 0.05 μM WEE1i, or both for 10 days (n = 3; representative image shown). CF quantified with ImageJ (Figure S1) and mean CF were used to calculate CDI. CDI relative to the Fa plot as in (D) (middle). Log2(CDI) versus CCNE1 CN as in (D) (right). (F) Knockdown efficiency of WEE1 siRNA (2 nM) and ATR siRNA (10 nM) in OVCAR3 cells measured by immunoblot 48 h post-transfection (top). Viability for combination WEE1 and ATR siRNA treatment in CCNE1Amp OVCAR3 cells and CCNE1Low WO-20 cells at 48 h (n = 5; mean ± SD; CDI = 0.9). Significance determined by one-way ANOVA followed by Tukey’s multiple comparison test for (D) and (F). Representative data are shown for one of 3 biologically independent experiments. ∗∗∗∗p < 0.0001; ns, not significant.
Figure 3
Figure 3
CCNE1 expression is a biomarker predictive of response to combination WEE1i-ATRi in PDX models (A) Representative H&E and cyclin E1 protein by IHC in PDX models (scale bar, 50 μm; 40× magnification, 100× inlay). (B) Quantification of cyclin E1 protein by RPPA analysis (n = 4–9; mean ± SD). WO-20 has a CCNE1 CN of 2 and low cyclin E1 protein serving as control. (C–K) Tumor volume growth curve (upper) and survival by Kaplan-Meier analysis (lower) for CCNE1Amp OVCA PDXs: (C) WO-19, (D) WO-58, and (E) WO-77; CCNE1Gain PDXs: (F) DF-172 OVCA ascites PDX (inlay is IVIS [in vivo imaging system] imaging of treatment groups at 10 weeks) and (G) WU-89 EMCA; CCNE1Low with high cyclin E1 protein PDXs: (H) WU-94 FBXW7MUT EMCA and (I) WO-24 OVCA; and CCNE1Low with low cyclin E protein OVCA PDXs: (J) WO-12 and (K) WO-18 (Table S1). Mice were randomized to treatment groups: (1) control (n = 6–10), (2) carboplatin at 30 mg/kg intraperitoneally (i.p.) weekly (n = 4–5), (3) ATRi at 40 mg/kg/day oral gavage (OG) 5 days weekly (n = 5–8), (4) WEE1i at 60 mg/kg/day OG 5 days weekly (n = 4–6), (5) WEE1i + ATRi 5 days weekly (n = 5–12), and (6) sequential WEE1i at 90 mg/kg/day 7 days weekly during week 1 + ATRi at 50 mg/kg/day 7 days weekly during week 2, and repeat (n = 5–9). For WO-12 and WO-18, n = 3–4 mice per group. For WU-94, WEE1i and ATRi were dosed at 30 mg/kg/day. Treatment continued until progression (tumor volume > 1,000 mm3 or ascites score of 5). Both significantly resulted in tumor regression compared with WEE1i alone in WO-19 (p < 0.0001 for both and sequential), WO-58 (p < 0.0001), WO-77 (p = 0.03), and WO-94 (p = 0.001). Overall survival (OS) was improved in both versus WEE1i in WO-19 (p = 0.0005), WO-58 (p = 0.005), WO-77 (p = 0.001), DF-172 (p < 0.0001), WO-24 (p = 0.04), WU-89 (p = 0.03), and WU-94 (p = 0.01). For exact p values for all comparisons, see Table S2. (L) Median overall survival for combination relative to control plotted against CCNE1 CN for each PDX model and trend line with correlation coefficient R2 shown. (M) Higher CCNE1 CN dichotomized at the median value (≥4) is predictive of response (growth rates, log scale; top) and improved OS (bottom) with WEE1i-ATRi combination compared with WEE1i alone in PDX models. Test for interaction: p = 0.003 for differential growth rates using a nested model and p = 0.025 for differential OS. WU-94 was excluded from the analysis because of the FBXW7 mutation. (N) Representative H&E staining and IHC detection of the indicated proteins (H&E 10× and IHC 20×, with 40× insets) in WO-19 PDX tumors in treatment groups collected at 2–3 weeks on treatment (left) and quantification (right). For boxplots, bound boxes show interquartile range, whiskers show maximum and minimum, and center lines indicate median (n = 3 mice except combination for 2 mice; 9 high power field [HPF] per tumor; scale bar, 50 μm). Tumor growth shown is mean ± SEM. Longitudinal tumor growth was analyzed by linear mixed effects modeling with type II ANOVA and pairwise comparisons across groups. Data were analyzed for overall survival using the Mantel-Cox log-rank test. Data analysis for IHC was determined by one-way ANOVA followed by Tukey’s multiple comparison test. ∗p < 0.05, ∗∗p < 0.01, ∗∗∗p < 0.001, ∗∗∗∗p < 0.0001; ns, not significant.
Figure 4
Figure 4
WEE1i-ATRi combination increases M-phase entry, replication fork instability, and apoptosis in CCNE1Amp cancer cells (A) Detection of γH2AX-positive cells in S phase of WEE1i-ATRi-treated CCNE1Amp, CCNE1Gain, and CCNE1Low cells. Cells were treated with DMSO (control) or 200 nM WEE1i, 1 μM ATRi, or both for 8 h and then fixed and stained with γH2AX and PI for flow cytometry. γH2AX-positive cells in S phase were quantified. Representative images of OVCAR3 (left) and quantified data (right) are shown (both versus WEE1i monotherapy: OVCAR3, p < 0.0001; KLE, p < 0.0001; OVCAR8, p < 0.0001; MFE280, p = 0.8151; WO-20, p = 0.9997; OVKATE, p = 0.8630; SNU685, p = 0.2171; n = 3; mean ± SD). (B) Representative immunoblots for γH2AX in OVCAR3 (left) and KLE (right) cells after they were treated as in (A) for the indicated time. Actin is loading control. (C) Quantification of pRPA32(S33) by flow cytometry of the indicated cells after treatment similar to (A) after 24 h (n = 3; mean ± SD; WEE1i versus both shown by an asterisk). (D) Flow cytometry quantification of apoptotic cells by Annexin V-APC (allophycocyanin) and propidium iodide (PI) staining of the indicated cells after treatment similar to (A) for 48 h (n = 3; mean ± SD; WEE1i versus both: MFE280, p = 0.0022; OVKATE, p = 0.0084; OVCAR3, p = 0.0005; OVSAHO, p = 0.0001; WO-20, p = 0.0002; SNU685, p < 0.0001). (E) Representative immunoblots for cleaved caspase-3 in OVCAR3 (upper) and KLE (lower) treated for the indicated time as in (A). (F) Experimental design for replication fork analysis. OVCAR3 and KLE cells were pretreated with a drug as in (A) for 30 min and pulse labeled with 5-chloro-2′-deoxyuridine (CIdU) (red) followed by 5-iodo-2′-deoxyuridine (IdU) (green) for 15 min each in the continuous presence of inhibitors. (G) Quantification of replication fork speed (length of track/duration of both pulses). At least 200 intact, unidirectional tracks were counted for each condition (mean ± SEM; WEE1i versus both shown by an asterisk). (H) Quantification of fork asymmetry as calculated by long green length/short green length replication initiation tracks. At least 130 intact initiation tracks were counted for each condition (mean ± SEM; WEE1i versus both shown by an asterisk). (I) Quantification of inter-origin distance (IOD) for firing calculated by the distance between two nearby origins on the same fiber. At least 100 intact tracks were counted per condition (mean ± SEM; WEE1i versus both shown by an asterisk). Individual samples are presented as data points, and data were analyzed using one-way ANOVA followed by Tukey’s multiple comparison test. Representative data are shown (A–E) for one of 3 biologically independent experiments. ∗p < 0.05, ∗∗p < 0.01, ∗∗∗p < 0.001, ∗∗∗∗p < 0.0001; ns, not significant.
Figure 5
Figure 5
Differential effects of WEE1i and ATRi upon CCNE1 induction results in fork collapse in early S phase (A) Representation of cell-cycle distribution for FT282 CCNE1induc cells ± doxycycline. Cells were synchronized by 24 h FBS deprivation (0.1%), released with 10% FBS, and collected at the indicated time points (± doxycycline). Cell-cycle distribution was measured with EdU and 7-AAD. Representative images (left) and quantification (right) are shown (n = 3; mean ± SD; p < 0.0001 for S phase ± doxycycline at 12 and 16 h, shown by an asterisk). (B) Detection of the indicated proteins after FT282 cells were arrested, released as in (A), and treated with DMSO (control) or 1 μM ATRi, 200 nM WEE1i, or both for 8 h (± doxycycline). (C and D) Cell-cycle distribution after drug treatment as in (B). Representative images (C, left), quantification of early, mid-, and late S phase (C, right) are shown (n = 3; mean ± SD; control versus WEE1i, statistics shown for early S phase, ∗∗∗∗p < 0.0001). Nucleotide incorporation by mean EdU intensity (S/G0-G1) (D) is shown (control versus WEE1i, p < 0.0001). (E) Detection of S-phase entry and nucleotide incorporation by PCNA and EdU immunofluorescences after cells were treated as in (B) and fixed at 8 h. Percentages of PCNA+, PCNA+EdU+, and PCNA+EdU− cells were quantified by ImageJ. Representative images of cells with CCNE1 induction (bottom) are shown (scale bar, 20 μM; n = 3; mean ± SD; control versus WEE1i, p = 0.012). (F) Measurement of γH2AX and EdU after treatment as in (B). Representative images (top) and quantification of γH2AX+EdU−, γH2AX+EdU+, and γH2AX+EdU+/EdU+ (bottom) ± doxycycline are presented in CCNE1induc cells. With CCNE1induc, addition of ATRi to WEE1i affected γH2AX+EdU− (WEE1i versus both, p < 0.0001; γH2AX+EdU−, p < 0.0001; γH2AX+EdU+/EdU+, p < 0.0001) at 16 h. Data were analyzed using one-way ANOVA followed by Tukey’s multiple comparison test (C–F). Representative data are shown for one of 3 biologically independent experiments. ∗p < 0.05, ∗∗p < 0.01, ∗∗∗p < 0.001, ∗∗∗∗p < 0.0001; ns, not significant.
Figure 6
Figure 6
Combination WEE1i-ATRi leads to replication stress, double-strand DNA breaks, and apoptosis with CCNE1 induction in OVCA and EMCA cell lines (A and B) OVKATE (A) and SNU685 (B) CCNE1induc cells were pretreated 24 h ± doxycycline; treated with DMSO (control) or 200 nM WEE1i, 1 μM ATRi, or both for 8 h; and evaluated for γH2AX and PI by flow cytometry. γH2AX in OVKATE and SNU685 with CCNE1induc (both versus WEE1i, p < 0.0001; n = 3; mean ± SD). (C and D) OVKATE (C) and SNU685 (D) CCNE1induc cells were treated as in (A) for 24 h and evaluated for pRPA32 and cleaved caspase-3 by flow cytometry. pRPA32-positive and cleaved caspase-3-positive cells in OVKATE and SNU685 cells with CCNE1induc compared with non-induced (both versus WEE1i, p < 0.0001; n = 3; mean ± SD). (E and F) OVKATE (E) and SNU685 (F) CCNE1induc cells were treated drug as in (A) for 48 h and evaluated for Annexin V staining by flow cytometry. Annexin V-positive populations in OVKATE and SNU685 cells with CCNE1induc compared with non-induced (both versus WEE1i, p < 0.0001; n = 3; mean ± SD). Data were analyzed using one-way ANOVA followed by Tukey’s multiple comparison test (C–F). Representative data are shown for one of 3 biologically independent experiments. ∗∗∗∗p < 0.0001; ns, not significant.
Figure 7
Figure 7
Distinct mechanism of actions for WEE1i and ATRi with CCNE1 overexpression (A) Normal cell showing the G1-S and G2 -M cell-cycle progression. (B) When cyclin E1 is overexpressed, there is premature S-phase entry, increased replication initiation, and perturbed replication fork progression, leading to a prolonged S phase. (C) Treatment with a WEE1i in cyclin E1-overexpressing cells leads to an increase in early S phase and defective nucleotide incorporation. This leads to activation of the ATR/CHK1 pathway to protect replication forks and stop progression through G2-M to allow DNA repair. (D) Addition of ATRi to WEE1i leads to increased DNA double-strand breaks and replication fork collapse. Because ATR also plays a role in G2-M cell-cycle checkpoint control, damaged DNA can now progress through G2-M unchecked, leading to mitotic catastrophe and cell death.

Comment in

References

    1. Siegel R.L., Miller K.D., Jemal A. Cancer statistics, 2018. CA Cancer J. Clin. 2018;68:7–30. - PubMed
    1. Birrer, M.J., and Ceppi, L., eds. (2017). Translational Advances in Gynecologic Cancers (Academic Press).
    1. Armstrong D.K., Bundy B., Wenzel L., Huang H.Q., Baergen R., Lele S., Copeland L.J., Walker J.L., Burger R.A., Gynecologic Oncology Group Intraperitoneal cisplatin and paclitaxel in ovarian cancer. N. Engl. J. Med. 2006;354:34–43. - PubMed
    1. Winter W.E., 3rd, Maxwell G.L., Tian C., Carlson J.W., Ozols R.F., Rose P.G., Markman M., Armstrong D.K., Muggia F., McGuire W.P., Gynecologic Oncology Group Study Prognostic factors for stage III epithelial ovarian cancer: a Gynecologic Oncology Group Study. J. Clin. Oncol. 2007;25:3621–3627. - PubMed
    1. Patch A.M., Christie E.L., Etemadmoghadam D., Garsed D.W., George J., Fereday S., Nones K., Cowin P., Alsop K., Bailey P.J., Australian Ovarian Cancer Study Group Whole-genome characterization of chemoresistant ovarian cancer. Nature. 2015;521:489–494. - PubMed

Publication types

MeSH terms