. 2021 Sep 14;2(9):100398.
doi: 10.1016/j.xcrm.2021.100398. eCollection 2021 Sep 21.

Identification of Faecalibacterium prausnitzii strains for gut microbiome-based intervention in Alzheimer's-type dementia

Affiliations

Identification of Faecalibacterium prausnitzii strains for gut microbiome-based intervention in Alzheimer's-type dementia

Atsushi Ueda et al. Cell Rep Med. .

Abstract

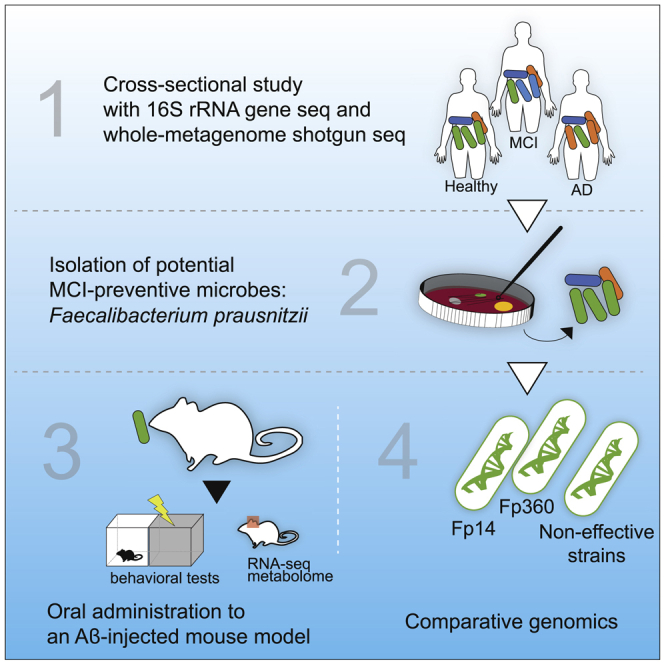
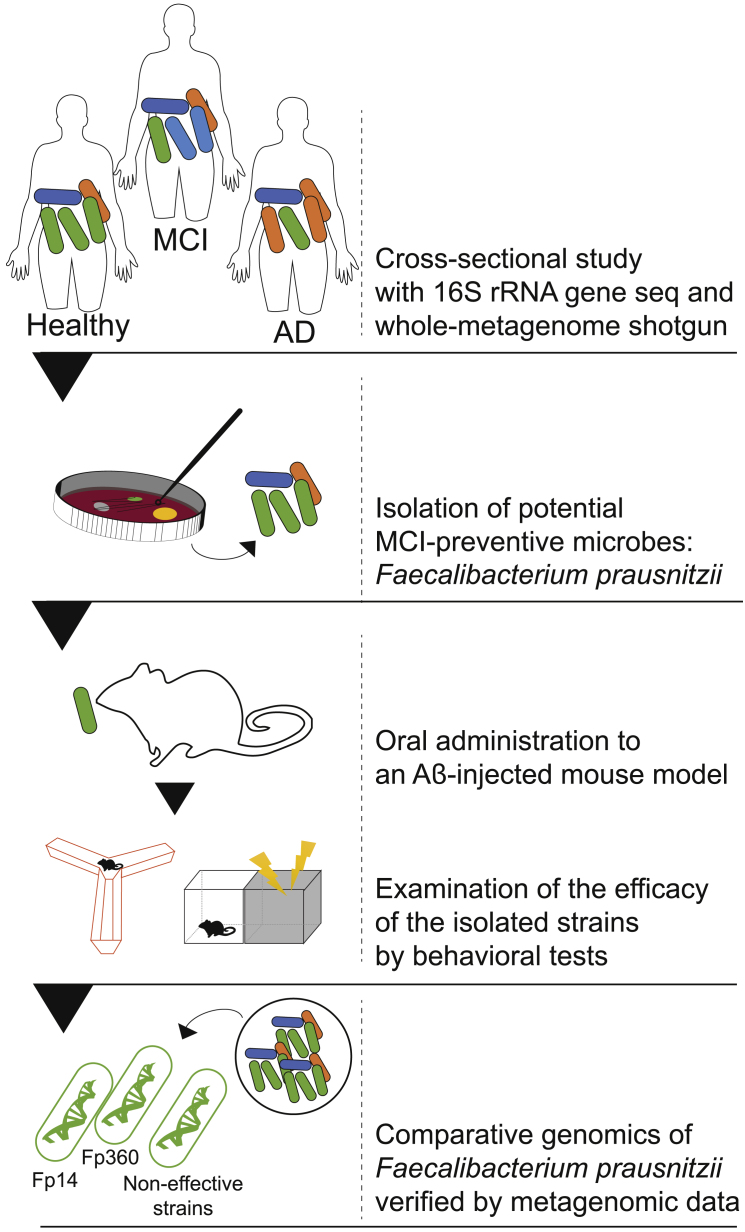
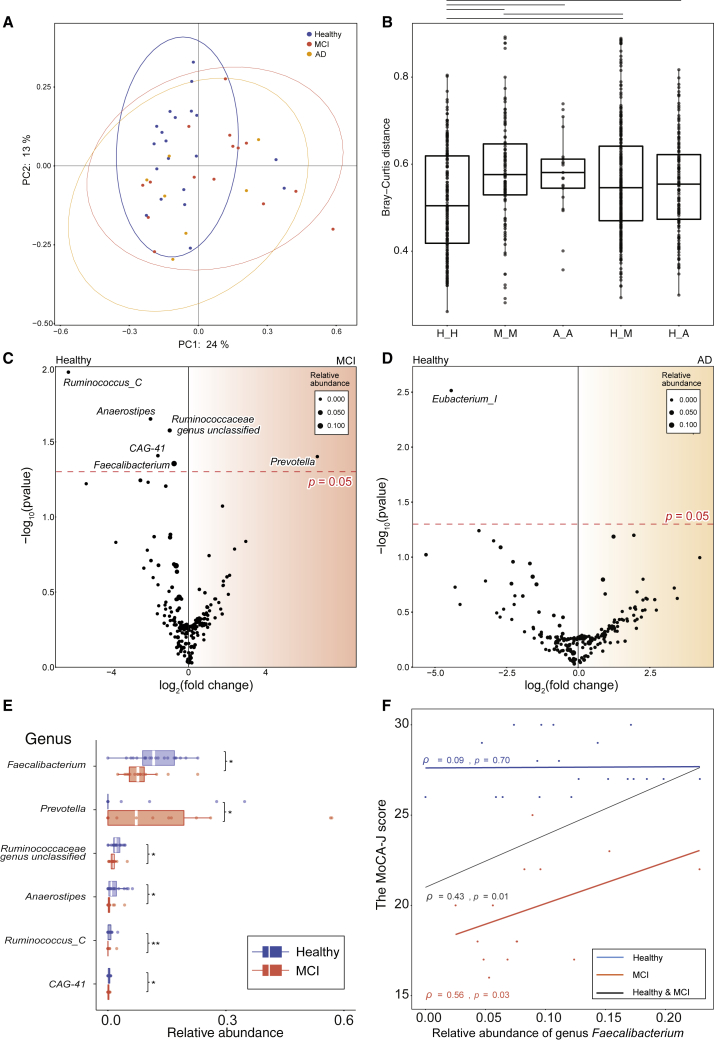
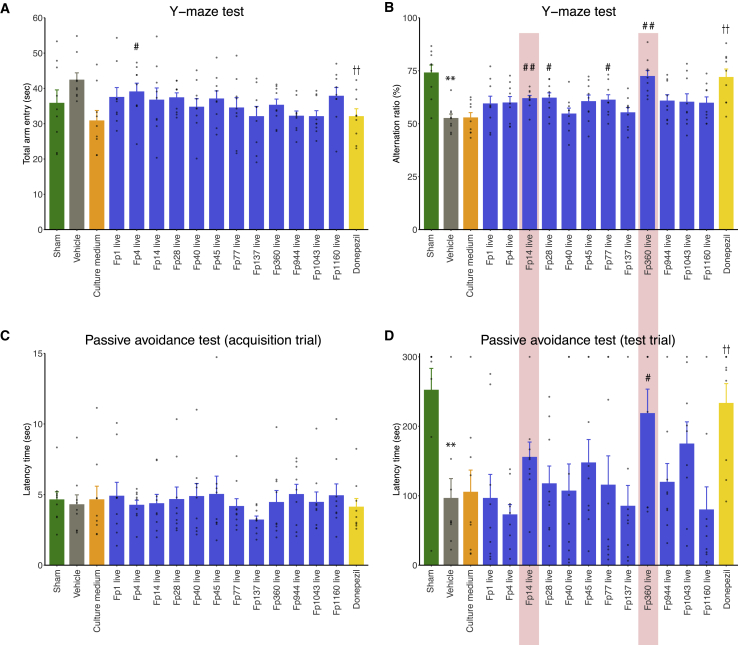
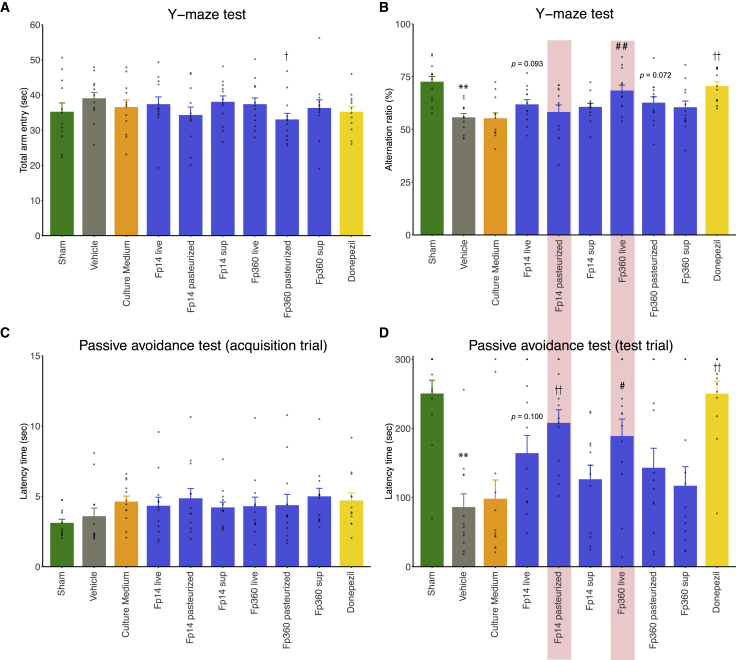
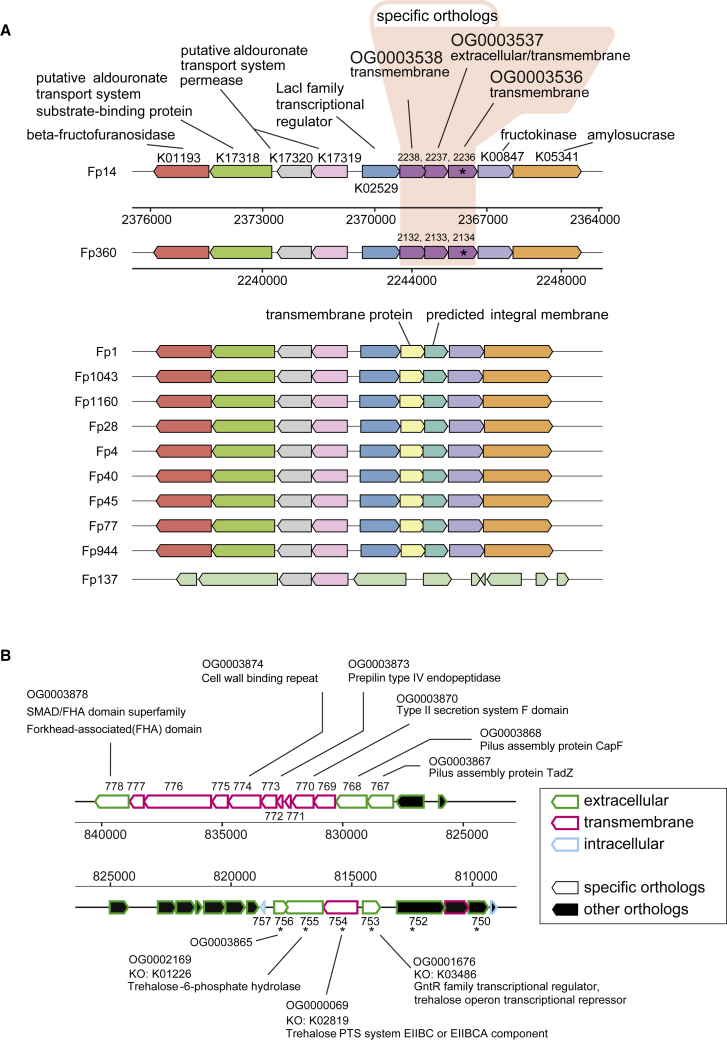
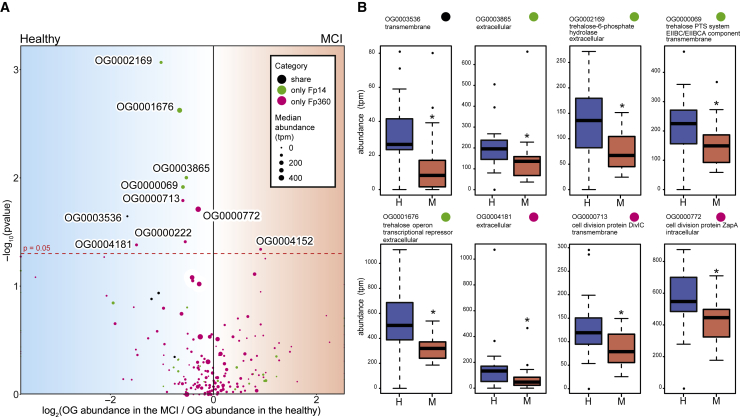
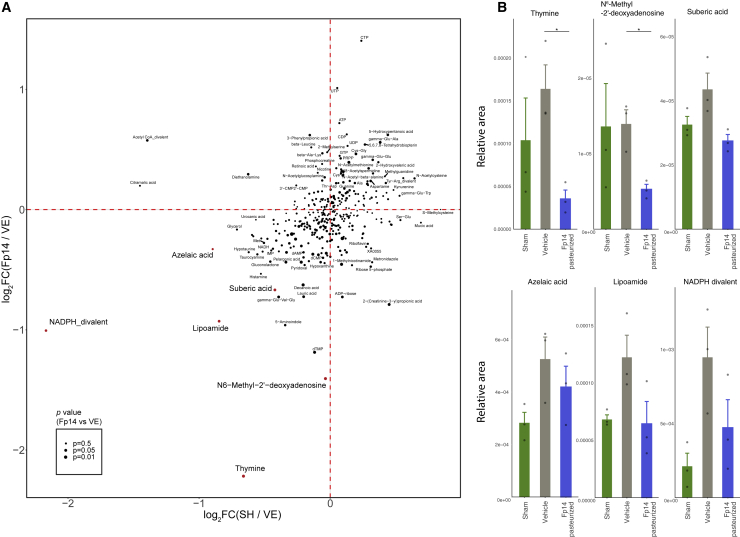
Evidence linking the gut-brain axis to Alzheimer's disease (AD) is accumulating, but the characteristics of causally important microbes are poorly understood. We perform a fecal microbiome analysis in healthy subjects and those with mild cognitive impairment (MCI) and AD. We find that Faecalibacterium prausnitzii (F. prausnitzii) correlates with cognitive scores and decreases in the MCI group compared with the healthy group. Two isolated strains from the healthy group, live Fp360 and pasteurized Fp14, improve cognitive impairment in an AD mouse model. Whole-genome comparison of isolated strains reveals specific orthologs that are found only in the effective strains and are more abundant in the healthy group compared with the MCI group. Metabolome and RNA sequencing analyses of mouse brains provides mechanistic insights into the relationship between the efficacy of pasteurized Fp14, oxidative stress, and mitochondrial function. We conclude that F. prausnitzii strains with these specific orthologs are candidates for gut microbiome-based intervention in Alzheimer's-type dementia.

Keywords: Alzheimer’s disease; Faecalibacterium prausnitzii; MCI; applied microbiology; comparative genomics; gut microbiome; gut microbiome-based intervention; metagenome; microbiota-gut-brain axis; mild cognitive impairment.


Conflict of interest statement

The Tokyo Institute of Technology and Otsuka Pharmaceutical Co., Ltd. are currently applying for a patent dealing with the use of F. prausnitzii and its components for prevention, diagnosis, and treatment of dementia. The inventors are A.K., S.S., T.Y., S.T., K.U., A.U., T. Kariya, T. Kawahara, Y.K., and N.K. T.Y. is a founder of Metabologenomics and Metagen Therapeutics. The companies focus on design and control of the gut environment for human health but had no control over the experiments, interpretations, writing, or publication of this work. The terms of these arrangements are being managed by the Tokyo Metropolitan Institute of Gerontology; Otsuka Pharmaceutical Co., Ltd.; and the Tokyo Institute of Technology in accordance with their conflict of interest policies.

Figures

None
Graphical abstract
Figure 1
Figure 1
Schematic of this study To find and isolate potential MCI-preventive microbes for gut microbiome-based intervention in MCI, a cross-sectional study was performed to compare gut microbial structures of healthy, MCI, and AD groups by fecal 16S rRNA gene sequencing. The comparative analysis of gut microbial composition led us to select and isolate F. prausnitzii as the most promising candidate for prevention of MCI. Part of the causal relationships between F. prausnitzii isolates and cognitive function was examined using an AD mouse model. The effective strains Fp14 and Fp360 were selected based on the animal study results, and whole-genome comparison of the effective strains with the non-effective strains identified specific orthologs that were found only in the effective strains. Metagenomics data from the same cross-sectional study verified that some of these specific orthologs were more abundant in the healthy group than in the MCI group, which implied a relationship of specific orthologs with MCI and, in part, the mechanism of the effect in different bacterial forms (pasteurized or live).
Figure 2
Figure 2
F. prausnitzii decreased in the MCI group compared with the healthy group and correlated with cognitive test scores (A) Scatterplot showing the result of principal coordinates analysis (PCoA) with Bray-Curtis distance. (B) Boxplot showing the interquartile range (IQR) of the within-group Bray-Curtis distance, confirming the PCoA trend. The black horizontal lines show p < 0.05, which was analyzed by Wilcoxon rank-sum test (H, Healthy; M, MCI; A, AD). (C and D) Volcano plot showing genera whose abundance was significantly different (C) between the healthy (n = 20) and the MCI group (n = 15) or (D) between the healthy and the AD group (n = 7) by differential abundance analysis (ALDEx2). The x axis shows the log2 fold change of (C) the MCI or (D) the AD group over the healthy group. The y axis shows the –log10 of the p value, analyzed by Wilcoxon rank-sum test. The red horizontal line indicates p = 0.05. The size of the circle shows the median abundance of each genus. The abundance of species F. prausnitzii and genus Faecalibacterium are the same because F. prausnitzii is the sole species belonging to the genus Faecalibacterium. (E) Boxplot showing the IQR of the relative abundance of the genera between the healthy and MCI group. Six genera whose abundance was significantly different between the healthy and the MCI group are shown (Wilcoxon rank-sum test, ∗∗p < 0.01, ∗p < 0.05). (F) Scatterplot showing Spearman’s ρ and p value between the relative abundance of F. prausnitzii and the Montreal Cognitive Assessment Japanese version (MoCA-J) score of the healthy group (blue), the MCI group (red), and the healthy and the MCI groups (black). See also Figures S1–S3 and Tables S1, S3, and S4.
Figure 3
Figure 3
F. prausnitzii isolates improved Aβ-induced cognitive impairment 12 live isolates of F. prausnitzii were administered orally to mice that were injected i.c.v. with Aβ25-35. Cognitive performance was evaluated by Y-maze test and PA test. (A) Bar plot showing total entry time in the Y-maze test. (B) Bar plot showing the alternation ratio in the Y-maze test. (C) Bar plot showing the latency time of the acquisition trial in the PA test. (D) Bar plot showing the latency time of the test trial in the PA test. All values are expressed as the mean + SE (n = 9, biological replicates). ∗∗p < 0.01 by two-sided unpaired Student’s t test (sham operation versus vehicle); #p < 0.05, ##p < 0.01 by two-sided unpaired Student’s t test (versus culture medium); ††p < 0.01 by two-sided unpaired Student’s t test (versus vehicle).
Figure 4
Figure 4
The selected Fp14 and Fp360 improved Aβ-induced cognitive impairment in different bacterial forms (pasteurized or live) Live Fp14 or Fp360, pasteurized Fp14 or Fp360, and their corresponding culture supernatant were administered orally to mice that were injected i.c.v. with Aβ25-35. Cognitive performance was evaluated by Y-maze test and PA test. (A) Bar plot showing total entry time in the Y-maze test. (B) Bar plot showing the alternation ratio in the Y-maze test. (C) Bar plot showing the latency time of the acquisition trial in the PA test. (D) Bar plot showing the latency time of the test trial in the PA test. All values are expressed as the mean + SE (n = 12, biological replicates). ∗∗p < 0.01 by two-sided unpaired Student’s t test (sham operation versus vehicle); #p < 0.05, ##p < 0.01 by two-sided unpaired Student’s t test (versus culture medium); †p < 0.05, ††p < 0.01 by two-sided unpaired Student’s t test (versus vehicle). See also Figure S4.
Figure 5
Figure 5
Whole-genome comparison revealed specific orthologs in the effective F. prausnitzii strains Complete genomes of the 12 F. prausnitzii isolates were obtained using a PacBio sequencer. Specific orthologs were identified by using different ortholog finding tools: Roary and Orthofinder. Orthologs found only in specific strains or orthologs that contained KEGG orthologs (KOs) found only in specific strains were defined as “specific orthologs.” (A) 3 of the 4 specific orthologs shared only by Fp14 and Fp360 were adjacent to each other. Specific orthologs shared only by Fp14 and Fp360 were not present in the other 10 isolated strains. (B) 17 of 150 specific orthologs found solely in Fp14 were adjacent to each other. Intergroup differences in ortholog abundance between the healthy and the MCI group were analyzed by Wilcoxon rank-sum test (∗p < 0.05). Specific orthologs whose abundance was significantly higher in the healthy group than in the MCI group are indicated by asterisks. KOs and domain profiles were assigned to each ortholog using DIAMOND, InterProScan, and TMHMM. See also Figures S5 and S6 and Tables S2 and S5.
Figure 6
Figure 6
Metagenome shotgun sequencing verified abundant orthologs in the healthy group (A) Volcano plot showing the specific orthologs whose abundance was significantly different between the healthy and the MCI group (Wilcoxon rank-sum test). Orthologs found only in specific strains or orthologs that contained KOs found only in specific strains were defined as “specific orthologs.” The x axis shows the log2 of the median abundance in the MCI group over the median abundance in the healthy group. The y axis shows the –log10 of the p value analyzed by the Wilcoxon rank-sum test. The red horizontal line indicates p = 0.05. The size of the circles shows the median abundance of each ortholog. Colored circles show the category (black, shared only by Fp14 and Fp360; green, only Fp14; magenta, only Fp360). (B) Boxplots showing the IQR of the abundance of the specific orthologs. Eight specific orthologs whose abundance was significantly higher in the healthy group than in the MCI group are shown (Wilcoxon rank-sum test, ∗p < 0.05). Colored circles show the category (black, shared only by Fp14 and Fp360; green, only Fp14; magenta, only Fp360). These significant results were obtained when we used specific orthologs categorized by Orthofinder, and the same significant results were also observed when we used specific orthologs categorized by Roary (Table S6), except OG0000222. OG0000222 categorized by Orthofinder was significantly higher in the healthy group, but the ortholog that was categorized by Roary, which contained the same genes of Fp360 in OG0000222, was not significantly higher in the healthy group. See also Figure S5 and Tables S1, S3, S5, and S6.
Figure 7
Figure 7
Metabolome analysis explored the potential mechanism of action of pasteurized Fp14 in the brain (A) Scatterplot showing the result of the metabolome analysis. The x axis shows the log2 fold change of the sham operation group over the vehicle group. The y axis shows log2 fold change of the pasteurized Fp14-administered group over the vehicle group. The size of the circle shows the p value (two-sided unpaired Welch’s t test) between the pasteurized Fp14-administered group and the vehicle group. (B) Bar plot showing the relative areas of metabolites related to oxidative stress and mitochondrial function. All values are expressed as the mean + SE (n = 3, biological replicates). ∗p < 0.05 by two-sided unpaired Welch’s t test (versus vehicle). See also Table S7 and S8.

References

    1. World Health Organization . 2017. Global action plan on the public health response to dementia 2017–2025.https://www.who.int/mental_health/neurology/dementia/action_plan_2017_20...
    1. Crous-Bou M., Minguillón C., Gramunt N., Molinuevo J.L. Alzheimer’s disease prevention: from risk factors to early intervention. Alzheimers Res. Ther. 2017;9:71. - PMC - PubMed
    1. Jack C.R., Jr., Knopman D.S., Jagust W.J., Petersen R.C., Weiner M.W., Aisen P.S., Shaw L.M., Vemuri P., Wiste H.J., Weigand S.D. Tracking pathophysiological processes in Alzheimer’s disease: an updated hypothetical model of dynamic biomarkers. Lancet Neurol. 2013;12:207–216. - PMC - PubMed
    1. Haeberlein S.B., von Hehn C., Tian Y., Chalkias S., Muralidharan K.K., Chen T., Wu S., Li J., Skordos L., Nisenbaum L. 2020. EMERGE and ENGAGE Topline Results: Two Phase 3 Studies to Evaluate Aducanumab in Patients With Early Alzheimer’s Disease. In: AAN Science Highlights.https://investors.biogen.com/static-files/ccb1c817-6d20-4987-b9dc-bcfa96...
    1. Long J.M., Holtzman D.M. Alzheimer Disease: An Update on Pathobiology and Treatment Strategies. Cell. 2019;179:312–339. - PMC - PubMed

Publication types

MeSH terms

Substances