. 2021 Sep 23;2(9):100400.
doi: 10.1016/j.xcrm.2021.100400. eCollection 2021 Sep 21.

Predicting endometrial cancer subtypes and molecular features from histopathology images using multi-resolution deep learning models

Affiliations

Predicting endometrial cancer subtypes and molecular features from histopathology images using multi-resolution deep learning models

Runyu Hong et al. Cell Rep Med. .

Abstract

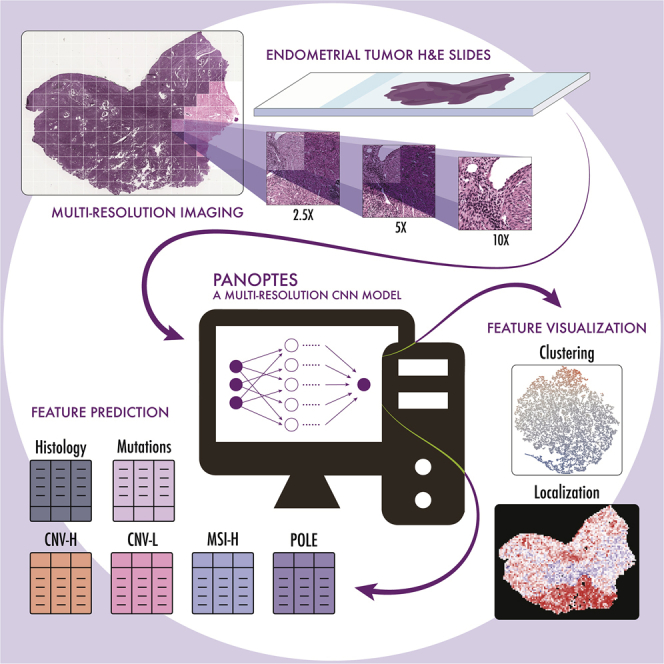
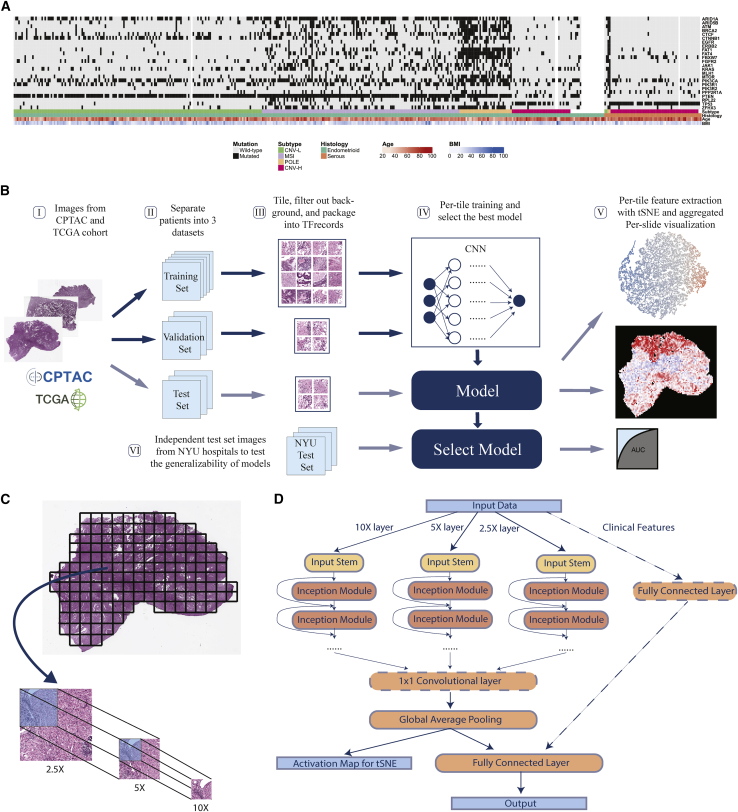
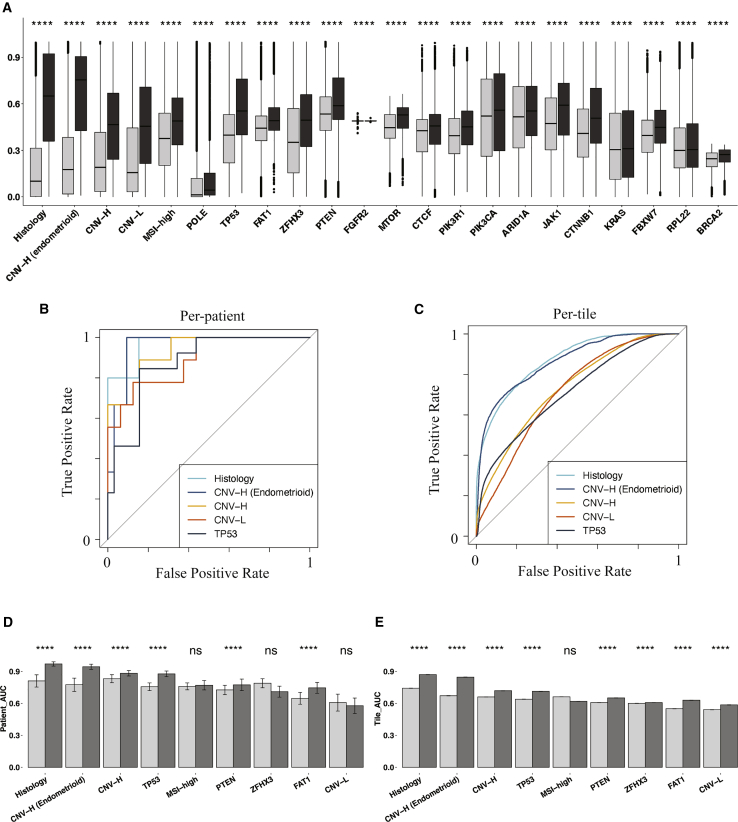
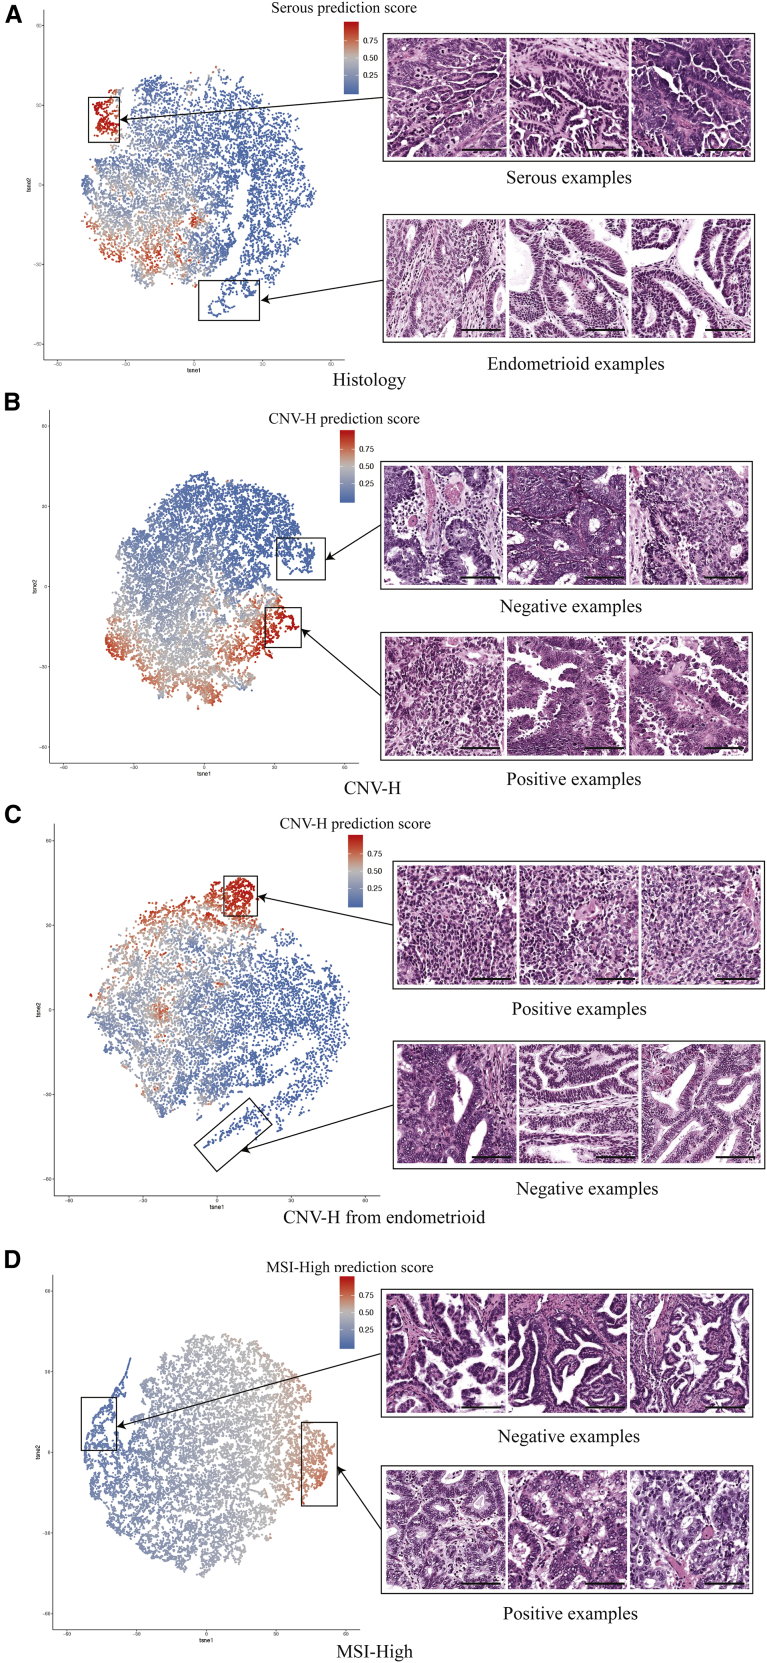
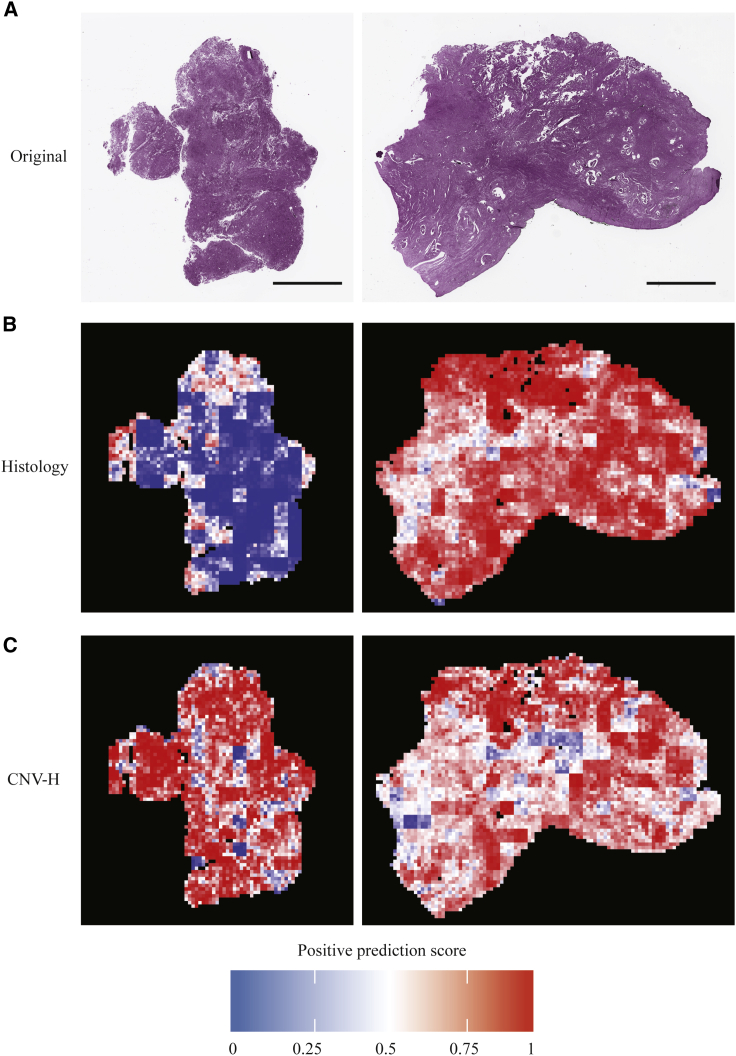
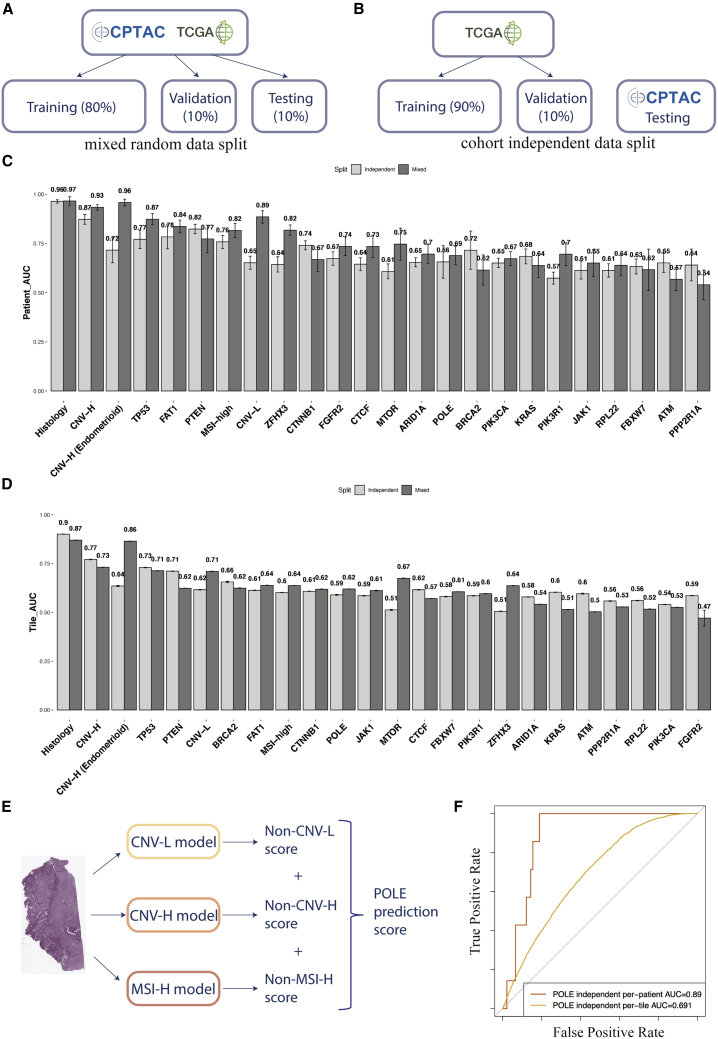
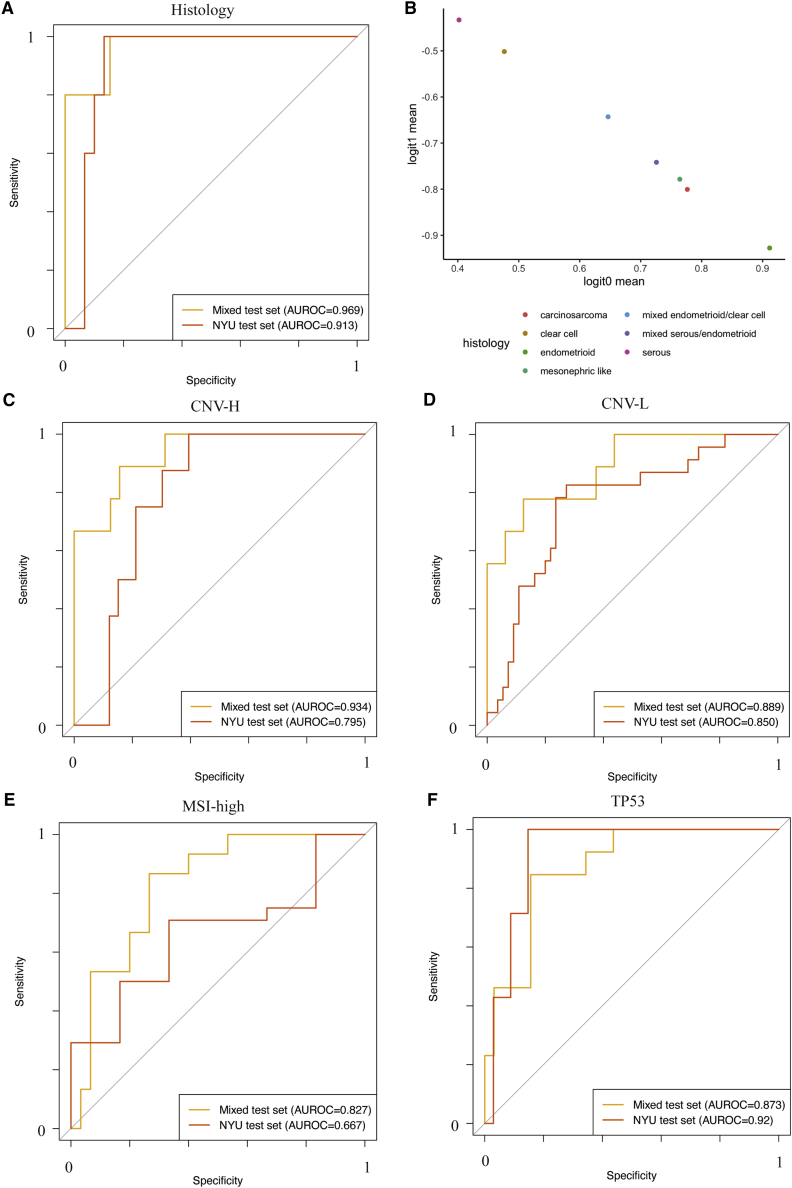
The determination of endometrial carcinoma histological subtypes, molecular subtypes, and mutation status is critical for the diagnostic process, and directly affects patients' prognosis and treatment. Sequencing, albeit slower and more expensive, can provide additional information on molecular subtypes and mutations that can be used to better select treatments. Here, we implement a customized multi-resolution deep convolutional neural network, Panoptes, that predicts not only the histological subtypes but also the molecular subtypes and 18 common gene mutations based on digitized H&E-stained pathological images. The model achieves high accuracy and generalizes well on independent datasets. Our results suggest that Panoptes, with further refinement, has the potential for clinical application to help pathologists determine molecular subtypes and mutations of endometrial carcinoma without sequencing.

Keywords: cancer genomics; cancer imaging; computational biology; computational pathology; deep learning; endometrial carcinoma.


Conflict of interest statement

The authors declare no competing interests.

Figures

None
Graphical abstract
Figure 1
Figure 1
Workflow and Panoptes architecture (A) A total of 456 patients in the cohorts from CPTAC and TCGA with feature annotations. (B) Overall workflow. I, H&E slide images of endometrial cancers were downloaded from databases; II, slides were separated at the per-patient level into a training, validation, and test set; III, slides were cut into 299 × 299-pixel tiles excluding background, and contaminants and qualified tiles were packaged into TFrecord files for each set; IV, training and validation sets were used to train the convolutional neural networks, and the testing set was used to evaluate trained models; V, activation maps of test set tiles were extracted and dimensionally reduced by tSNE to visualize features, while the per-tile predictions were aggregated back into intact slides; VI, an independent test set with samples from NYU hospitals was used to test the generalizability of selected best-performing models. (C) Slides were cut into paired tile sets at 2.5×, 5×, and 10× equivalent resolution of the same region to prepare for Panoptes. (D) Panoptes architecture with optional 1 × 1 convolutional layer and clinical features branch.
Figure 2
Figure 2
Prediction tasks were statistically successful, with promising results, and Panoptes outcompeted baselines in most of the top-performing prediction tasks (A) Predicted positive probability of tiles with 1-tail Wilcoxon test between true label-positive and -negative groups (black: true label-positive tiles; gray: true label-negative tiles) from models in Table 1. (B and C) ROC curves at per-patient (B) and per-tile (C) level associated with the top 5 prediction tasks in (A). (D and E) Bootstrapped per-patient (D) and per-tile (E) AUROC of InceptionResnetV2 (light) and Panoptes2 (dark) of top 9 tasks in (A) with 1-tail t test.
Figure 3
Figure 3
Extraction and visualization of features learned by the models with tSNE Each point represents a tile and is colored according to its corresponding positive prediction score. Scale bars represent 100 μm. (A) Histologically serous and endometrioid features from a Panoptes1 model. (B) CNV-H-positive and -negative features from a Panoptes4 model. (C) CNV-H-positive and -negative features in the histologically endometrioid samples from a Panoptes1 model. (D) MSI-high positive and negative features in the histologically endometrioid samples from a Panoptes3 with clinical features model.
Figure 4
Figure 4
Whole-slide predictions showing that some features of determining histological subtype and CNV-H are distinct (A) The first slide is from a CNV-H but histologically endometrioid case, while the second slide is from a CNV-H and serous tumor. Scale bars represent 5,000 μm. (B) Whole-slide histology prediction of examples in (A) from a Panoptes2 model, with hotter regions being predicted were more serous, while cooler regions were more endometrioid. (C) Whole-slide CNV-H prediction of examples in (A) from Panoptes1 (first example) and Panoptes4 (second example) models, with hotter regions being predicted were more CNV-H.
Figure 5
Figure 5
Comparisons of AUROC between the best models in mixed random split trials and cohort independent split trials and multi-model system for better POLE subtype classification (A) Mixed random data split demonstration. (B) Cohort independent data split demonstration. (C and D) Per-patient (C) and per-tile (D) level AUROC of the best-performing models in each task with mixed random data split (dark) and the cohort independent data split (light). Error bars indicate bootstrapped confidence interval. (E) Multi-model system to indirectly predict POLE molecular subtype. (F) ROC curves at per-patient and per-tile level of multi-model POLE classification system.
Figure 6
Figure 6
ROC curves and AUROC of the best-trained models of key tasks showed promising predictive power on the independent clinical dataset (A) Trained Panoptes2 histological subtype predictive model on the mixed TCGA and CPTAC held-out test set and the NYU test set. (B) Mean prediction logits by histology from histological subtype predictive model of NYU test set samples. (C) Trained Panoptes4 CNV-H subtype predictive model on the mixed TCGA and CPTAC held-out test set and the NYU test set. (D) Trained Panoptes1 CNV-L subtype predictive model on the mixed TCGA and CPTAC held-out test set and the NYU test set. (E) Trained InceptionResnetV1 MSI-high subtype predictive model on the mixed TCGA and CPTAC held-out test set and the NYU test set. (F) Trained Panoptes2 TP53 mutation predictive model on the mixed TCGA and CPTAC held-out test set and the NYU test set.

References

    1. Kandoth C., Schultz N., Cherniack A.D., Akbani R., Liu Y., Shen H., Robertson A.G., Pashtan I., Shen R., Benz C.C., Cancer Genome Atlas Research Network Integrated genomic characterization of endometrial carcinoma. Nature. 2013;497:67–73. - PMC - PubMed
    1. Dou Y., Kawaler E.A., Cui Zhou D., Gritsenko M.A., Huang C., Blumenberg L., Karpova A., Petyuk V.A., Savage S.R., Satpathy S., Clinical Proteomic Tumor Analysis Consortium Proteogenomic Characterization of Endometrial Carcinoma. Cell. 2020;180:729–748.e26. - PMC - PubMed
    1. Amant F., Moerman P., Neven P., Timmerman D., Van Limbergen E., Vergote I. Endometrial cancer. Lancet. 2005;366:491–505. - PubMed
    1. Morice P., Leary A., Creutzberg C., Abu-Rustum N., Darai E. Endometrial cancer. Lancet. 2016;387:1094–1108. - PubMed
    1. Burke W.M., Orr J., Leitao M., Salom E., Gehrig P., Olawaiye A.B., Brewer M., Boruta D., Villella J., Herzog T., Abu Shahin F., SGO Clinical Practice Endometrial Cancer Working Group. Society of Gynecologic Oncology Clinical Practice Committee Endometrial cancer: a review and current management strategies: part I. Gynecol. Oncol. 2014;134:385–392. - PubMed

Publication types

LinkOut - more resources