. 2021 Nov 19;10(11):2878-2885.
doi: 10.1021/acssynbio.1c00318. Epub 2021 Oct 8.

A Loser-Take-All DNA Circuit

Affiliations

A Loser-Take-All DNA Circuit

Kellen R Rodriguez et al. ACS Synth Biol. .

Abstract

DNA-based neural networks are a type of DNA circuit capable of molecular pattern recognition tasks. Winner-take-all DNA networks have been developed to scale up the complexity of molecular pattern recognition with a simple molecular implementation. This simplicity was achieved by replacing negative weights in individual neurons with lateral inhibition and competition across neurons, eliminating the need for dual-rail representation. Here we introduce a new type of DNA circuit that is called loser-take-all: an output signal is ON if and only if the corresponding input has the smallest analog value among all inputs. We develop a DNA strand-displacement implementation of loser-take-all circuits that is cascadable without dual-rail representation, maintaining the simplicity desired for scalability. We characterize the impact of effective signal concentrations and reaction rates on the circuit performance, and derive solutions for compensating undesired signal loss and rate differences. Using these approaches, we successfully demonstrate a three-input loser-take-all circuit with nine unique input combinations. Complementary to winner-take-all, loser-take-all DNA circuits could be used for recognition of molecular patterns based on their least similarities to a set of memories, allowing classification decisions for patterns that are extremely noisy. Moreover, the design principle of loser-take-all could be more generally applied in other DNA circuit implementations including k-winner-take-all.

Keywords: DNA neural network; DNA strand displacement; loser-take-all; molecular pattern recognition; signal reversal; winner-take-all.


Conflict of interest statement

The authors declare no competing financial interest.

Figures

Figure 1
Figure 1
Concept of a loser-take-all circuit. (a) Confusion matrix and example pattern classification results of winner-take-all (WTA) and loser-take-all (LTA) neural networks. Training and testing patterns were taken from the MNIST database and converted from grayscale to binary. Weights were assigned as the average of the first hundred patterns in the training data set. (b) Abstract design of a three-input loser-take-all circuit.
Figure 2
Figure 2
DNA strand-displacement implementation of a three-input loser-take-all circuit. In the chemical reactions, the species in black or gray are needed as part of the function or to facilitate the reactions, respectively. The concentrations of facilitating species are in excess. The concentration of a signal strand corresponds to the value of a variable (e.g., x1 = [X1]). Signal Yj is the union of all top strands in GYij. Signal Zi is the top strand in GZi. The initial concentration of GZi (e.g., [GZi]0 = 1× standard concentration) determines the steady-state concentration of Fluori when output Zi is computed to be ON. Zigzagged lines indicate toehold domains and straight lines indicate branch migration domains. Extended toehold domains on annihilators are indicated as s* T*. Clamp domains for reducing leak between double-stranded complexes are not shown here but included in Figure S1. Three distinct ATTO dyes were used in reporters for fluorescence readout.
Figure 3
Figure 3
Demonstration of signal reversal. (a) Individual input strands reacting with a pair of signal reversal gates. (b) Signal reversal of three inputs at distinct concentrations. Abstract reaction diagrams indicate the reactions involved in each experiment. Simulation and fluorescence kinetics data are shown as solid and dotted trajectories, respectively. Standard concentration 1× = 50 nM. Initial concentrations of all signal reversal gates and reporters were 2×.
Figure 4
Figure 4
Rate measurements in signal restoration (a) without and (b) with the presence of signal reversal gates and annihilators. Abstract reaction diagrams indicate the reactions involved in each experiment. Simulation and fluorescence kinetics data are shown as solid and dotted trajectories, respectively. Standard concentration 1× = 50 nM. Initial concentrations of all signal reversal gates, annihilators, signal restoration gates, fuels, and reporters were 2×, 4×, 1×, 2×, and 2×, respectively.
Figure 5
Figure 5
Adjustments in annihilator and input concentrations. Three-input loser-take-all behavior (a) without, and with adjustment in (b) annihilator and (c) input concentrations. Abstract reaction diagram indicates the reactions involved in the experiments, highlighting the molecules whose concentrations were adjusted. Simulation and fluorescence kinetics data are shown as solid and dotted trajectories, respectively. Except specified below, standard concentration 1× = 50 nM, initial concentrations of all signal reversal gates, annihilators, signal restoration gates, fuels, and reporters were 2 × , 4 × , 1 × , 2 × , and 2 × , respectively. Concentration of Anh13 was adjusted to 2× in b and c. Standard concentration for all input strands was adjusted to 1× = 100 nM in c.
Figure 6
Figure 6
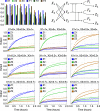
Demonstration of three-input loser-take-all with nine input combinations. Abstract reaction diagram indicates the reactions involved in the experiments. Bar chart shows all input values and expected reversed signal values. The first two kinetics plots in the top row are the same as in Figure 5c. Simulation and fluorescence kinetics data are shown as solid and dotted trajectories, respectively. Standard concentration for all input strands was 1× = 100 nM. Initial concentrations of annihilators Anh12, Anh13, and Anh23 were 4×, 2×, and 4×, respectively, and that of all signal reversal gates, signal restoration gates, fuels, and reporters were 2×, 1×, 2×, and 2×, respectively, where 1× = 50 nM.

References

    1. Benenson Y. Biomolecular computing systems: principles, progress and potential. Nat. Rev. Genet. 2012, 13, 455–468. 10.1038/nrg3197. - DOI - PubMed
    1. Zhang D. Y.; Seelig G. Dynamic DNA nanotechnology using strand-displacement reactions. Nat. Chem. 2011, 3, 103–113. 10.1038/nchem.957. - DOI - PubMed
    1. Scalise D.; Schulman R. Controlling matter at the molecular scale with DNA circuits. Annu. Rev. Biomed. Eng. 2019, 21, 469–493. 10.1146/annurev-bioeng-060418-052357. - DOI - PubMed
    1. Kim J.; Hopfield J. J.; Winfree E. Neural network computation by in vitro transcriptional circuits. Adv. Neural Inform. Proc. Syst. 2004, 17, 681–688.
    1. Genot A. J.; Fujii T.; Rondelez Y. Scaling down DNA circuits with competitive neural networks. J. R. Soc., Interface 2013, 10, 20130212.10.1098/rsif.2013.0212. - DOI - PMC - PubMed

Publication types