. 2021 Sep 1;131(17):e138230.
doi: 10.1172/JCI138230.

T cell protein tyrosine phosphatase protects intestinal barrier function by restricting epithelial tight junction remodeling

Affiliations

T cell protein tyrosine phosphatase protects intestinal barrier function by restricting epithelial tight junction remodeling

Ronald R Marchelletta et al. J Clin Invest. .

Abstract

Genome-wide association studies revealed that loss-of-function mutations in protein tyrosine phosphatase non-receptor type 2 (PTPN2) increase the risk of developing chronic immune diseases, such as inflammatory bowel disease (IBD) and celiac disease. These conditions are associated with increased intestinal permeability as an early etiological event. The aim of this study was to examine the consequences of deficient activity of the PTPN2 gene product, T cell protein tyrosine phosphatase (TCPTP), on intestinal barrier function and tight junction organization in vivo and in vitro. Here, we demonstrate that TCPTP protected against intestinal barrier dysfunction induced by the inflammatory cytokine IFN-γ by 2 mechanisms: it maintained localization of zonula occludens 1 and occludin at apical tight junctions and restricted both expression and insertion of the cation pore-forming transmembrane protein, claudin-2, at tight junctions through upregulation of the inhibitory cysteine protease, matriptase. We also confirmed that the loss-of-function PTPN2 rs1893217 SNP was associated with increased intestinal claudin-2 expression in patients with IBD. Moreover, elevated claudin-2 levels and paracellular electrolyte flux in TCPTP-deficient intestinal epithelial cells were normalized by recombinant matriptase. Our findings uncover distinct and critical roles for epithelial TCPTP in preserving intestinal barrier integrity, thereby proposing a mechanism by which PTPN2 mutations contribute to IBD.

Keywords: Gastroenterology; Inflammation; Inflammatory bowel disease; Phosphoprotein phosphatases; Tight junctions.


Conflict of interest statement

Conflict of interest: The authors have declared that no conflict of interest exists.

Figures

Figure 1
Figure 1. Tcptp-deficient mice display increased intestinal permeability in vivo.
(A) FITC-dextran 4 kDa (FD4) and (B) rhodamine 70 kDa (RD70) were administered by oral gavage to Tcptp WT, HET, and KO mice aged 18–21 days. Serum was collected after 5 hours and FD4 and RD70 concentration determined. (C) H&E staining of intestinal tissues from Tcptp WT, HET, and KO mice (18–21 days old) shows that an intact epithelium is retained in Tcptp-deficient mouse intestine. Blinded histological scoring (not shown) by a pathologist indicated no substantive difference in histology between genotypes (n = 4). Scale bars: 300 μm. (D) Crypt depth in large intestinal regions (cecum, proximal and distal colon) from Tcptp WT, HET, and KO mice was quantified and expressed in micrometers (n = 6–10). (E) Isolated colon length from Tcptp WT (n = 21), HET (n = 40), and KO (n = 26) mice was measured and expressed in centimeters. Data are expressed as mean ± SD. Statistical significance was calculated by 1-way ANOVA and Student-Newman-Keuls posttest. *P < 0.05; **P < 0.01; ***P < 0.001; ****P < 0.0001.
Figure 2
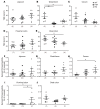
Figure 2. Tcptp-deficient mice display regional variations in macromolecule and electrolyte intestinal permeability ex vivo.
In Ussing chambers, mucosal transepithelial electrical resistance (TER) (AE) and ex vivo FD4 permeability (FJ) were measured across isolated (A and F) jejunum, (B and G) distal ileum, (C and H) cecum, (D and I) proximal colon, and (E and J) distal colon (n = 5–11). Data are expressed as mean ± SEM. Numbers of mice shown in parentheses. Comparisons between groups were by 1-way ANOVA and Student-Newman-Keuls posttest. *P < 0.05, and **P < 0.01 vs. WT; #P < 0.05 vs. HET.
Figure 3
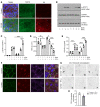
Figure 3. Loss of TCPTP promotes intestinal epithelial tight junction protein remodeling in vivo.
(A) Epithelial cells from ileum (I), cecum (C), proximal colon (PC), and distal colon (DC) were isolated from Tcptp WT, HET, and KO mice. Cells were lysed and probed by Western blotting for expression of tight junction proteins ZO-1 and occludin as well as TCPTP and β-actin. Insertion of cropped bands from ileal samples is denoted by black lines. (B) Densitometric analysis of ZO-1, (C) Occludin, and (D) TCPTP expression normalized to β-actin from Tcptp WT, HET, and KO mouse intestinal epithelium (n = 3–4). (E) Representative confocal micrographs of ZO-1 and occludin localization at tight junctions (arrows) in proximal colon from Tcptp WT and KO mice (n = 3). Asterisks show diffuse ZO-1 and occludin staining in Tcptp-KO mouse colon. (F) Myosin light chain (MLC) phosphorylation (Ser19) in proximal colon from WT, HET, and KO mice. (G) Western blot and (H) densitometric analysis of MLC phosphorylation in isolated IECs from Tcptp WT, HET, and KO mice normalized to total MLC (n = 3–4). Data expressed as mean ± SD. Statistical significance was calculated by 1-way ANOVA and Student-Newman-Keuls posttest. *P < 0.05; **P < 0.01; and ***P < 0.001.
Figure 4
Figure 4. In vivo and ex vivo intestinal permeability measurements in cytokine-treated Ptpn2ΔIEC KO mice.
(A) FD4 was administered by oral gavage to Ptpn2ΔIEC and Ptpn2fl/fl control mice. Serum was collected after 5 hours and FD4 concentration determined (n = 7–10). Mice were injected i.p. with IL-6, IFN-γ, TNF-α, or IFN-γ + TNF-α for 24 hours prior to tissue isolation and mounting in Ussing chambers. TER and FD4 permeability were measured in (B and E) cecum, (C and F) proximal colon, and (D and G) distal colon (n = 4). Data are expressed as mean ± SD. Comparisons between genotypes and within treatment groups were by unpaired 2-tailed Student’s t test. *P < 0.05; **P < 0.01; ***P < 0.001.
Figure 5
Figure 5. A TCPTP loss-of-function mutation increases cytokine-induced tight junction remodeling.
(A) Fluorescence micrographs of TCPTP (green) and HA (red) expression in doxycycline-treated (DOX-treated) (15 μg/mL; 48 hours) control and C216S-TC45–transfected HCA-7 IECs (merge image includes DAPI nuclear staining shown in blue). Scale bars: 10 μm. (B) Western blots showing STAT1 tyrosine phosphorylation (Y701) after basolateral addition of IFN-γ (200 U/mL, 6 hours) to DOX-pretreated control or C216S-TC45 HCA-7 IECs. Total STAT1 and β-actin levels shown for all conditions. (C) STAT1 phosphorylation relative to total STAT1 protein was determined by densitometry. (D) Control and C216S HCA-7 cells were cultured on Transwells prior to treatment with vehicle (PBS) or DOX (15 μg/mL; 48 hours) and subsequent treatment with IFN-γ (1000 U/mL, 24 hours). TER was measured and expressed as Ω/cm2. (E) FD4 permeability was calculated after 6 hours of IFN-γ treatment and expressed as mg/mL. (F) Representative image showing ZO-1 and occludin localization following IFN-γ treatment of DOX-pretreated control and C216S-TC45 IECs (merge image includes DAPI nuclear staining shown in blue). Scale bars: 10 μm. (G and H) Color conversion (in Adobe Photoshop) and quantification (ImageJ software, NIH) of ZO-1/Occludin colocalization (black arrows) in DOX-pretreated control (top row) and C216S-TC45 IECs (bottom row) exposed to IFN-γ (200 U/mL, 6 hours). Original magnification, 63×. Data shown as mean ± SD. Statistical significance was calculated by 1-way ANOVA and Student-Newman-Keuls posttest. Comparisons between 2 groups were by 2-tailed Student’s t test (n = 4). *P < 0.05; **P < 0.01; ***P < 0.001; ****P < 0.0001.
Figure 6
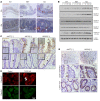
Figure 6. TCPTP deficiency increases intestinal expression of claudin-2 in vitro, in vivo, and in PTPN2-genotyped CD patients.
(A) Representative confocal micrograph showing claudin-2 expression in cecum from Tcptp WT, HET, and KO mice. Original magnification: ×10; ×40. (B) Expression of TCPTP; claudin-1, -2, -3, -4, and -15; and β-actin in isolated IECs from cecum of Tcptp WT and KO mice. The same β-actin blot was used in Figure 3G because blots were generated from the same mouse samples. (C) Immunohistochemistry of claudin-2 expression in colonic tissue from CD patients with WT TCPTP who tested negative for the rs1893217 loss-of-function PTPN2 mutation (AA/TT[–/–]; n = 5), 1 copy of the rs1893217 mutation (GA/CT[+/–]; n = 5), or 2 copies of the mutation (GG/CC[+/+]; n = 2). Arrows indicate membrane localization of claudin-2. Scale bars: 100 μm (original magnification, 20×), insert 50 μm. (D) Immunohistochemistry of Claudin-2 expression in ileum from CD patients with WT TCPTP — PTPN2 rs1893217 SNP null (AA/TT[–/–]; n = 6) — or who tested homozygous for the PTPN2 loss-of-function variant (GG/CC[+/+]; n = 6). Arrows indicate membrane localization of claudin-2. Scale bars: 200 μm, insert 50 μm. (E) Representative fluorescence images of claudin-2 and claudin-1 in control-shRNA and TCPTP-shRNA (TCPTP-KD) Caco-2BBe IECs cultured on glass coverslips. Arrows indicate increased claudin-2 membrane localization (n = 3).
Figure 7
Figure 7. Claudin-2 mediates altered TER but not FD4 permeability in TCPTP-deficient epithelial cells.
Control-shRNA and TCPTP-KD Caco-2BBe IECs cultured on Transwells for 7 days prior to treatment for 48 hours with no siRNA (open black circle) or control/scrambled (filled black circle) or CLDN2 (open red circle) siRNA. (A) TER and (B) FD4 permeability was measured (n = 4). (C) Tight junction freeze fracture morphology of control-shRNA (top) and TCPTP-KD (bottom) Caco-2BBe cells. The overall morphology of both the control and PTPN2-KD cells appeared similar in both the control and TCPTP-KD cells. Comparable fracture planes show continuous strands consistently segregating to the protoplasmic (P-) face (indicated with arrows) and grooves left in the exoplasmic (E-) face. However, more discontinuities in the P-face strands were observed in TCPTP-KD cells. Microvilli indicated by asterisks. Scale bar: 500 nm. Data are expressed as mean ± SD (n = 4). Comparisons between multiple groups were by 1-way ANOVA and Tukey’s posttest. *P < 0.05; **P < 0.01; ***P < 0.001.
Figure 8
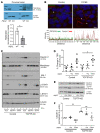
Figure 8. TCPTP promotes matriptase regulation of claudin-2, and recombinant matriptase rescues the claudin-2–mediated barrier defect in TCPTP-deficient IECs.
(A) Western blot of matriptase and β-actin in proximal colon (whole tissue) from Tcptp WT and KO mice. Densitometric quantification of Western blot colonic whole tissue matriptase expression normalized to tissue β-actin (*P < 0.05 vs. WT; n = 4). (B) Fluorescence micrograph showing line scan analysis of fluorescence intensity of claudin-2 (red; white arrows) and matriptase (green) expression in IFN-γ–treated (200 U/mL, 48 hours) control-shRNA and C216S-TC45 HCA-7 IECs. Representative of 4 to 6 scans per treatment condition (n = 4). (C) Western blots of control-shRNA and TCPTP-KD Caco-2 IECs transfected with control/scrambled siRNA (siCtr), or siRNA targeting STAT1 or hepatocyte growth factor activator inhibitor-1 (HAI-1), and probed for claudin-2, matriptase, HAI-1, phosphorylated (Y701) and total STAT1, and β-actin (D) TCPTP-shRNA– (TCPTP-KD) or control-shRNA–transfected HT-29 IEC monolayers grown on Transwells were treated apically or basolaterally with recombinant human matriptase (rMAT; 5 nM), and TER change after 24 hours was measured and compared with unchallenged monolayers (–). (E) Expression of claudin-2 in control-shRNA and TCPTP-KD HT-29 monolayers was determined by Western blotting and (F) quantified by densitometry. Data expressed as mean ± SD. Comparisons between multiple groups were by 1-way ANOVA and Student-Newman-Keuls posttest (n = 4). Comparison between 2 groups was by 2-tailed Student’s t test. *P < 0.05; **P < 0.01.

Comment in

References

    1. Turner JR. Intestinal mucosal barrier function in health and disease. Nat Rev Immunol. 2009;9(11):799–809. doi: 10.1038/nri2653. - DOI - PubMed
    1. Camilleri M. Leaky gut: mechanisms, measurement and clinical implications in humans. Gut. 2019;68(8):1516–1526. doi: 10.1136/gutjnl-2019-318427. - DOI - PMC - PubMed
    1. Nusrat A, et al. Molecular physiology and pathophysiology of tight junctions. IV. Regulation of tight junctions by extracellular stimuli: nutrients, cytokines, and immune cells. Am J Physiol Gastrointest Liver Physiol. 2000;279(5):G851–G857. doi: 10.1152/ajpgi.2000.279.5.G851. - DOI - PubMed
    1. Shen L, et al. Tight junction pore and leak pathways: a dynamic duo. Annu Rev Physiol. 2011;73:283–309. doi: 10.1146/annurev-physiol-012110-142150. - DOI - PMC - PubMed
    1. Vancamelbeke M, Vermeire S. The intestinal barrier: a fundamental role in health and disease. Expert Rev Gastroenterol Hepatol. 2017;11(9):821–834. doi: 10.1080/17474124.2017.1343143. - DOI - PMC - PubMed

Publication types

MeSH terms