Case Reports
. 2021 Sep 1;131(17):e150143.
doi: 10.1172/JCI150143.

Inherited human c-Rel deficiency disrupts myeloid and lymphoid immunity to multiple infectious agents

Affiliations
Case Reports

Inherited human c-Rel deficiency disrupts myeloid and lymphoid immunity to multiple infectious agents

Romain Lévy et al. J Clin Invest. .

Abstract

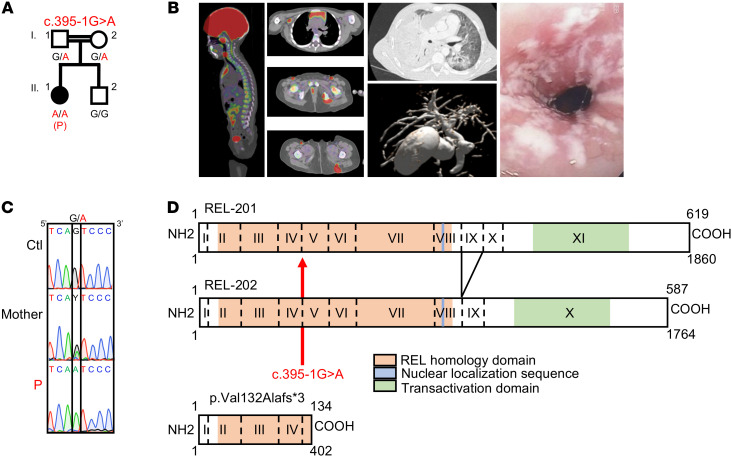
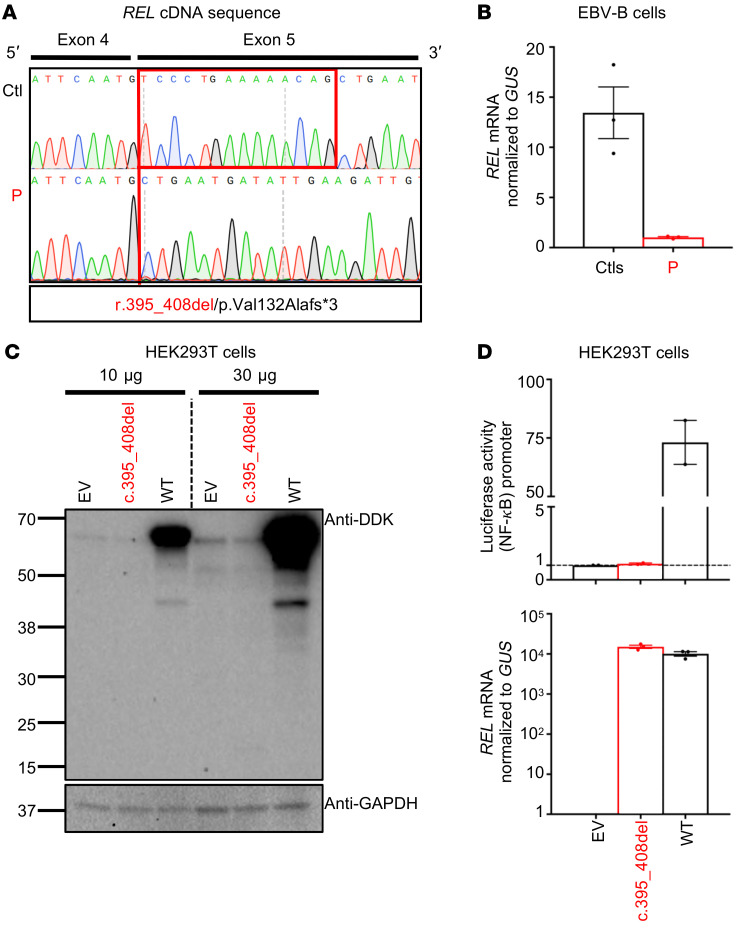
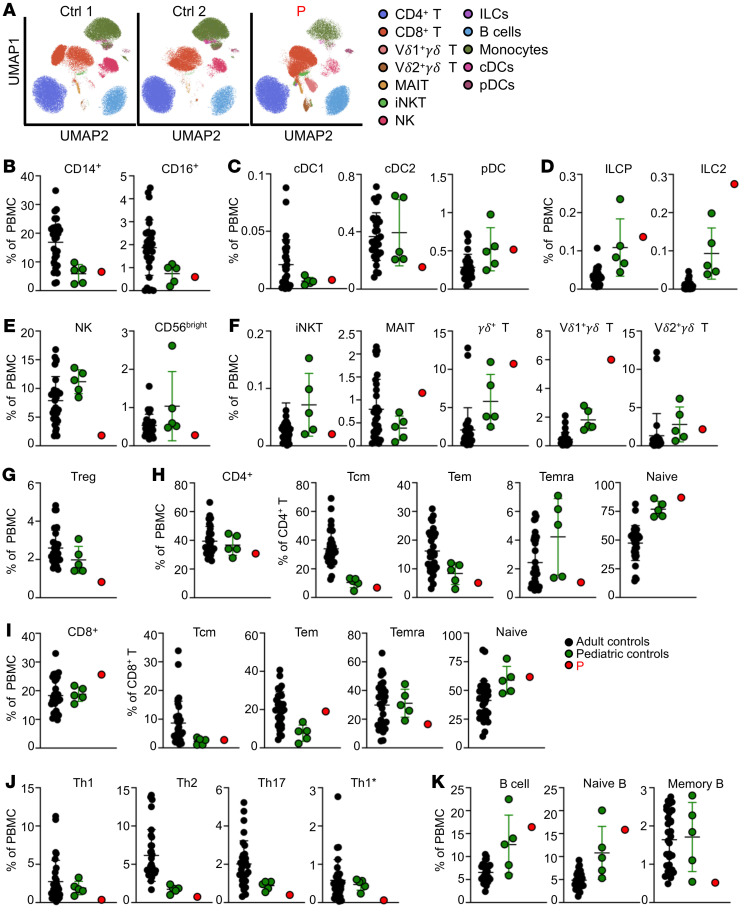
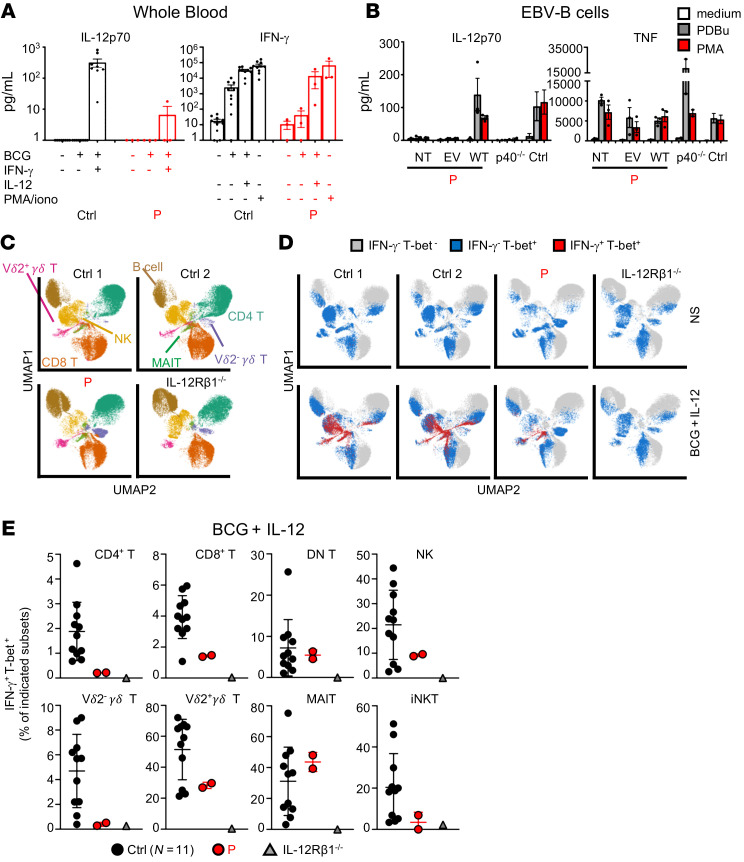
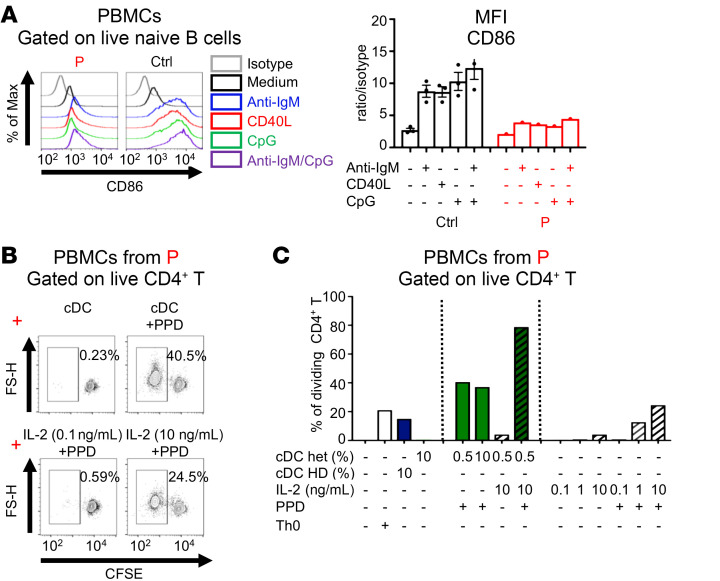
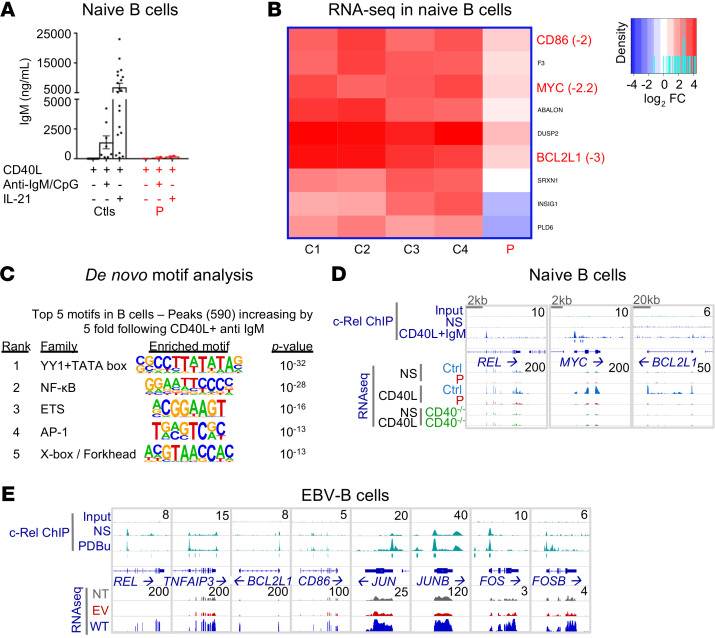
We studied a child with severe viral, bacterial, fungal, and parasitic diseases, who was homozygous for a loss-of-function mutation of REL, encoding c-Rel, which is selectively expressed in lymphoid and myeloid cells. The patient had low frequencies of NK, effector memory cells reexpressing CD45RA (Temra) CD8+ T cells, memory CD4+ T cells, including Th1 and Th1*, Tregs, and memory B cells, whereas the counts and proportions of other leukocyte subsets were normal. Functional deficits of myeloid cells included the abolition of IL-12 and IL-23 production by conventional DC1s (cDC1s) and monocytes, but not cDC2s. c-Rel was also required for induction of CD86 expression on, and thus antigen-presenting cell function of, cDCs. Functional deficits of lymphoid cells included reduced IL-2 production by naive T cells, correlating with low proliferation and survival rates and poor production of Th1, Th2, and Th17 cytokines by memory CD4+ T cells. In naive CD4+ T cells, c-Rel is dispensable for early IL2 induction but contributes to later phases of IL2 expression. The patient's naive B cells displayed impaired MYC and BCL2L1 induction, compromising B cell survival and proliferation and preventing their differentiation into Ig-secreting plasmablasts. Inherited c-Rel deficiency disrupts the development and function of multiple myeloid and lymphoid cells, compromising innate and adaptive immunity to multiple infectious agents.

Keywords: Genetic diseases; Genetics; Immunology.


Conflict of interest statement

Conflict of interest: The authors have declared that no conflict of interest exists.

Figures

Figure 1
Figure 1. A private homozygous essential splice site mutation of REL.
(A) Familial segregation. (B) From left to right: Disseminated BCG-osis with bone and lung lesions, cholangitis due to C. parvum, esophageal candidiasis. (C) REL genomic DNA electropherograms for a control (Ctl), P, and her mother. (D) Schematic representation of REL isoforms. The mutation is in the acceptor splice site of exon 5. The impact of the mutation is indicated.
Figure 2
Figure 2. An aberrant transcript underlies a loss of c-Rel production and function.
(A) PCR of full-length REL cDNA from EBV-B cells, showing a deletion of 14 nucleotides (r.395_408del) in exon 5 in P and a predicted termination codon (p.Val132Alafs*3). (B) RT-qPCR on total mRNA extracted from EBV-B cells from 3 controls (Ctls) and P. Data are displayed as 2-ΔCt after normalization to GUS expression. Data indicate the mean ± SEM. n = 3. (C) Western blot of extracts from HEK293T cells transfected with a pcDNA3.1 plasmid encoding an empty N-terminal DDK tag (empty vector [EV]), or encoding the WT or mutant (c.395_408del) REL allele. Two Abs were used: an Ab against the DDK tag and an Ab against GAPDH. Results are representative of 3 independent experiments. (D) Top panel: Luciferase activity of HEK293T cells cotransfected with an NF-κB reporter plasmid plus the pcDNA3.1 EV and a plasmid encoding the WT or c.395_408del REL allele. Results show the fold induction of activity relative to EV-transfected cells. Data indicate the mean ± SEM. n = 2. Each dot represents the mean of 9 technical replicates. Bottom panel: RT-qPCR results. Data are displayed as 2-ΔCt after normalization to GUS expression. Data indicate the mean ± SEM. n = 1. Each dot represents the mean of 3 technical replicates.
Figure 3
Figure 3. c-Rel deficiency alters the development of some lymphoid subsets.
Immunophenotyping of PBMCs from 31 adult controls, 5 pediatric controls, and P. (A) UMAP (uniform manifold approximation and projection) plots. The legends indicate the different leukocyte subsets, as defined by surface markers (provided in Methods). (B) Frequencies of monocyte subsets in total PBMCs. (C) Frequencies of cDCs and pDCs in total PBMCs. (D) ILC phenotyping showing the frequencies of ILC progenitors (ILCP) and ILC type 2 in total PBMCs. (E) NK cell phenotyping showing total NK cells and the frequency of CD56bright cells in total PBMCs. (F) Frequencies of iNKT cells, MAIT cells, γδ T cells, and Vδ1 and Vδ2 subsets in total PBMCs. (G) Frequency of Tregs in total PBMCs. (H and I) Frequencies of total CD4+ (H) and CD8+ (I) T cells in total PBMCs, and of naive, Tcm, Tem, and Temra cells within the CD4+ and CD8+ T cell compartments. (J) Frequencies of Th cell subsets in total PBMCs. (K) Frequencies of total B cells, naive B cells, and memory B cells in total PBMCs. Error bars represent the mean and SD.
Figure 4
Figure 4. Normal baseline transcriptome in c-Rel–deficient leukocytes at the single-cell level.
(A) UMAP clustering integrating scRNA-Seq data for PBMCs from P and 7 controls. Major cell clusters are labeled on the basis of enrichment in cell markers. B cells were extracted and clustered with UMAP to identify subsets on the basis of heavy- and light-chain usage and the naive versus memory state. Mo, monocytes; progenitors, hematopoietic stem cells. (B) Overlay of P’s cells captured by scRNA-Seq over the cells from controls (same UMAP as in A).
Figure 5
Figure 5. c-Rel deficiency affects the production of IL-12 and IFN-γ.
(A) ELISA results for IL-12p70 and IFN-γ production in whole blood from controls (n = 10) and P, after a 48-hour incubation with different ligands. Data indicate the mean ± SEM. n = 3. iono, ionomycin. (B) ELISA results showing IL-12p70 and TNF production in P’s EBV-B cells that were not transfected (NT), or transfected with an empty retroviral plasmid (EV) or a plasmid encoding the WT c-Rel (WT); in cells from patients with complete AR IL-12p40 deficiency (p40–/–, n = 2); and in cells from controls (n = 3), after a 24-hour incubation with PDBu (10–7 M) or PMA (400 ng/mL). Data indicate the mean ± SEM. n = 3. (CE) IFN-γ expression after 24 hours of stimulation of leukocytes from 11 controls, 1 patient with AR IL-12Rβ1 deficiency, and P. (C) UMAP plots are presented with legends indicating the different leukocyte subsets, as defined by surface markers (indicated in Methods). (D) UMAP plots show Tbet and IFN-γ expression in leukocyte subsets from 2 representative controls, 1 patient with AR IL-12Rβ1 deficiency, and P. (E) Dot plot graphs are shown with the values obtained in D. Error bars represent the mean and SD. Technical replicates are shown for P.
Figure 6
Figure 6. c-Rel deficiency impairs the upregulation of costimulatory molecules on peripheral cDCs and contributes to poor T cell responses to antigen.
(A) PBMCs from controls (n = 3) and P were incubated with the indicated ligands for 12 hours. Expression of CD86 was assessed on CD19+CD27 naive B cells. Max, maximum. (B and C) CFSE-stained PBMCs from P were cultured for 7 days under Th0 conditions, or with sorted LinHLA-DR+CD11c+ cDCs from a control donor (cDC HD) or P’s mother (cDC het) in 2 different proportions (0.5% or 10%), with or without various doses of IL-2 (ng/mL) or tuberculin (PPD; 5 μg /mL). (B) Flow cytometric plots showing CFSE dilution for viable CD4+ T cells and (C) analysis of the percentage of dividing cells. n = 1.
Figure 7
Figure 7. c-Rel deficiency impairs CD4+ T cell proliferation, IL-2 production, and effector function.
(A) Fresh PBMCs from controls (results for 1 control are shown) and P were incubated for 4 days with beads coated with anti-CD3/anti-CD28 mAbs, anti-CD2/anti-CD3/anti-CD28 mAbs (Th0), or PHA (1 μg/mL) with or without IL-2. Histograms show CFSE dilution for CD4+ T cells. Representative results from 3 independent experiments are shown. (B) Fresh PBMCs from 4 controls and P were cultured for 6 hours with anti-CD3/anti-CD28 mAbs or PMA (20 ng/mL) and ionomycin (10–7 M) (P/I). The percentage of IL-2+ cells and MFI of IL-2 in CD4+ T cells are shown. (C) Sorted naive CD4+ T cells from controls (n = 4) and P were incubated for 4 days under Th0 conditions. Flow cytometric analyses of CFSE dilution were performed, and the percentage of cells in each division was analyzed. Data indicate the mean ± SEM. Representative results from 2 independent experiments are shown. (D) Percentage of IL-2+ cells, analyzed by flow cytometry, in sorted naive CD4+ T cells from controls (n = 11) and P, after 4 days culturing under Th0 conditions. Data indicate the mean ± SEM. n = 3. (E) Analysis of cytokine production by sorted naive CD4+ T cells cultured under Th0 or Th1- or Th17-polarizing conditions. Cells were obtained from 40 (Th1 culture) and 30 (Th17 culture) controls and P, and cytokine production was measured after 5 days. Data indicate the mean ± SEM. Representative results from 2 independent experiments are shown. (F and G) Cytokine production by sorted memory CD4+ T cells from controls (n = 32) and P was measured after 5 days of culturing under Th0 conditions. Data indicate the mean ± SEM. Representative results from 2 independent experiments are shown.
Figure 8
Figure 8. c-Rel regulates the expression of a restricted set of genes at early stages of CD4+ T cell activation.
(A) Heatmap showing log2 FC of expression in PMA-stimulated naive CD4+ T cell at 2 hours. Only genes both differentially expressed in response to stimulation in controls (adjusted P < 0.05 and | log2 FC | >1) and differentially expressed in P (adjusted P < 0.05 and | log2 FC | >2) are shown. For selected genes, the log2 FC between controls and P is indicated. (B) DNA binding motifs at PMA-induced c-Rel binding peaks. The de novo motif discovery P value and family of transcription factors are shown. (C) Bubble histogram showing the association of P’s dysregulated genes with c-Rel genomic binding sites as defined by ChIP-Seq in PMA-stimulated naive CD4+ T cells and located within 10 kb of their transcription start site. The association was computed for all c-Rel peaks and for a subgroup of peaks for which c-Rel binding increased by more than 5-fold following stimulation (1309 peaks). The circle size represents the significance of the association (–log10 Fisher’s exact test P value). The color gradient shows the ratio of the number of peaks proximal (within 10 kb) to these genes relative to randomly selected gene sets. (D) Genomic snapshots of selected genes with lower levels of expression in P. The top 3 tracks show the control input DNA and ChIP-Seq for c-Rel in nonstimulated (NS) and PMA-treated naive CD4+ T cells from 3 controls; blue boxes indicate significant c-Rel binding peaks. Below the gene structure are shown the normalized RNA-Seq profiles for naive CD4+ T cells from controls (overlaid) and P, at steady state or after stimulation. (E) RT-qPCR after 2 hours of activation of naive CD4+ T cells from 4 controls and P with anti-CD3 mAb with or without anti-CD28 mAb. Data are displayed as 2-ΔCt after normalization to GUS expression. Error bars represent the SD. n = 1.
Figure 9
Figure 9. The B cell response is impaired in c-Rel deficiency.
(A) Naive B cells from controls (n = 20) and P, cultured with CD40L, alone or in combination with anti-IgM mAb and CpG or IL-21 for 7 days. IgM secretion was assessed by IgH chain–specific ELISA. n = 2. Data indicate the mean ± SEM. (B) Heatmap representing the log2 FC of expression in naive B cells stimulated with CD40L at 2 hours. Only the genes both differentially expressed in response to stimulation in controls (adjusted P < 0.05 and | log2 FC | >1) and differentially expressed in P (adjusted P < 0.05 and | log2 FC | >2) are shown. For selected genes, the log2 FC difference between controls and P is indicated. (C) DNA binding motifs enriched at CD40L plus anti-IgM–induced c-Rel binding peaks. The de novo motif discovery P value and family of transcription factors are shown. (D) Genomic snapshots of selected genes with altered responses to CD40L in P. Shown, from top to bottom, are the normalized sequence read profiles for control input DNA and ChIP-Seq for c-Rel in nonstimulated and CD40L plus anti-IgM–treated naive B cells from controls (blue boxes indicate significant c-Rel binding peaks), together with RNA-Seq profiles for nonstimulated and CD40L-treated controls (overlaid), P, and a CD40-deficient patient. (E) Genomic snapshots of selected genes for which expression in P’s EBV-B cells was rescued by retroviral transduction with a plasmid encoding the WT c-Rel. Shown, from top to bottom, are normalized profiles for control input DNA and ChIP-Seq for c-Rel in nonstimulated and PDBu-treated EBV-B cells from controls (blue boxes indicate significant c-Rel binding peaks), together with RNA-Seq profiles for nonstimulated EBV-B cells from P that were not transfected, or that were transfected with an empty retroviral plasmid or a plasmid encoding the WT c-Rel.

References

    1. Fischer A, et al. Notarangelo LD, et al. Human inborn errors of immunity: an expanding universe. Science Immunology. 2020;5(49):eabb1662. doi: 10.1126/sciimmunol.abb1662. - DOI - PMC - PubMed
    1. Notarangelo LD. Combined immunodeficiencies with nonfunctional T lymphocytes. Adv Immunol. 2014;121:121–190. doi: 10.1016/B978-0-12-800100-4.00004-0. - DOI - PubMed
    1. Ouederni M, et al. Major histocompatibility complex class II expression deficiency caused by a RFXANK founder mutation: a survey of 35 patients. Blood. 2011;118(19):5108–5118. doi: 10.1182/blood-2011-05-352716. - DOI - PubMed
    1. Al-Herz W, et al. Major histocompatibility complex class II deficiency in Kuwait: clinical manifestations, immunological findings and molecular profile. J Clin Immunol. 2013;33(3):513–519. doi: 10.1007/s10875-012-9831-8. - DOI - PubMed
    1. Tangye SG, et al. Human inborn errors of immunity: 2019 update on the classification from the International Union of Immunological Societies Expert Committee. J Clin Immunol. 2020;40(1):24–64. doi: 10.1007/s10875-019-00737-x. - DOI - PMC - PubMed

Publication types

MeSH terms