. 2021 Dec 6;218(12):e20211003.
doi: 10.1084/jem.20211003. Epub 2021 Oct 8.

Glycan engineering of the SARS-CoV-2 receptor-binding domain elicits cross-neutralizing antibodies for SARS-related viruses

Affiliations

Glycan engineering of the SARS-CoV-2 receptor-binding domain elicits cross-neutralizing antibodies for SARS-related viruses

Ryo Shinnakasu et al. J Exp Med. .

Abstract

Broadly protective vaccines against SARS-related coronaviruses that may cause future outbreaks are urgently needed. The SARS-CoV-2 spike receptor-binding domain (RBD) comprises two regions, the core-RBD and the receptor-binding motif (RBM); the former is structurally conserved between SARS-CoV-2 and SARS-CoV. Here, in order to elicit humoral responses to the more conserved core-RBD, we introduced N-linked glycans onto RBM surfaces of the SARS-CoV-2 RBD and used them as immunogens in a mouse model. We found that glycan addition elicited higher proportions of the core-RBD-specific germinal center (GC) B cells and antibody responses, thereby manifesting significant neutralizing activity for SARS-CoV, SARS-CoV-2, and the bat WIV1-CoV. These results have implications for the design of SARS-like virus vaccines.


Conflict of interest statement

Disclosures: R. Shinnakasu, S. Sakakibara, and T. Kurosaki reported a patent to "glycan engineering of the SARS-CoV-2 receptor-binding domain elicits cross-neutralizing antibodies for SARS-related viruses" pending. N. Sax and K. Yamashita reported personal fees from KOTAI Biotechnologies, Inc. outside the submitted work. No other disclosures were reported.

Figures
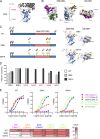
Figure 1.
Figure 1.
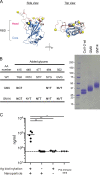
Design of CoV-2 RBD glycan engineering mutants. (A) Structure of RBD of CoV-2 S (Protein Data Bank accession no. 6YZ5) that engages the ACE2 ectodomain (Protein Data Bank accession no. 6M0J). Head and core subdomains are colored in red and blue, respectively. ACE2 is colored in gray. (B) Epitopes of representative anti–CoV-2 mAbs. (C) Schematic illustration of glycosylation sites in CoV-2 RBD WT, GM9, and GM14. The native and additional glycosylation sites are shown in black and yellow, respectively. Ribbon models of GM9 and GM14 are shown on the right. The yellow spheres are the introduced N-glycan sites. (D) Glycan occupancy at N-linked glycosylation sites of CoV-2 RBD WT, GM9, and GM14 determined by LC/MS. The bars indicate the percentage of glycan occupancy for each site. (E) ELISA binding of previously reported mAbs against CoV-2 RBD (CB6, C002, S309, CR3022, and EY6A) to CoV-2 RBD WT, GM9, and GM14. Anti–Candida albicans human IgG1 mAb 23B12 was used for a negative control. Heatmap shows the percentage of binding (the value of the area under the curve [AUC] in ELISA for CoV-2 RBD WT is set at 100% for each mAb). Representative results from three independent experiments are shown. conc., concentration.
Figure S1.
Figure S1.
Design and expression of antigens, and effective induction of anti–CoV-2 RBD antibodies after immunization with nanoparticle antigen. (A) RBD-ACE2 complex. Non-conserved residues between CoV-1 and CoV-2 are colored in white. (B) The parental amino acid sequences and introduced NXT sequons (left). SDS-PAGE of RBD WT, GM9, and GM14 (right). (C) ELISA plots for CoV-2 RBD WT probe recognition of sera from respective biotin (+) RBD/Streptavidin nanoparticles, biotin (−) RBD/Streptavidin nanoparticles, or only biotin (+) RBD-immunized mice 3 wk after primary immunization or preimmune mice. The CR3022 mouse IgG1 mAb (Invivogen) was used as a standard. Representative of two independent experiments. Horizontal lines indicate mean values. Biotin (+) RBD/Streptavidin nanoparticles (n = 5); biotin (−) RBD/Streptavidin nanoparticles (n = 5); only biotin (+) RBD (n = 5); preimmune sera (n = 3). Dotted lines indicate detection limit. Horizontal lines indicate mean values; each symbol indicates one mouse. *, P < 0.05; **, P < 0.01; unpaired Student’s test. Ag, antigen.
Figure 2.
Figure 2.
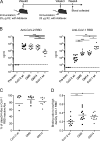
Glycan mutants of CoV-2 RBD immunogen effectively elicited CoV-1 RBD–specific antibodies. (A) Schematic overview of the experimental design. (B) CoV-2 RBD (left) or CoV-1 RBD (right) –specific IgG1 antibody levels in sera from preimmune (Pre-imm.) mice or CoV-2 RBD WT, GM9, GM14, or CoV-1 RBD WT–immunized mice were measured by ELISA. Samples were pooled from three independent experiments. Preimmune sera (n = 3); CoV-2 RBD WT (n = 11); GM9 (n = 11); GM14 (n = 11); CoV-1 RBD WT (n = 8). (C) Class 3/4 type serum antibodies from CoV-2 RBD WT, GM9, or GM14–immunized mice were measured by epitope-blocking ELISA with a mixture of CR3022/EY6A/S309 human IgG1 mAbs. CoV-2 RBD WT (n = 8); GM9 (n = 8); GM14 (n = 8). Samples were pooled from two independent experiments. (D) Affinity measurements were determined by ELISA, expressed as the binding ratio to low density/high density of plate-bound CoV-1 RBD protein. Samples were pooled from three independent experiments. CoV-2 RBD WT (n = 11); GM9 (n = 11); GM14 (n = 11). The CR3022 mouse IgG1 mAb (Invivogen) was used as a standard. Dotted lines indicate detection limit. Horizontal lines indicate mean values; each symbol indicates one mouse. *, P < 0.05; **, P < 0.01; ***, P < 0.001; unpaired Student’s t test (A, B, and D). Abs, antibodies.
Figure S2.
Figure S2.
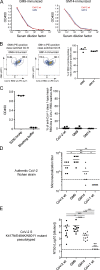
Antibody response of mice immunized with CoV-2 RBD WT, GM9, GM14, and CoV-1 RBD WT. (A) ELISA plots for CoV-2 RBD WT and GM9-GM14 probes of sera from GM9 or GM14-immunized mice. Sera were collected at 3 wk after primary immunization. Representative results from three independent experiments are shown. (B) The representative FACS plots of GC B cells from dLNs after immunization are shown. Cells were gated for antigen-binding IgG+ GC B cells (CD138B220+IgG+GL7+Fas+). The graph shows the percentage of positive cells for RBD WT binding among GM9- or GM14-binding cells. GM9 (n = 4); GM14 (n = 4). (C) CoV-1 head-RBD subdomain specific serum antibodies from CoV-2 RBD WT–, GM9-, or GM14-immunized mice were measured by epitope-blocking ELISA with S230 human IgG1 mAb as shown in Fig. 2 C. ELISA binding of S230 human mAb against CoV-1 head-RBD to plate-coated CoV-1 RBD (left). Percentages of CoV-1 head-RBD subdomain specific serum antibodies in whole CoV-1 RBD reactive antibodies (right). Samples were pooled from two independent experiments. The CR3022 mouse IgG1 mAb (Invivogen) was used as a standard. CoV-2 RBD WT (n = 8); GM9 (n = 8); GM14 (n = 8). (D) Serum neutralization against authentic CoV-2. A mixture of 100 TCID50 virus and serially diluted, heat-inactivated plasma samples (twofold serial dilutions starting from 1:40 dilution) were incubated at 37°C for 1 h before being placed on VeroE6-TMPRSS2 cells seeded in 96-well plates. After culturing for 4 d, cells were fixed with formalin and stained with crystal violet solution. Cutoff dilution index with >50% cytopathic effect was presented as microneutralization titer. Microneutralization titer of the sample below the detection limit (1:40 dilution) was set at 20. (E) Pseudovirus assay using VSV-ΔGluc carrying CoV-2 S K417N/E484K/N501Y. Horizontal lines indicate mean values; each symbol indicates one mouse. *, P < 0.05; **, P < 0.01; ***, P < 0.001; unpaired Student’s test (D and E). Ab, antibody.
Figure 3.
Figure 3.
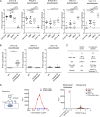
Glycan engineering of the CoV-2 head-RBD elicited cross-neutralizing activities against CoV-1 and WIV1. (A) BALB/c mice were prime-boost-immunized with CoV-2 RBD WT, GM9, GM14, or CoV-1 RBD WT as shown in Fig. 2. Sera were collected 7 d after boost and preincubated with CoV-2 S, PaGX S, SHC014 S, WIV1 S, or CoV-1 S–pseudotyped VSVΔG-luc for 1 h. The mixture was incubated with VeroE6 TMPRESS2 cells overnight. CoV-2 RBD WT (n = 11); GM9 (n = 11); GM14 (n = 11); CoV-1 RBD WT (n = 8). (B) Neutralization activities of plasma samples from prepandemic healthy donors (HC, n = 8) or convalescent COVID-19 patients (n = 24) against CoV-2, CoV-1, and WIV1 S–pseudotyped VSVΔG-luc. (C) Donor information. (D) ADE assay. Schematic representation of ADE assay (left). ADE of infection of Raji cells by MW05 mouse IgG1 mAb (middle). CoV-2 S–pseudotyped VSVΔG-luc was preincubated with different concentrations of MW05 mouse IgG1 mAb, or control mouse IgG1, and then added onto Raji cells. The luciferase activity was measured at 16 h after infection. Serially diluted sera from immunized mice showed no significant ADE activity (right). MW05 mouse IgG1 and irrelevant mouse IgG1 (0.1 µg/ml) were used for positive and negative control, respectively. CoV-2 WT (n = 4); GM9 (n = 5); GM14 (n = 5); CoV-1 WT (n = 4); preimmune sera (n = 3). Representative results from two or three independent experiments are shown (A–D). Data are mean ± SEM (D). Dotted lines in the graphs (NT50 = 20) represent the lower limit of detection (A and B). *, P < 0.05; **, P < 0.01; ***, P < 0.001; unpaired Student’s t test (A and B).
Figure S3.
Figure S3.
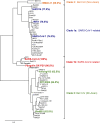
Phylogenetic tree of RBD sequences from representative sarbecoviruses. The tree was constructed by Phylogeny.fr with Jones–Taylor–Thornton substitution model. The scale bar represents phylogenetic distance of 0.2 amino acid substitutions per site. Sarbecovirus RBDs used in bead-based flow-cytometric assays and biolayer interferometry (Fig. 5) are shown in bold. The percentages of sequence identity of RBDs from these viruses compared with CoV-2 RBD (aa 331–529) are denoted in parentheses. SE-Asian, Southeast Asian.
Figure 4.
Figure 4.
Immunization with CoV-2 GM antigens leads to the activation of CoV-1 and CoV-2 cross-reactive GC B cells. (A) Representative flow cytometry plots analyzing GC B cells (CD138B220+IgDIgMGL7+Fas+) from draining lymph nodes (dLNs) of mice 3 wk after primary immunization with each antigen. The plots are representative of findings from two independent experiments (left). Quantification of absolute numbers of GC B cells (right) from multiple mice in one experiment. Results are representative of two independent experiments. CoV-2 RBD WT (n = 5); GM9 (n = 5); GM14 (n = 5). (B) Representative flow cytometry plots analyzing CoV-2 RBD–binding dLN GC B cells (CD138B220+IgDIgMGL7+Fas+CoV-2 RBD+). Plots are representative of findings from two independent experiments (left). Quantification of absolute numbers of GC B cells (right) from multiple mice in one experiment. Results are representative of two independent experiments. CoV-2 RBD WT (n = 6); GM9 (n = 6); GM14 (n = 6). (C) Cross-reactivity of CoV-2 RBD-binding dLN GC B cells (CD138B220+IgDIgMGL7+Fas+CoV-2 RBD [APC]+ CoV-2 RBD [PE-Cy7]+) with CoV-1 RBD assessed by flow cytometry. Plots are representative of findings from two independent experiments (left). The frequency of CoV-1 and CoV-2 RBD cross-reactive GC B cells (right) from multiple mice in one experiment. Results are representative of two independent experiments. CoV-2 RBD WT (n = 6); GM9 (n = 6); GM14 (n = 6). Horizontal lines indicate mean values; each symbol indicates one mouse. *, P < 0.05; **, P < 0.01; unpaired Student’s t test.
Figure 5.
Figure 5.
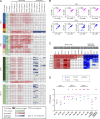
Binding properties of GC-derived mAbs. (A) Clonality, VH and VK mutations, binding to S RBDs of CoV-1, WIV1, SHC014, CoV-2, PaGX, AL-103, Rs4081, Rf1/2004, and BM48-31, neutralizing activity against CoV-1, WIV1, SHC014, CoV-2, and PaGX pseudoviruses of mAbs derived from CoV-1 and CoV-2 RBD cross-reactive GC B cells of mice immunized with GM9 (GM9-1 and GM9-2) or GM14 (GM14-1 and GM14-2). (B) Correlation between mAb binding to CoV-2 RBD and other sarbecovirus RBDs. Binding of mAbs with individual RBDs was measured by bead-based flow-cytometric assays. The binding signals to respective RBDs (gMFI) are plotted in the graph. Spearman’s rank correlation coefficients and P values are shown. (C) Binding affinity of human Fab fragments with RBD proteins determined by biolayer interferometry. The equilibrium dissociation constants (KD[M]) and IC50s (μg/ml) of individual clones are shown. (D) Neutralizing activity (IC50 [μg/ml]) of representative cross-reactive mAbs and mouse IgG2c recombinant antibodies carrying the variable regions of previously isolated S304 (class 3) and CR3022 (class 4) human anti-RBD antibodies. Results are representative of at least two independent experiments (A–D). Ab, antibody.
Figure S4.
Figure S4.
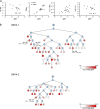
Reactivity and phylogenetic analysis of mAbs. (A) Correlation between gMFI from bead-based flow-cytometric assay and Rmax from biolayer interferometry (Octet) assay. gMFI and dissociation constant [KD(M)], maximal R (RMax), association rate (kon; 1/ms), and dissociation rate (koff) of bivalent mAb-CoV-2 RBD interactions. Spearman coefficient and P value were calculated by Prism software. (B) The phylogenetic tree of clonal lineages of GC-derived clones from GM14-1 and GM14-2 mice. The root is unmutated germline ancestor. The blue circles are inferred sequences. The white and red colors of the circles indicate the intensity of CoV-2 RBD binding in bead-based flow-cytometric assay (Table S1). The circles with stars are clones with high neutralization activity against CoV-2 (Fig. 5 C).
Figure 6.
Figure 6.
Generation of cross-reactive memory B cells and long-lived plasma cells in mice immunized with GM9 or GM14. (A) Schematic overview of the experimental design. (B) The cross-reactivity of CoV-2 RBD-specific memory B cells (CD138B220+IgG+CD38+GL7 CoV-2 RBD[APC]+ CoV-2 RBD[PE-Cy7]+) with CoV-1 RBD from spleen of mice 1 mo after boost immunization with each antigen was assessed by flow cytometry. The plots are representative of finding from two independent experiments (left). Frequency of CoV-1 and CoV-2 RBD cross-reactive memory B cells (middle) and quantification of absolute numbers of total CoV-2 RBD-specific memory B cells (right) from multiple mice in one experiment. Results are representative of two independent experiments. CoV-2 RBD WT (n = 5); GM9 (n = 5); GM14 (n = 5). (C) ELISPOT analysis of CoV-1 RBD– (left) or CoV-2 RBD– (right) specific IgG1 ASC responses of bone marrow (BM) cells from preimmune (Pre-imm) mice, or mice 1 mo after boost immunizations with each antigen. Results are representative of two independent experiments. Preimmune (n = 1); CoV-2 RBD WT (n = 4); GM9 (n = 4); GM14 (n = 4). Horizontal lines indicate mean values; each symbol indicates one mouse. *, P < 0.05; **, P < 0.01; ***, P < 0.001; unpaired Student’s t test.

References

    1. Bajic, G., Maron M.J., Adachi Y., Onodera T., McCarthy K.R., McGee C.E., Sempowski G.D., Takahashi Y., Kelsoe G., Kuraoka M., and Schmidt A.G.. 2019. Influenza Antigen Engineering Focuses Immune Responses to a Subdominant but Broadly Protective Viral Epitope. Cell Host Microbe. 25:827–835.e6. 10.1016/j.chom.2019.04.003 - DOI - PMC - PubMed
    1. Barnes, C.O., Jette C.A., Abernathy M.E., Dam K.A., Esswein S.R., Gristick H.B., Malyutin A.G., Sharaf N.G., Huey-Tubman K.E., Lee Y.E., et al. . 2020a. SARS-CoV-2 neutralizing antibody structures inform therapeutic strategies. Nature. 588:682–687. 10.1038/s41586-020-2852-1 - DOI - PMC - PubMed
    1. Barnes, C.O., West A.P. Jr., Huey-Tubman K.E., Hoffmann M.A.G., Sharaf N.G., Hoffman P.R., Koranda N., Gristick H.B., Gaebler C., Muecksch F., et al. . 2020b. Structures of Human Antibodies Bound to SARS-CoV-2 Spike Reveal Common Epitopes and Recurrent Features of Antibodies. Cell. 182:828–842.e16. 10.1016/j.cell.2020.06.025 - DOI - PMC - PubMed
    1. Bournazos, S., Gupta A., and Ravetch J.V.. 2020. The role of IgG Fc receptors in antibody-dependent enhancement. Nat. Rev. Immunol. 20:633–643. 10.1038/s41577-020-00410-0 - DOI - PMC - PubMed
    1. Breitling, J., and Aebi M.. 2013. N-linked protein glycosylation in the endoplasmic reticulum. Cold Spring Harb. Perspect. Biol. 5:a013359. 10.1101/cshperspect.a013359 - DOI - PMC - PubMed

Publication types

MeSH terms