. 2022 Jan 27;38(4):997-1004.
doi: 10.1093/bioinformatics/btab704.

Clustering spatial transcriptomics data

Affiliations

Clustering spatial transcriptomics data

Haotian Teng et al. Bioinformatics. .

Erratum in

Abstract

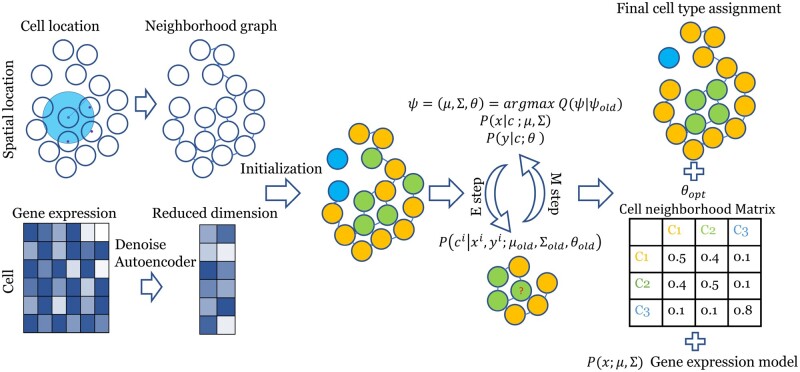
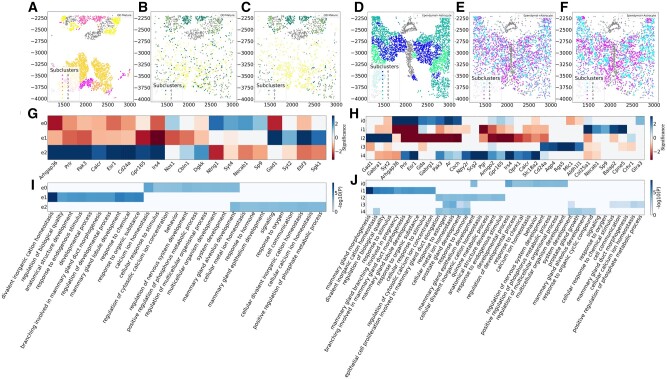
Motivation: Recent advancements in fluorescence in situ hybridization (FISH) techniques enable them to concurrently obtain information on the location and gene expression of single cells. A key question in the initial analysis of such spatial transcriptomics data is the assignment of cell types. To date, most studies used methods that only rely on the expression levels of the genes in each cell for such assignments. To fully utilize the data and to improve the ability to identify novel sub-types, we developed a new method, FICT, which combines both expression and neighborhood information when assigning cell types.

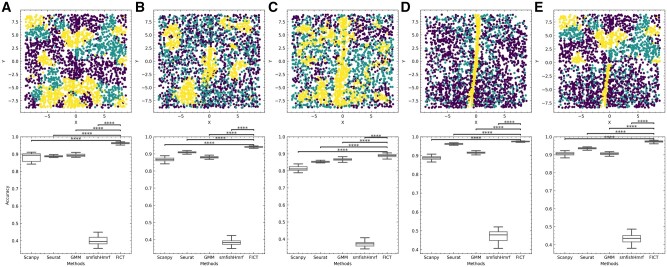
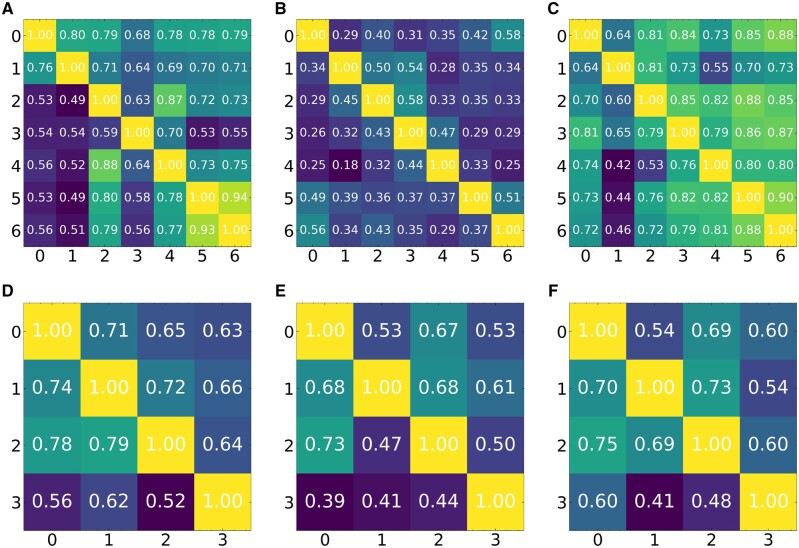
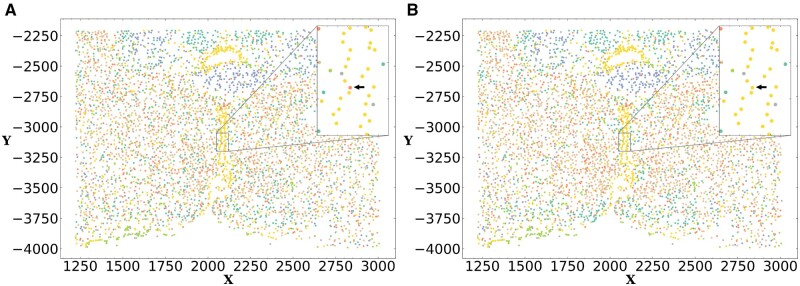
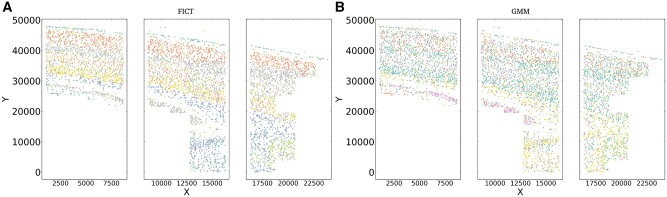
Results: FICT optimizes a probabilistic function that we formalize and for which we provide learning and inference algorithms. We used FICT to analyze both simulated and several real spatial transcriptomics data. As we show, FICT can accurately identify cell types and sub-types, improving on expression only methods and other methods proposed for clustering spatial transcriptomics data. Some of the spatial sub-types identified by FICT provide novel hypotheses about the new functions for excitatory and inhibitory neurons.

Availability and implementation: FICT is available at: https://github.com/haotianteng/FICT.

Supplementary information: Supplementary data are available at Bioinformatics online.


Figures

Fig. 1.
Fig. 1.
FICT pipeline. A reduced dimension expression profile is generated using a Denoising Autoencoder (Vincent et al., 2008), and an undirected graph is constructed according to the spatial locations information. Cells are initially clustered using an expression only GMM. Next, the model is iteratively optimized using an EM algorithm to improve the joint likelihood of the expression and neighborhood models given both the gene expression representation and the spatial graph. The final output is an assignment of cells to clusters, a Gaussian gene expression model and a Multinomial neighborhood model for each class
Fig. 2.
Fig. 2.
Evaluation using simulated data. Top: Simulated ground truth cell-type assignments. Cells locations are from the MERFISH dataset (see Supplementary Fig. SA4 for selected cells). Four neighborhood frequency configurations were simulated: (A) Addictive configuration where cells prefer to aggregate with cells from same type. (B) Exclusive configuration where type 1 and type 2 cells are mixed (green and purple cells) while type 3 cells (yellow cells) cluster together. (C) Consecutive configuration where, type 1 cells surround type 2 cells but not type 3 cells. (D) Cell-type assignments from the MERFISH paper (yellow—Ependymal cells, green—Excitatory cells and purple—inhibitory cells). (E) A mixture model where neighborhood distribution for each cell type is a mixture of the distributions in A and D. Bottom: performance of the five methods we tested on simulated datasets. Accuracy for each method is averaged from 50 random expression assignment (Section 2). P value is calculated using paired samples t-test. ****P<0.0001 (Color version of this figure is available at Bioinformatics online.)
Fig. 3.
Fig. 3.
Mean Adjusted Rand index (ARI) based on cross-validation analysis of the MERFISH dataset. Results presented for expression only GMM, smfishHmrf and FICT. Each entry (i, j) in the matrix represents the ARI of the two cluster assignments (one learned on animal A and applied to animal B and the other learned directly on B). (A–C) Results for the 7 Male animals (A) GMM, (B) smfishHmrf and (C) FICT. (D–F) Results for the 4 Females (D) GMM, (E) smfishHmrf and (F) FICT. The x and y axes are the index of the dataset being cross validated on
Fig. 4.
Fig. 4.
FICT can correct expression noise. Cell-type assignments using expression only GMM (left) and FICT (right). Using the spatial information FICT correctly assigns Ependymal cells along the periventricular hypothalamic nucleus. In contrast, the GMM method mistakenly classified the cell as OD Immature Cell
Fig. 5.
Fig. 5.
Cell sub-type clustering on MERFISH data from animal 1. We used smfishHmrf (A and D), expression only GMM (B and E) and FICT (C and F) to sub-cluster excitatory neurons cells (A, B and C) and inhibitory neuron cells (D, E and F). As can be seen, for both types of neurons FICT assignments are better spatially conserved creating a central core for sub-cluster 2 surrounded by cells assigned to sub-cluster 0. In contrast, the expression only assignment mixes cells from different sub-types much more. smfishHmrf with Potts model only assigns affinity score between the same cell types making it harder to infer more complex structures of synergistic activity. (E) DE genes for the three FICT sub-clusters from the excitatory neurons and (F) inhibitory neurons. As can be seen, even though the sub-clusters are overall similar in terms of their expression profiles, some genes can be identified for each of the sub-clusters. (G) GO enrichment analysis identifies unique functions for each of the sub-clusters on excitatory neurons and (H) inhibitory neurons. Significance of the differential expressed genes is measured by the log of gene enrichment fold change
Fig. 6.
Fig. 6.
Cluster assignment scatter plot for osmFISH dataset. (A) Clusters generated by FICT and (B) clusters based on using expression data only as was done in the original paper. As can be seen, FICT correctly distinguishes between neurons in different layers of the brain, whereas expression only clustering mixes cells from different brain layers

References

    1. Abdelaal T. et al. (2019) A comparison of automatic cell identification methods for single-cell RNA sequencing data. Genome Biol., 20, 194. - PMC - PubMed
    1. Arnol D. et al. (2019) Modeling cell-cell interactions from spatial molecular data with spatial variance component analysis. Cell Rep., 29, 202–211. - PMC - PubMed
    1. Ashburner M. et al. (2000) Gene ontology: tool for the unification of biology. Nat. Genet., 25, 25–29. - PMC - PubMed
    1. Besag J. (1986) On the statistical analysis of dirty pictures. J. R. Stat. Soc. Ser. B (Methodological), 48, 259–279.
    1. Blondel V.D. et al. (2008) Fast unfolding of communities in large networks. J. Stat. Mech. Theory Exp., 2008, P10008.

Publication types