. 2021 Oct 8;7(41):eabi9551.
doi: 10.1126/sciadv.abi9551. Epub 2021 Oct 8.

Metabolic responsiveness to training depends on insulin sensitivity and protein content of exosomes in insulin-resistant males

Affiliations

Metabolic responsiveness to training depends on insulin sensitivity and protein content of exosomes in insulin-resistant males

Maria Apostolopoulou et al. Sci Adv. .

Abstract

High-intensity interval training (HIIT) improves cardiorespiratory fitness (VO2max), but its impact on metabolism remains unclear. We hypothesized that 12-week HIIT increases insulin sensitivity in males with or without type 2 diabetes [T2D and NDM (nondiabetic humans)]. However, despite identically higher VO2max, mainly insulin-resistant (IR) persons (T2D and IR NDM) showed distinct alterations of circulating small extracellular vesicles (SEVs) along with lower inhibitory metabolic (protein kinase Cε activity) or inflammatory (nuclear factor κB) signaling in muscle of T2D or IR NDM, respectively. This is related to the specific alterations in SEV proteome reflecting down-regulation of the phospholipase C pathway (T2D) and up-regulated antioxidant capacity (IR NDM). Thus, SEV cargo may contribute to modulating the individual metabolic responsiveness to exercise training in humans.


Figures

Fig. 1.
Fig. 1.. HIIT induces metabolic changes and stimulates maximal skeletal muscle mitochondrial capacity in humans with (T2D) and without T2D (NDM).
(A) Maximal oxygen uptake (VO2max) (***P = 0.00025 for T2D, ***P = 6.42 × 10⁻⁵ for IR NDM, and **P = 0.008 for IS NDM), (B) peripheral insulin sensitivity (M value) (**P = 0.003 for T2D and **P = 0.002 for IR NDM), (C) hepatic insulin sensitivity [suppression of EGP (iEGP)] during high-insulin clamp (***P = 0.0001 for T2D, **P = 0.007 for IR NDM, and *P = 0.02 for IS NDM; #P = 0.01 T2D versus IR NDM, ###P = 7.87 × 10⁻⁷ T2D versus IS NDM; & P = 0.04 IR NDM versus IS NDM), (D) liver fat content (**P = 0.003 for T2D and *P = 0.02 for IR NDM; ###P = 0.0005 T2D versus IR NDM, ###P = 7.17 × 10⁻⁵ T2D versus IS NDM), (E) maximal uncoupled respiration (Ww, wet weight) (***P = 3.73 × 10⁻⁵ for T2D, ***P = 0.0005 for IR NDM, and **P = 0.001 for IS NDM), (F) leak control ratio (LCR), (G) citrate synthase activity (CSA) (**P = 0.001 for T2D, ***P < 0.0001 for IR NDM, and **P = 0.004 for IS NDM; §§P = 0.004 T2D versus IR NDM, §P = 0.01 IS NDM versus IR NDM at 12 weeks), and (H) reduced-to-oxidized glutathione (GSH/GSSG) ratio (***P < 0.0001 for T2D and IS NDM and ***P = 0.0002 for IR NDM) at baseline and after 12-week HIIT in persons with T2D, IR NDM, and IS NDM. Data are presented as means ± SEM.
Fig. 2.
Fig. 2.. HIIT differently affects myocellular pathways of insulin sensitivity in the IR responders (T2D-R and IR-R).
(A) M value (***P = 3.88 × 10⁻⁵ for T2D-R, ***P = 1.79 × 10⁻⁵ for IR-R, and *P = 0.02 for IS-NR), (B) maximal uncoupled respiration (***P = 0.0002 for T2D-R, **P = 0.002 for IR-R, and *P = 0.02 for IS-NR), (C) GSH/GSSG ratio (***P < 0.0001 for T2D-R, ***P = 0.0009 for IR-R, and ***P = 0.0002 for IS-NR), (D) protein kinase Cε (PKCε) (*P = 0.02 for T2D-R; #P = 0.02 T2D-R versus IR-R, #P = 0.04 T2D-R versus IS-NR), (E) PKCθ (*P = 0.03 for T2D-R), and (F) NF-κB (*P = 0.01 for IR-R) Western blot analysis in the subgroups T2D-R (N = 16), IR-R (N = 9), and IS-NR (N = 7) at baseline and after 12-week HIIT. Data are expressed as means ± SEM. A.U., arbitrary units.
Fig. 3.
Fig. 3.. HIIT intervention increases the release of circulating SEVs in humans with T2D-R and IR-R but not in IS-NR to exercising.
(A) Representative distribution profiles of SEV isolated from serum of a patient with T2D at baseline (red plot) and after 12-week HIIT (orange plot); (B) morphology of serum SEV imaged using TEM (scale bars, 100 nm); (C) Western blot analysis of proteins extracted from cell lysate (HepG2), SEV, and the original serum before SEC (diluted 1:15); (D) plots of peak and diameter sizes of SEV isolated from T2D-R (N = 8), IR-R (N = 8), and IS-NR (N = 6) at baseline and after 12-wk HIIT; (E) number of circulating SEV at baseline (#P = 0.04 T2D-R versus IS-NR); and (F) number of circulating SEV log10-transformed at baseline and after 12-week HIIT (*P = 0.01 for T2D-R and *P = 0.02 for IR-R) in the pilot group including T2D-R (N = 8), IR-R (N = 8), and IS-NR (N = 6) humans. Data are expressed as means ± SEM.
Fig. 4.
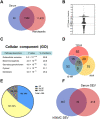
Fig. 4.. Characteristics of SEV proteins differentially regulated after the 12-week HIIT.
(A) Venn diagram showing the overlap of the proteins identified in serum SEV with the human protein entries in the EV database Vesiclepedia. Gene products were matched in FunRich. (B) Volcano plot depicting the FCs in proteins isolated from circulating SEV comparing 12-week HIIT versus baseline: Only proteins with an FC of <0.67 or >1.5 (absolute log FC > 0.5) were included for further analysis. (C) GO-CC analysis for the 262 SEV proteins regulated after the 12-week HIIT with P value and percentage of proteins. (D) Venn diagram showing the overlap of proteins regulated after the 12-week HIIT among the three groups. (E) Amino acid sequences of the SEV proteins regulated during exercise (262 entries) were analyzed to predict the presence of a secretory signal peptide (SP). (F) Venn diagram showing the overlap of proteins regulated after 12-week HIIT in circulating SEV and after EPS in hSkMC-derived SEV in vitro.
Fig. 5.
Fig. 5.. HIIT differently affects the proteomic profile of SEVs in IR (IR-R and T2D-R) and IS humans.
Cellular functions, pathways, and biological process of the SEV proteins regulated during exercise in T2D-R (A), IR-R (B), and IS-NR (C). Squares indicate the unique pathways for each group.
Fig. 6.
Fig. 6.. Selected SEV-cargoed proteins are differentially expressed in skeletal muscle after HIIT.
Western blot analysis of pAMPKα(Thr172)/AMPKα (#P = 0.03 T2D-R versus IR-R) (A), pIRS1(Ser1101)/IRS1 (B), pIRS1(Ser307)/IRS1 (§P = 0.02 T2D-R versus IR-R, §§P = 0.007 IR-R versus IS-NR) (C), NRF2 (##P = 0.001 T2D-R versus IR-R) (D), NQO1 (#P = 0.02 T2D-R versus IR-R) (E), p38/MAPK (#P = 0.01 T2D-R versus IR-R) (F), p42-p44/MAPK (**P = 0.002 for IR-R; P = 0.009 T2D-R versus IR-R, P = 0.02 IR-R versus IS-NR) (G), LC3 (***P = 0.0001 for IS-NR; P < 0.0001 IS-NR versus T2D-R and IR-R) (H), and p62 (*P = 0.02 for IS-NR; P = 0.003 IS-NR versus T2D-R and IR-R) (I) in muscle biopsies obtained from T2D-R (N = 15), IR-R (N = 9), and IS-NR (N = 7) individuals at baseline and after the 12-week HIIT. Data are expressed as means ± SEM.

References

    1. Chudyk A., Petrella R. J., Effects of exercise on cardiovascular risk factors in type 2 diabetes: A meta-analysis. Diabetes Care 34, 1228–1237 (2011). - PMC - PubMed
    1. Colberg S. R., Sigal R. J., Yardley J. E., Riddell M. C., Dunstan D. W., Dempsey P. C., Horton E. S., Castorino K., Tate D. F., Physical activity/exercise and diabetes: A position statement of the american diabetes association. Diabetes Care 39, 2065–2079 (2016). - PMC - PubMed
    1. Stephens N. A., Sparks L. M., Resistance to the beneficial effects of exercise in type 2 diabetes: Are some individuals programmed to fail? J. Clin. Endocrinol. Metab. 100, 43–52 (2015). - PubMed
    1. Kacerovsky-Bielesz G., Kacerovsky M., Chmelik M., Farukuoye M., Ling C., Pokan R., Tschan H., Szendroedi J., Schmid A. I., Gruber S., Herder C., Wolzt M., Moser E., Pacini G., Smekal G., Groop L., Roden M., A single nucleotide polymorphism associates with the response of muscle ATP synthesis to long-term exercise training in relatives of type 2 diabetic humans. Diabetes Care 35, 350–357 (2012). - PMC - PubMed
    1. Sparks L. M., Exercise training response heterogeneity: Physiological and molecular insights. Diabetologia 60, 2329–2336 (2017). - PubMed